Individualized Design of the Ventilator Mask based on the Residual Concentration of CO2
Zhiguo Zhang , Zhenxiao Li, Yifei Zhang, Zhenze Wang and Minzhou Luo
Abstract: OSAHS (Obstructive Sleep Apnea Hypopnea Syndrome) is a respiratory disease mainly characterized by limited and repeated pauses of breathing in sleep.Currently, the optimal treatment is to apply CPAP (Continuous Positive Airway Pressure)ventilation on the upper airway of the patient through a household respiratory machine.However, if the ventilator mask is designed improperly, it might cause the residue and repeated inhalation of CO2, which will exert an adverse impact on the therapeutic effect.Present research numerically analyzed the CO2transportation inside a commercial ventilator mask (Mirage SoftGel, ResMed, Australia) based on the reconstructed 3D numerical model of a volunteer's face and performed the improved design of the ventilator mask in terms of the CO2residual concentration below the nostrils.The fluid dynamic analyses showed that at the end time of expiratory, the CO2residual concentration below the nostrils is close to 4%.To improve the therapeutic effect, we changed the position of the exhaust holes and found that by moving the exhaust holes to the bottom of the ventilator mask, the CO2residual concentration below the nostrils would be reduced to no more than 1%.This study established a near physiological computational model and provided a new method for the individualized design of the commercial ventilator mask.
Keywords: Obstructive sleep apnea hypopnea syndrome, continuous positive airway pressure, ventilator mask, CO2residual concentration, 3D numerical reconstruction.
1 Introduction
Severe snoring is often associated with obstructive sleep apnea hypopnea syndrome(OSAHS), which is mainly characterized by limited and repeated pauses of breathing and can lead to hypoxemia, hypercapnia, and memory deterioration [Liu, Lowe, Fleetham et al.(2001); Chirapapaisan, Likitgorn, Pleumchitchom et al.(2016)].Recent clinical studies show that OSAHS is correlated with the morbidity of diabetes and hypertension,which might lead to cardiovascular and cerebrovascular diseases [Shen, Tan, Song et al.(2017); Sun, Li and Shi (2016); Kim, Choi, Bail et al.(2013); Korcarz, Stein, Peppard et al.(2014)].So far, main treatments for OSAHS include surgical treatment, oral appliance therapy and continuous positive airway pressure (CPAP) ventilation [Vecchierini, Attali,Collet et al.(2016)].Because surgical treatment may relapse or lead to surgical complications, and oral appliance has adverse effects such as mandibular ache,mandibular arthritis or periodontal diseases [Rose, Staats, Virchow et al.(2002); Li(2005)], the non-invasive mechanical CPAP treatment is the major option for OSAHS patients, which can immediately alleviate the symptoms of limited breathing and significantly improve the sleep quality [Buchanan and Grunstein (2011); Mcevoy, Antic,Heeley et al.(2016)].During CPAP treatment, ventilator mask plays a critical role in O2inhalation and CO2exhalation.The improper design of the ventilator mask might result in the residual and repeated inhalation of CO2, which is detrimental to the therapeutic effect[Lofaso, Brochard, Touchard et al.(1995)].Clinical data show that if the CO2concentration constantly inhaled by human exceeds 2%, there will be a headache,cardioacceleration or nausea.If it exceeds 4%, breath will become faster.If it exceeds 5%,it may lead to severe hypoxia, permanent cerebral injury, coma or even death [George and Daniel (2001)].Therefore, proper design of the ventilator mask is directly related to the therapeutic effect of OSAHS and has very important significance.
Various studies measured the CO2concentrations in medical ventilator masks or oralnasal masks.Among them, the side stream method (SideStream Spirometry) is a major one.By this method, Mediano et al.[Mediano, Garciario and Villasante (2006)]compared 3 different medical ventilator masks in terms of repeated CO2inhalation during CPAP treatment; Peng et al.[Peng, Wang and Zhang (2005)] compared the impact of 3 different exhalation valves on the repeated inhalation of CO2; Huang et al.[Huang, Wang and Tan (2015)] monitored the partial pressure of CO2inside the oral-nasal mask in a lung drive model (spontaneous breathing movements established).However, the limitation of the side stream method lies in that the catheter stretched into the mask would disturb the internal flow field and affect the measurement results of the local CO2concentration.Therefore, numerical simulations become the most important alternatives.Nevertheless, there are few studies on the ventilator masks of household CPAP machines.The existing studies are mainly focused on medical nasal masks or oral-nasal masks.Even so, these numerical models are over simplified.Scuh as Chen [Chen (2011)] only reconstructed a 3D numerical model of the mask without taking the patient's face into consideration.Their model was obviously an over-simplified one that could hardly reflect the real physiological condition.
In present study, a 3D numerical model of a volunteer’s face integrated with the ventilator mask (Mirage SoftGel, ResMed, Australia) was built based on reverse engineering method.Then, the CO2transportation inside the ventilator mask under transient state was numerically analyzed with the boundary condition of nostrils.Finally,the improved design of the ventilator mask was performed based on the residual concentration of CO2.
2 Materials and methods
2.1 Geometric model and the meshes
Firstly, the point cloud data of the ventilator mask (Mirage SoftGel, ResMed, Australia)and the face of the volunteer (male, 28 years old, OSAHS) were collected with the 3D laser scanner (HandySCAN700TM, Creaform, Canada); then, the point cloud data were imported into the reverse engineering software (Geomagic Wrap) for post processing.The detailed steps were as follows:1) Redundant point cloud data on the outside of the ventilator mask and the face were removed; 2) The point cloud data scanned from different directions were registered and combined into a whole for denoising; 3) The point cloud data were smoothed with the Mesh Doctor; 4) The results were imported into the Geomagic Design X to reconstruct the 3D numerical models of the ventilator mask and the volunteer’s face; 5) The numerical models were imported into the ANSYS ICEM CFD 15.0 for meshing with the unstructured tetrahedral-hexahedral hybrid mesh.The obtained mesh models included about 375278 elements and 95042 nodes based on the mesh independence test; 6) The mesh models were imported into the ANSYS fluent 15.0 for CFD analysis (Fig.1).
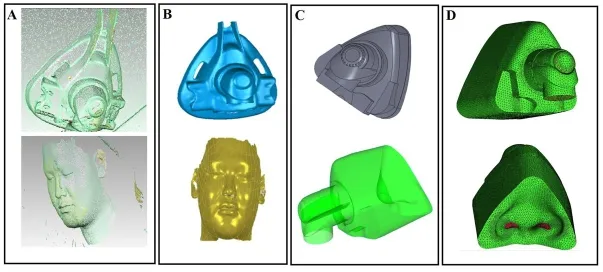
Figure 1:The reconstructed 3D numerical models of the ventilator mask (Mirage SoftGel, ResMed) and the face of the volunteer.A.The collected point cloud data; B.The fixed and encapsulated polygon model; C.The 3D numerical model of the ventilator mask integrated with the volunteer's face; D.The meshes
2.2 Governing equations
The air is assumed to be Newtonian and incompressible viscous fluid.The Navier-Stokes and mass transfer equations are as belows:

where ρ, t, u, p, ψ, μ represents the density (kg⁄m3), time (s), flow velocity (m/s),pressure (Pa), diffusion coefficient and kinetic viscosity, respectively.ψ =1.38×10⁻⁵m2⁄s, μ =1.789×10⁻⁵N ∙s⁄m2[Calay, Kurujareon and Holdo (2002)].
2.3 Boundary conditions and solutions
i.Inlet boundary condition at the entrance of the ventilator mask:The pressure Pin=0.98×10³Pa [Wakayama, Suzuki and Tanuma (2016)]; the averaged concentration of CO2CO2=0.03% [De Vis, Lu, Ravi et al.(2017)] (Fig.2A);
ii.Outlet boundary condition at the exhaust holes: Pout=0Pa (Fig.2A);
iii.Inlet boundary condition at the nostrils:The averaged velocityt=0~2.0 s is the expiratory phase, t=2.0~4.0 s is the inspiratory phase (Fig.2B); the averaged concentration of CO2excreted from the nostrils is set as 4% [Zhu and Wang(2013)] and the CO2is inhaled freely in the inspiratory phase (Fig.2C);
iv.Rigid and non-slip wall boundary condition.
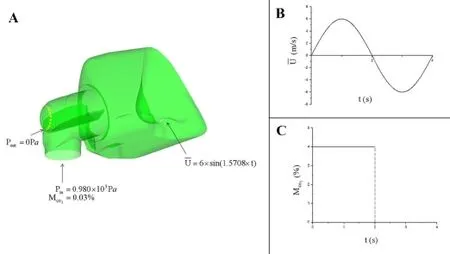
Figure 2:Boundary conditions:A.A schematic draw of the boundary conditions; B.Sinusoidal velocity inlet boundary condition at the volunteer’s nostrils; C.Plot of the averaged CO2concentration excreted from the nostrils in a respiratory cycle
The airflow inside the ventilator mask is assumed to be turbulent flow for the reason of the averaged Reynolds number at the inlet is approximately 4300 (Re>4000) [Levitzky(2007)].The K-ε and Species models are used for computation.The software ANSYS fluent 15.0 is utilized for solving.The time step was set as 0.01 s.
3 Results and dicussion
3.1 Analysis of the CO2distributions inside the ventilator mask
Fig.3 is the distribution of the M̅CO2inside the ventilator mask varying with time during a respiratory cycle.Therises dramatically with the increasing exhaled air and reaches the peak value of=3.65% at t=1.1 s.Then, with the decrease of the exhaled air, thedeclines gradually and down to the value of 1.8% at the end time of expiratory (t=2.0 s).During the initial 0.5 s of the inspiratory phase, thedeclines sharply and down to the initial value of 0.03%.It can be seen that the residual CO2is mainly dependent on the value ofat the end time of expiratory, which will be inhaled again.
Hence, the distribution of the residual CO2at the end expiratory time (t=2.0 s) was analyzed in detail.Fig.4A is the schematic draw of the crosssection Y-Y’ (Y=7.5 mm)and Z-Z’ (Z=75 mm).Figs.4B and 4C are the air velocity vector diagram and the cloud map of the CO2concentration on the crosssection of Y-Y’, respectively.Figs.5A and 5B is the air velocity vector diagram and the cloud map of the CO2concentration on the crosssection of Z-Z’, respectively.It can be seen that due to the existence of the deflector,the inlet air firstly flows rapidly towards the inner and then flows towards the exhaust holes under the differential pressure (Fig.4B).Meanwhile, the local vortices arise below the nostrils (Fig.5A).Figs.4C and 5B show that thedecreases to 1% in high velocity area and increases to 3% in low velocity vortex area.
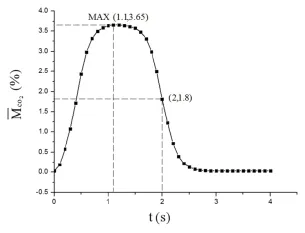
Figure 3:Distribution of the averaged residual CO2concentration inside the ventilator mask varying with time during a complete respiratory cycle M irepresents the CO2concentration of the i th centroid,volirepresents the volume of the i th centroid)

Figure 4:A.Schematic draw of the crosssection Y-Y’ and Z-Z’; B.The velocity vector plot on the crosssection Y-Y’ at t=2.0 s; C.The cloud map of the residual CO2concentration on the crosssection Y-Y’ at t=2.0 s
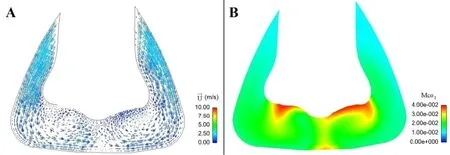
Figure 5:A.The velocity vector plot on the crosssection Z-Z’ at t=2.0 s; B.The cloud map of the residual CO2concentration on the crosssection Z-Z’ at t=2.0 s
3.2 Effects of the deflector on the averaged residual CO2concentration
Fig.6A shows the geometric model of the ventilator mask without deflector.Because the inlet air flows directly towards the exhaust holes and large low velocity vortices arise below the nostrils (Fig.6B), a great deal of CO2residues inside the mask with the value ofup to 4% (Fig.6C).

Figure 6:A.The geometric model of the ventilator mask without deflector; B.The velocity vector plots on the crosssection Y-Y’ and Z-Z’ at t=2.0 s; C.The cloud map of the residual CO2concentration on the crosssection Y-Y’ at t=2.0 s
Fig.7 is the distributions of theinside the ventilator mask varying with time with/without deflector.It can be drawn that thewithout a deflector is higher than that with a deflector.At the end time of expiratory (t=2.0 s), the value of thewithout a deflector is as high as 3.7%, which is double value of that with a deflector.Therefore, the ventilator mask without a deflector will lead to more CO2residue.
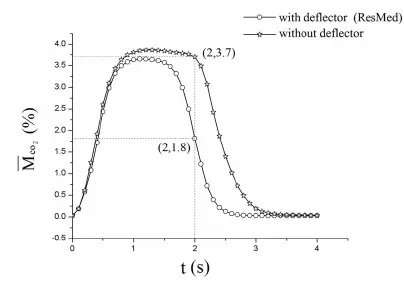
Figure 7:Plots of the averaged residual CO2concentration inside the nasal mask varying with time with/without deflector
3.3 Effects of the exhaust holes’ positions on the averaged residual CO2concentration
To investigate the effects of the exhaust holes’ positions on the, the exhaust holes were redesigned on the top, both sides and the bottom of the ventilator mask, individually,with the same ventilating area.(Fig.8A).
Figs.8B and 8C are the plots of the velocity vector at the end time of expiratory (t=2.0 s),showing that:1) When the exhaust holes are located at the top, most of the inlet air flows towards the top, leading to the lower velocity around the whole mask; 2) When the exhaust holes are located on both sides, the inlet air flows towards both sides, leading to the high velocity in the middle area of the mask and the formation of a low velocity vortex area in front of the nostrils; 3) When the exhaust holes are located at the bottom,the inlet air firstly flows towards the nose bridge, then flows towards the bottom.The air is quickly excreted from the exhaust holes, leading to a high velocity area below the nostrils and the formation of a low velocity vortex area in the distal of the exhaust holes.Figs.8D and 8E are the cloud maps of the residual CO2concentration at the end time of expiratory (t=2.0 s), showing that:1) When the exhaust holes are located at the top, a great deal of CO2is trapped below the nostrils (≈ 4%); 2) When the exhaust holes are located on both sides, thedecreases to 50% (≈ 2%)except the CO2trapped near the wall of the mask; 3) When the exhaust holes are located at the bottom,the CO2is quickly excreted from the exhaust holes and thedecreases to 25%(≤ 1%).
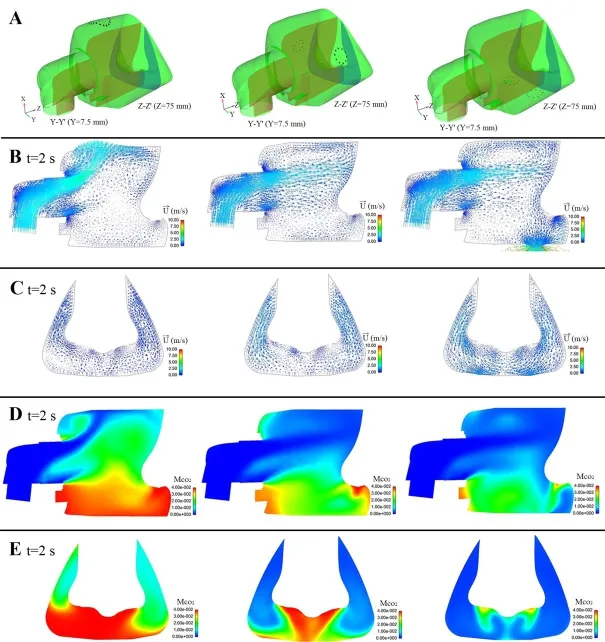
Figure 8:A.Different positions of the exhaust holes; B.The velocity vector plots on the crosssection Y-Y’ at t=2.0 s; C.The velocity vector plots on the crosssection Z-Z’ at t=2.0 s; D.The cloud maps of the residual CO2concentration on the crosssection Y-Y’ at t=2.0 s; E.The cloud maps of the residual CO2concentration on the crosssection Z-Z’ at t=2.0 s
Fig.9 is the comparison analysis of thevarying with time inside the ventilator masks with different designs of the exhaust holes:1) When the exhaust holes are located at the top, the peak value of theis about 3.25%, which is lower than that of the Mirage SoftGel ventilator mask (3.65%).Meanwhile, theat the end time of expiratory is about 2.1%, which is higher than that of the Mirage SoftGel ventilator mask(1.8%); 2) When the exhaust holes are located on both sides, the M̅CO2rises quickly to the peak value (about 3.7%) at t=1.3 s, then declines rapidly to the value of 1.4% at the end time of expiratory; 3) When the exhaust holes are located at the bottom, the M̅CO2is lower than that of the other three designs in the whole expiratory phase and reaches the value of 0.7% at the end time of expiratory, which is significantly lower than that of the Mirage SoftGel ventilator mask (3.65%).
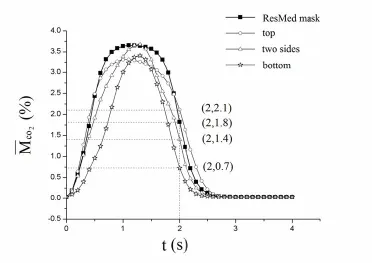
Figure 9:Plots of the averaged residual CO2concentration varying with time inside the nasal masks with different designs of the exhaust holes
4 Conclusion
With the air pollution as well as the changes in living and eating habits of people,OSAHS is becoming a more and more common respiratory disease, which may cause various cardiovascular and cerebrovascular diseases, and even lead to sudden death during sleep.Due to the trauma and easy relapse of surgical treatment, nowdays the commercially available household CPAP machine is commonly used to correct this sleep disorder.Ventilator mask is the most important component of this system and plays a key role in O2inhalation and CO2excretion.The less CO2residue, the better for the therapeutic effect.Therefore, the optimal design of the ventilator mask under near physiological condition is very important.
In present article, a 3D numerical model of the ventilator mask integrated with a volunteer’s face was established and the nostrils boundary condition was considered,which were much closer to the reality.The results showed that the local averaged residual CO2concentration near the nostrils could reach to almost 4%, which was detrimental to the therapeutic effect.Therefore, the improved design of the ventilator mask was performed and found that by changing the position of the exhaust holes to the bottom, the local residual CO2concentration could decrease to 0.7%.Present study established a near physiological computational model and provided a new method for the individualized design of the commercial ventilator mask.In the future, a more realistic boundary condition of human nostrils should be applied and a more reasonable method for the determination of carbon dioxide might be found.
Acknowledgment:We acknowledge the National Natural Science Foundation of China for supporting the project via the grant number 11472062 and 11002034.
 Computer Modeling In Engineering&Sciences2018年11期
- Computer Modeling In Engineering&Sciences的其它文章
- Pose Estimation of Space Targets Based on Model Matching for Large-Aperture Ground-Based Telescopes
- On the Robustness of the xy-Zebra-Gauss-Seidel Smoother on an Anisotropic Diffusion Problem
- A Shaft Pillar Mining Subsidence Calculation Using Both Probability Integral Method and Numerical Simulation
- Modeling and Control Strategy of Built-in Skin Effect Electric Tracing System
- A Virtual Boundary Element Method for Three-Dimensional Inverse Heat Conduction Problems in Orthotropic Media
- Kautz Function Based Continuous-Time Model Predictive Controller for Load Frequency Control in a Multi-Area Power System
