Research on Arterial Stiffness Status in Type 2 Diabetic Patients Based on Pulse Waveform Characteristics
Gaoyang Li, Xiaorui Song, Aike Qiao and Makoto Ohta
Abstract: For patients with type 2 diabetes, the evaluation of pulse waveform characteristics is helpful to understand changes in arterial stiffness.However, there is a lack of comprehensive analysis of pulse waveform parameters.Here, we aimed to investigate the changes in pulse waveform characteristics in patients with type 2 diabetes due to increased arterial stiffness.In this study, 25 patients with type 2 diabetes and 50 healthy subjects were selected based on their clinical history.Age, height, weight, blood pressure, and pulse pressure were collected as the subjects’basic characteristics.The brachial-ankle pulse wave velocity (baPWV) was collected as an index of arterial stiffness.Parameters of time [the pulse wave period (T), the relative positions of peak point (T1) and notch point (T2), and pulse wave time difference between upper and lower limbs (T3)] and area [the total waveform area (A), and the areas of the waveform before(A1) and after (A2) the notch point] were extracted from the pulse wave signals as pulse waveform characteristics.An independent sample t-test was performed to determine whether there were significant differences between groups.Pearson’s correlation analysis was performed to determine the correlations between pulse waveform parameters and baPWV.There were significant differences in T3, A, A1, and A2between the groups(p<0.05).For patients with type 2 diabetes, there were statistically significant correlations between baPWV and T3, A, A1, and A2(p<0.05).This study quantitatively assessed changes in arterial pulse waveform parameters in patients with type 2 diabetes.It was demonstrated that pulse waveform characteristics (T3, A, A1, and A2) could be used as indices of arterial stiffness in patients with type 2 diabetes.
Keywords: Type 2 diabetes, pulse waveform, arterial stiffness.
1 Introduction
Vascular endothelial dysfunction in patients with type 2 diabetes can affect the physiological structure of large and medium-sized arteries and microvascular structures,which can result in decreased vascular elasticity and abnormal structures of organs or tissues and may even lead to arteriosclerosis.A key aspect for type 2 diabetes treatment is early detection and application of suitable remedial measures to prevent the process of arteriosclerosis [Rydén, Standl, Bartnik et al.(2007)].Therefore, the early detection of arterial stiffness is of great significance in clinical patients with type 2 diabetes.
Previous studies have shown that pulse wave velocity (PWV) can reflect arterial stiffness and can be used as a parameter for the early detection of arteriosclerosis in type 2 diabetes [Woolam, Schnur, Vallbona et al.(1962)].The brachial-ankle PWV (baPWV),which is used as a risk indicator for diabetic complications is directly related to the incidence of type 2 diabetes [Aso, Miyata, Kubo et al.(2003)].A high baPWV value can serve as an independent predictor of diabetic mortality and cardiovascular morbidity[Maeda, Inoguchi, Etoh et al.(2014)].For patients with type 2 diabetes, parameters such as the Cardio-ankle vascular index (CAVI) calculated by PWV can also be used as indices of arteriosclerosis [Ibata, Sasaki, Kakimoto et al.(2008); Shirai, Hiruta, Song et al.(2011)].However, owing to technical limitations, errors in PWV measurement inevitably arise [Hughes, Dixon and Mcveigh (2004)], and in most studies, only the pulse wave velocity was selected as the research object, ignoring the pulse waveform.
Noninvasive technology for detecting hemodynamics, represented by pulse wave detection and analysis, has been widely used as an important method of noninvasive detection of cardiovascular function because of its convenient and rapid measurement with high reliability [Allen (2007)].Pulse waveform characteristics such as shape,amplitude, and period are closely related to the functional status of blood vessels.Pulse waves propagate in the arterial vessels and are constantly reflected at the downstream branches of all levels, thus, the pulse waves are not only affected by the heart but also by all levels of arteries and branches via a variety of physiological and pathological factors such as vascular resistance and arterial stiffness [Weber, Wassertheurer, Rammer et al.(2012); Hasegawa, Sato, Numano et al.(2011); Westerhof, Guelen, Stok et al.(2011);Foo, Lim and Wilson (2009); Chowienczyk, Kelly, Maccallum et al.(1999)].Therefore,different physiological and pathological changes produce different waveform characteristics.However, for patients with type 2 diabetes, there is no research on the correlation between pulse waveform and arterial stiffness.Therefore, a comprehensive investigation into their pulse waveform characteristics is necessary.In this study, the pulse waveform data of patients with type 2 diabetes and healthy subjects were collected and characteristic parameters were extracted for statistical analysis.The correlation between baPWV used as the arterial stiffness index and pulse waveform parameters was analyzed to obtain the correlation between waveform parameters and arterial stiffness.The purpose of this study was to demonstrate that pulse waveform characteristics can be used as indices of arterial stiffness in patients with type 2 diabetes.
2 Method
2.1 Subjects
This study was based on the “Study on Evaluation Method of Cardiovascular System Based on Noninvasive Detection of Blood Pressure and Pulse Wave of Limbs” [Song, Li,Qiao et al.(2016)], which recruited over 400 subjects and determined their pulse wave and cardiovascular parameters.A total of 25 patients with type 2 diabetes and 50 healthy subjects registered at Beijing University of Technology Hospital in 2015 were included in this study.The measurements of baPWV and pulse waveform, and recording of basic information such as gender, height, and weight were also performed at the time.A total of 75 subjects fulfilled the following criteria:Exclusion of a diagnosis of limb disability,hypertension, arteriosclerosis, congenital heart disease, heart failure, and a history of artery intervention based on medical interviews, physical examinations, and screening examinations.Additionally, previous studies revealed a correlation between the arterial stiffness and the subjects' basic characteristics such as age and BMI [Mitchell, Parise,Benjamin et al.(2004)].To avoid an influence of these factors on the results, there was no significant difference between the healthy subjects and the diabetics in this study in terms of age, height, weight, and other basic characteristics, which ensured that the change of pulse waveform was mainly caused by type 2 diabetes.The study protocol was approved by the Committee on the Ethics of Human Research of Beijing University of Technology.All participants provided written informed consents on the basis of a detailed understanding of the content of this study.
2.2 Pulse wave and baPWV measurement
Four limb pulse waves and blood pressure were measured using a Fukuda VS-1500A blood pressure and pulse measuring device (Fukuda Company, China) with the assistance of experienced doctors.All subjects were told the detection time several days in advance,and they were told not to eat stimulant food or drinks before the collection was completed.After resting for 15-20 min, each subject placed their hands on both sides of their body in a supine position.A phonocardiogram sensor was fixed in the second intercostal space on the sternum.Cuffs were fixed on the upper arms and ankles and electrodes were fixed at the left and right wrists.The device automatically obtained blood pressure and pulse waveform data of four limbs and automatically calculated the baPWV using the height of the subjects.The obtained data was stored in a database.
2.3 Pulse characteristics determination
2.3.1 Pulse waveforms denoising and normalization
First, the off-line signal processing was used on the pulse waves to remove the various noise signals introduced in the signal acquisition process [Chowienczyk, Kelly,Maccallum et al.(1999)].Next, all the pulses of four limbs were averaged to obtain a single reference pulse (the averaged raw pulse) of every limb, as shown in Fig.1a.According to the Nyquist theorem and the sampling frequency of the device, the averaged raw pulse was processed with a calibration for each period of 100 sampling points.This study focused on the pulse shape change.Thus, the pulse amplitude was calibrated to 0-100.An example of the processing result of one limb is shown in Fig.1b.Following this,the pulse waveform characteristics were extracted.
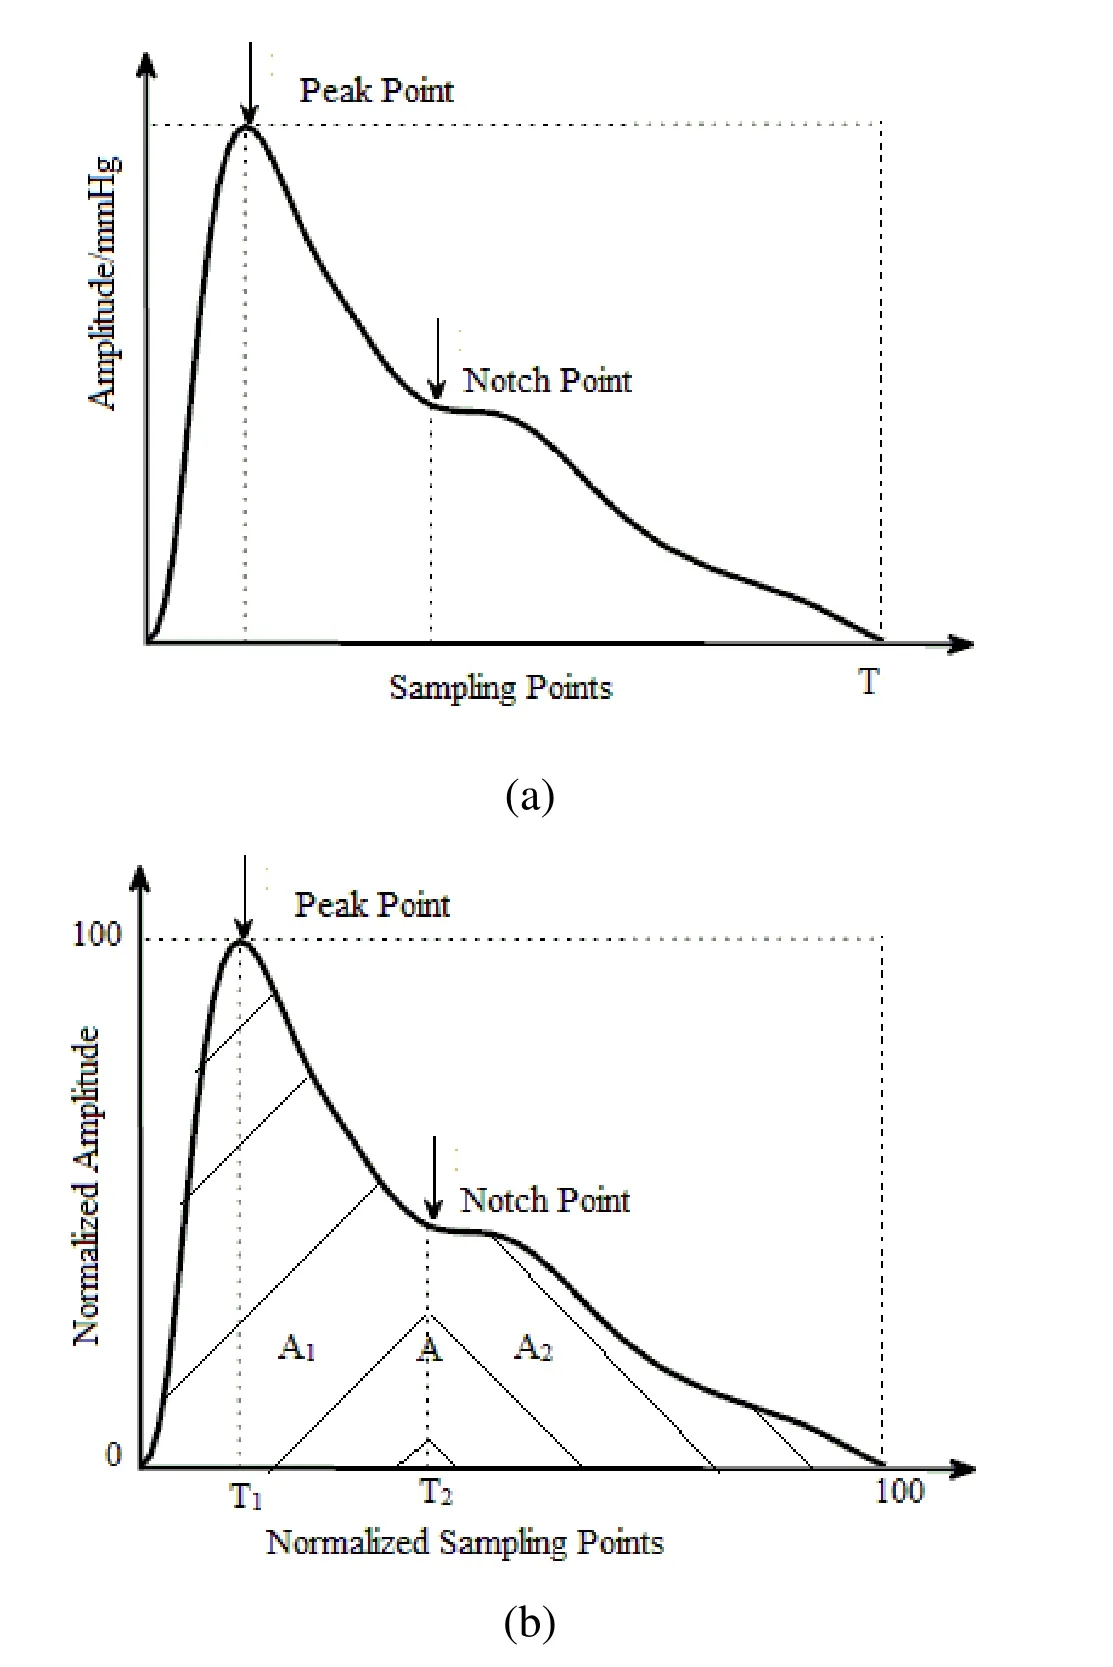
Figure 1:The pulse waveform characteristic extraction from the averaged raw pulse waveform (a) and normalized pulse waveform (b)
2.3.2 Pulse waveforms characteristics
The pulse wave period (T), which was determined by the number of sampling points contained in the original waveform, was extracted from the averaged raw pulse as shown in Fig.1a.The relative positions of the peak point (T1) and notch point (T2), total waveform area (A), and the areas of the waveform before (A1) and after (A2) the notch point were extracted from the calibrated pulse waveform as shown in Fig.1b.These parameters can be used to characterize the arterial compliance of the subject as well as the artificial stiffness [Weber, Wassertheurer, Rammer et al.(2012); Li, Yang, Zhang et al.(2007); Zhang, Wang, Zhang et al.(2005); O’Rourke and MichaeIF (1982)].
During one cardiac cycle, the blood flow to the lower-extremity arteries takes longer than that in the upper limbs.Consequently, when using the starting point of the pulse wave period of the upper limb as a baseline, the pulse waveform of the lower-extremity arteries will be delayed.As shown in Fig.2, the delay time depends on the PWV in the lowerextremity arteries, which is directly influenced by the lower-extremity artery stiffness.Lower-extremity amputation and diabetic foot disease, which also have a direct relationship with the change of lower-extremity artery stiffness, are common complications of diabetes mellitus [Rith-Najarian and Reiber (2000)].Therefore, the delay time (T3), which is based on the number of original waveform acquisition points,was extracted as one of the characteristic parameters.The T3value can directly affect the calculated baPWV value.Compared with baPWV, measurement of T3is simpler and more accurate.This study analyzed the correlation between the T3parameters and the corresponding baPWV values to determine the typicality of the selected samples.

Figure 2:The determination of waveform characteristics T3
2.4 Statistical analyses
The parameters were analyzed using the SPSS15.0 statistical software.The mean±SD of the parameters (baPWV, blood pressure, and pulse pressure; and T, T1, T2, T3, A, A1, and A2) was calculated for the healthy and diabetic subjects.An independent sample t-test was performed to determine whether there were significant differences in the parameters that we chose between healthy and diabetic subjects.Pearson’s correlation analysis was used to determine the degree of correlation between pulse waveform parameters and baPWV, which was used as an index of arterial stiffness.A p value less than 0.05 was considered statistically significant.
3 Results
3.1 Result of independent samples t-test
Tab.1 shows the basic characteristics of healthy and diabetic subjects.Compared with the healthy subjects group, the diabetic group differed significantly in terms of variables including the pulse pressure and systolic pressure (except at the left arm).
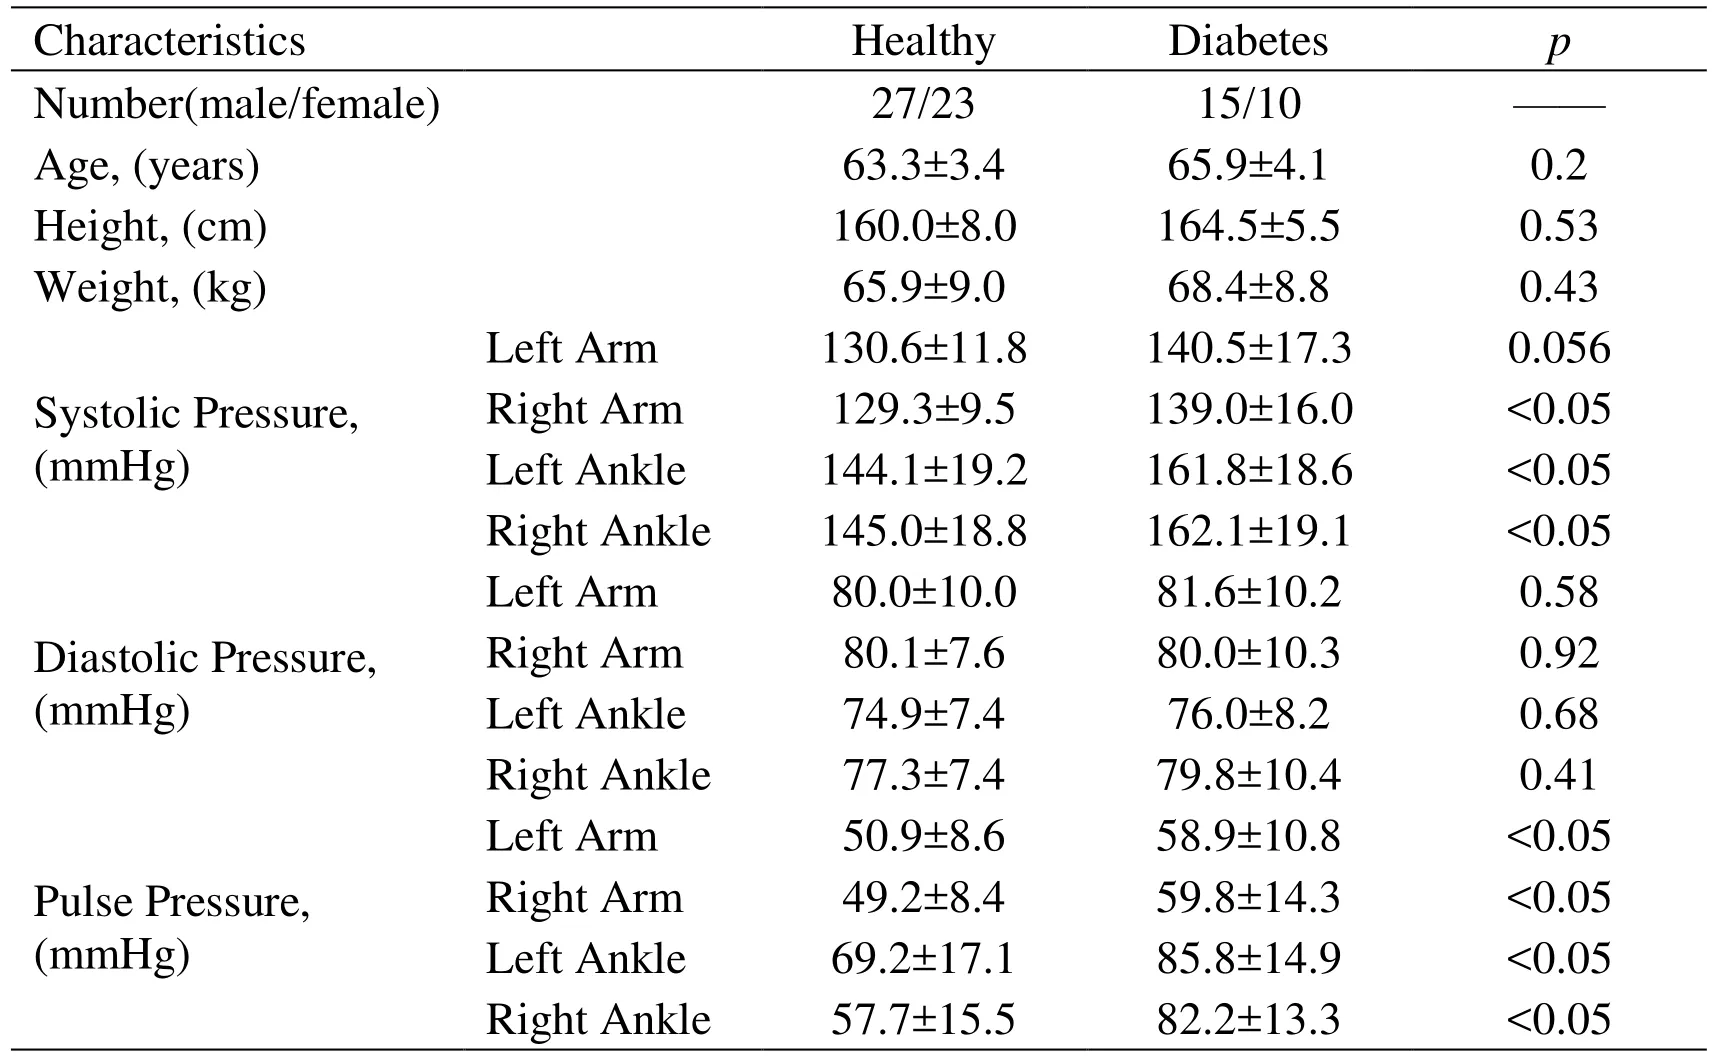
Table 1:Basic characteristics of the subjects with or without diabetes
An independent sample t-test was also conducted on the two groups to determine the pulse waveform parameters that differed significantly between them.The results are presented in Tab.2.
On comparing the pulse waveform parameters between these two groups, significant differences between these parameters were observed, including in A, A1, and A2, which were separated by the dicrotic notch point, T3(p<0.05).For the diabetic group, the values of A, A1, and A2were higher than those of the healthy group, while the value of T3was lower than that of the healthy group.The remaining waveform parameters (pulse wave cycle T, the pulse peak position T1, dicrotic notch position T2) did not significantly differ between the two groups.

Table 2:The comparison of pulse waveform parameters between healthy and diabetes
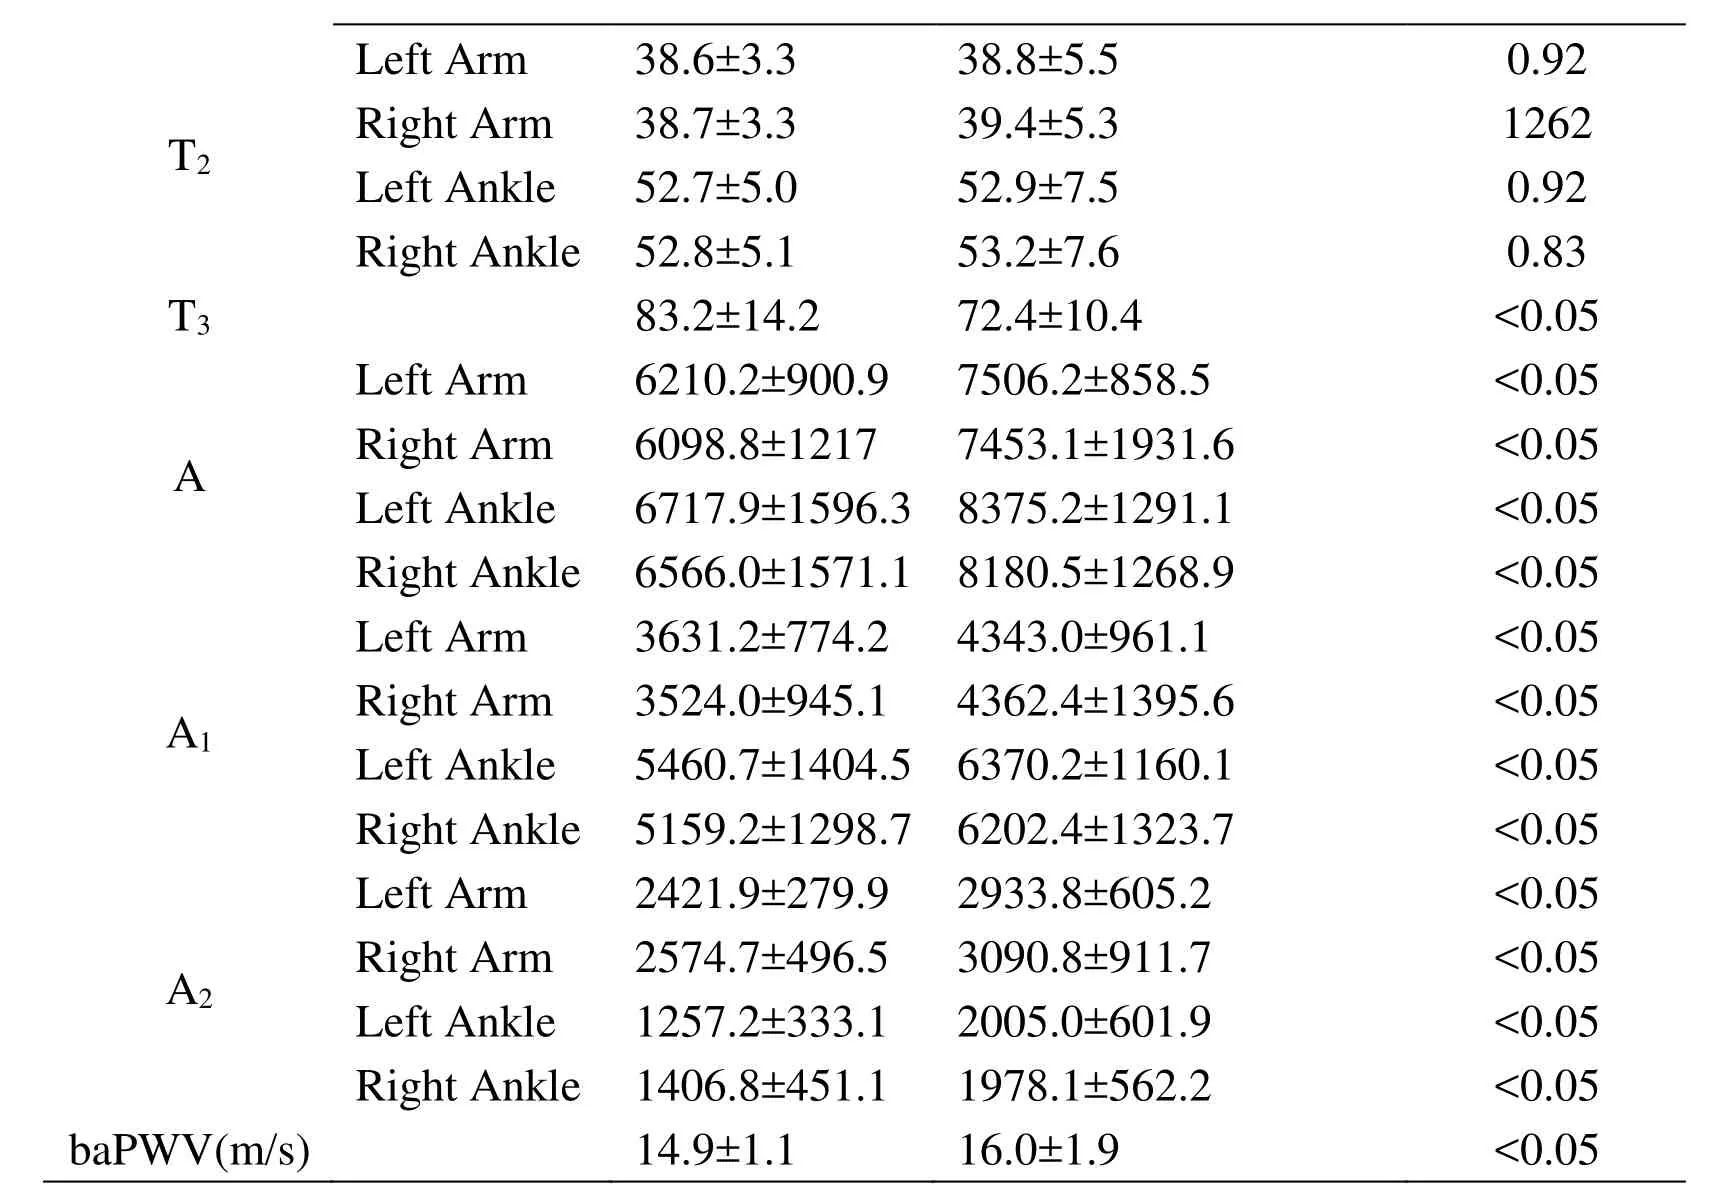
Data are presented as mean±SD.p values were calculated using the independent samples t-test.
3.2 Pearson’s correlation test
Previous studies demonstrated that baPWV is directly related to the incidence of type 2 diabetes, which can be used to assess the risk factors for diabetic complications.The baPWV can be used to characterize the arterial stiffness of patients with diabetes.The basic characteristics (pulse pressure and systolic pressure except for the left arm) and pulse waveform parameters (A, A1, A2and T3) were selected based on the results of the independent sample t-test, which showed that they differed significantly between these two groups.Next, Pearson’s correlation test was performed between those parameters and the corresponding baPWV.The correlation between waveform parameters and the baPWV values was examined to investigate the correlation between the waveform parameters and the arterial stiffness.Pearson’s correlation test results are presented in Tabs.3 and 4.The baseline characteristics of pulse pressure were significantly positively correlated with baPWV (p<0.05).The systolic pressure except the left arm were significantly positively correlated with baPWV (p<0.05).
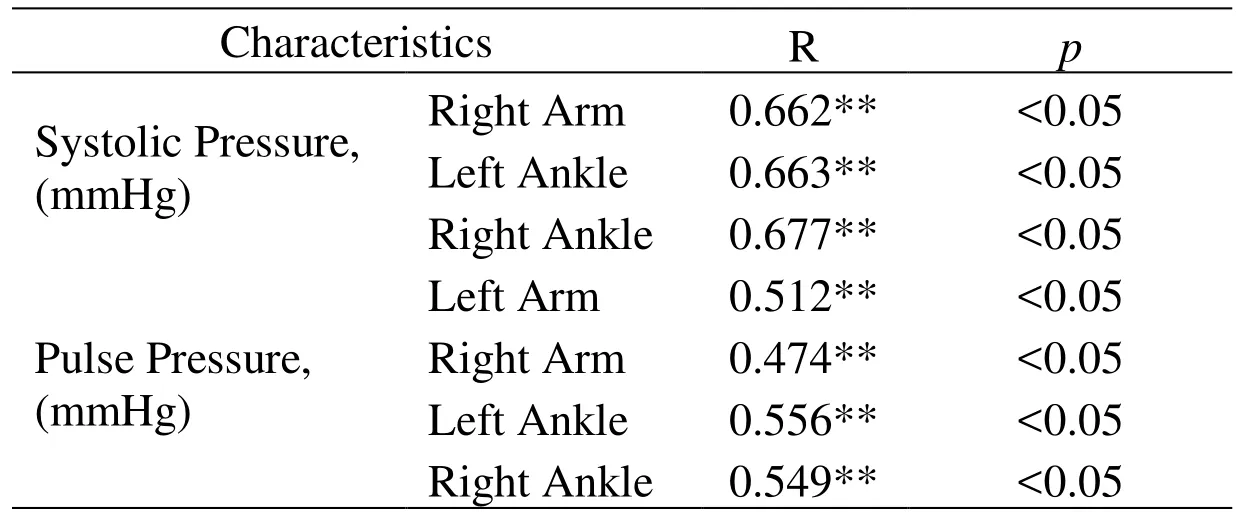
Table 3:Correlation between baseline characteristics and baPWV

Table 4:Correlation between pulse waveform parameters and baPWV
The results showed that A and A1were significantly positively correlated with baPWV(p<0.05).However, only A2of the left arm and left ankle was significantly positively correlated with baPWV (p<0.05).The delay time T3was significantly negatively correlated with baPWV (p<0.05).
4 Discussion and conclusion
Pulse waveform analysis is an effective method to monitor and evaluate arterial vascular functions.Herein, the pulse waveform data from patients with type 2 diabetes and from healthy subjects were collected and characteristic parameters were extracted for statistical analysis.Next, the correlations between baPWV used as an index of arterial stiffness and pulse waveform parameters were analyzed to obtain the correlation between waveform parameters and arterial stiffness.Pulse area parameters (A, A1, and A2) showed significant differences (p<0.05) between groups and had significant correlations (p<0.05)with arterial stiffness.T3as a time parameter also provided the same statistical results.Thus, the pulse waveform parameters (T3, A, A1and A2) can be used as an index of arterial stiffness for patients with type 2 diabetes.This was the first study to comprehensively investigate the pulse wave shape and its characteristic differences between patients with type 2 diabetes and healthy subjects.
The waveform parameters selected in this study could have definitive physiological significance.The differences in pulse area parameters (A, A1and A2) between patients with type 2 diabetes and healthy subjects was mainly determined by the difference in wave reflection timing.Previous studies reported that the wave reflection timing was primarily determined by arterial stiffness [Hirata, Kawakami and O’Rourke (2006);Mitchell, Parise, Benjamin et al.(2004)].Therefore, it could be asserted that the differences in pulse area parameters between patients with type 2 diabetes and healthy subjects were caused by the changes in arterial stiffness.Pulse waves are the superposition of the pressure wave generated by the heart and the pressure wave reflected from the body in a cardiac cycle (Fig.3).The reflected pressure wave can be divided into two types.Wave 1 was mainly reflected from the arterial branch during late systole or early diastole, whereas wave 2 was mainly caused by the collision between the blood and the closed aortic valve during diastole [Huang, Chang, Kao et al.(2010); Hirata,Kawakami and O'Rourke (2006); Mitchell, Parise, Benjamin et al.(2004)].A1from the beginning to the notch point indicated the physiological characteristics of the cardiovascular system during systole.A1primarily depended on the pressure wave generated by the heart and the timing of wave 1.A2after the notch point depended on the timing of wave 1 and wave 2.In this study, increased pulse area parameters were observed for type 2 diabetic patients.The increase of A can be explained by the increase of A1and A2, whereas the increase of A1and A2could be explained by the difference of wave reflection timing caused by a change in arterial stiffness.In healthy subjects,because of the low arterial stiffness resulting in a small baPWV value, wave 1 usually occurred near the notch point [Mitchell, Parise, Benjamin et al.(2004)].Wave 1 had little influence on the amplitude and width of the main pulse wave, but influenced the dicrotic wave.In contrast, for patients with type 2 diabetes, the baPWV value was higher because of increased arterial stiffness.Wave 1 appeared early, and its relative position was close to the pressure wave generated by the heart, even with the superposition, which made A1higher due to the amplitude and width of the main pulse wave being increased.For patients with diabetes, although the high amplitude of wave 2 lead to high A2, wave 1 made no contribution to the increase of A2.Furthermore, previous studies reported that the changes in peripheral resistance and blood viscosity also had a great influence on A2[Huang, Chang, Kao et al.(2010)].This could be the reason for no significant correlation between baPWV and A2of the right arm and ankle.In this study, although A2could reflect the physiological characteristics during diastole, it had limitations as an index for characterizing the arterial stiffness.
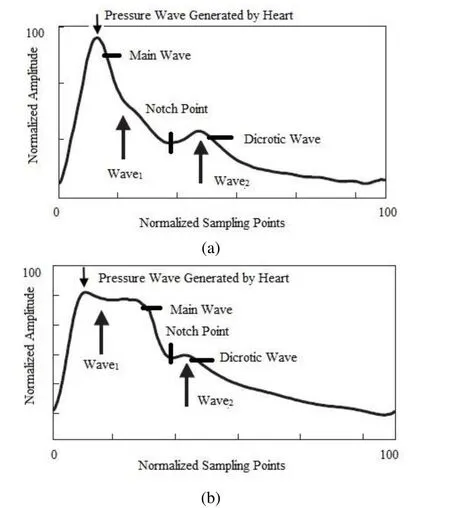
Figure 3:Determination of the pressure wave generated by the heart, reflection wave1and reflection wave2.The arrow indicates the timing of the three waves.Compared with healthy people (a), the pulse area parameters of patients with type 2 diabetes patients (b)increased significantly
We observed that pulse time parameters (T, T1and T2) had no significant correlation(p>0.05) with baPWV.This result was in agreement with those reported by previous studies describing that those time parameters were mainly determined by the condition of the heart function within one cardiac cycle, not the arterial stiffness change [Lacey and Lacey (1978)].As for T3, it was the time difference between the pulse wave of upper and lower limbs.T3showed statistically significant differences between groups and had a strong correlation with arterial stiffness.Previous studies reported that type 2 diabetic patients had a higher risk of peripheral arterial disease [Carmona, Hoffmeyer, Herrmann et al.(2005); Rith-Najarian and Reiber (2000)], which meant a significant increase in arterial stiffness of the lower limbs.This led to an increase in baPWV and reduction in T3.Therefore, T3could reflect the change in arterial stiffness of the lower extremities in patients with type 2 diabetes.Combined with clinical data of lower-extremity vascular complications in type 2 diabetic patients, such as diabetic foot disease, a comprehensive analysis of T3and the development of lower-extremity vascular complications should be carried out.
This study had several limitations, namely, the relatively limited number of patients with type 2 diabetes and the incomplete information on complications.A comprehensive comparison using additional clinical data on type 2 diabetes is warranted.The selected subjects have limitations in the basic physiological characteristics such as age, height and weight.The selected population cannot reflect the situation of patients with type 2 diabetes mellitus in all age groups and various somatotype.In this study, the statistical analysis results of blood pressure, pulse pressure, and baPWV from 75 subjects were consistent with those in previous studies.The results indicated that although the number of patients was not large, the participants’ characteristics could represent the typical characteristics of the arterial vascular system in patients with type 2 diabetes.Expectedly,the pulse pressure and blood pressure of the diabetic group were higher than those of the healthy subjects.Elevated blood pressure and pulse pressure are more common in people with type 2 diabetes than in the general population [Schram, Kostense, Van Dijk et al.(2002); Adler, Stratton, Neil et al.(2000)].The statistical analysis results of pulse pressure and blood pressure revealed that pulse pressure and systolic blood pressure could be used to determine the physiological status of arteries including arterial stiffness in patients with type 2 diabetes, while diastolic blood pressure had some limitations in this regard, which is in agreement with a previous study [Cockcroft, Wilkinson, Evans et al.(2005)].The high baPWV value of patients with type 2 diabetes showed increased arterial stiffness compared with that in healthy subjects [Woolam, Schnur, Vallbona et al.(1962)], which is in line with the characteristics of arterial physiological and pathological changes in diabetic patients and was the theoretical basis of this study.
In conclusion, this study quantitatively demonstrated a significant change in the pulse waveform characteristics of patients with type 2 diabetes and analyzed the correlation between waveform parameters and arterial stiffness.This study showed that pulse waveform characteristics (T3, A, A1and A2) could be used as indices of arterial stiffness in patients with type 2 diabetes.
Acknowledgment:This work was supported by JSPS KAKENHI Grant Number JP16H01805, the Grant-in-Aid [A] (No16H01805) (Fostering Joint International Research) (15KK0197), the OPERA (JST) “Creation of a Development Platform for Implantable/Wearable Medical Devices by a Novel Physiological Data Integration System”, the ImPACT, (JST) “Bionic Humanoids Propelling New Industrial Revolution”,and the AMED under Grant Number 18he1802004h0002 projects.
 Computer Modeling In Engineering&Sciences2018年11期
- Computer Modeling In Engineering&Sciences的其它文章
- Influence of Geometric Design Variable and Bone Quality on Stress Distribution for Zirconia Dental Implants-A 3D Finite Element Analysis
- Individualized Design of the Ventilator Mask based on the Residual Concentration of CO2
- Kautz Function Based Continuous-Time Model Predictive Controller for Load Frequency Control in a Multi-Area Power System
- A Virtual Boundary Element Method for Three-Dimensional Inverse Heat Conduction Problems in Orthotropic Media
- Modeling and Control Strategy of Built-in Skin Effect Electric Tracing System
- A Shaft Pillar Mining Subsidence Calculation Using Both Probability Integral Method and Numerical Simulation
