轮毂高度差或上游风力机偏航角对风力机总功率输出的影响
杨从新,何 攀,张旭耀,张亚光,金 锐
轮毂高度差或上游风力机偏航角对风力机总功率输出的影响
杨从新1,2,何 攀1,张旭耀1,张亚光1,金 锐1
(1. 兰州理工大学能源与动力工程学院,兰州 730050; 2. 甘肃省流体机械及系统重点实验室,兰州 730050)
为了研究风力机间轮毂高度差或上游风力机偏航角对风力机总功率输出的影响,该文以NREL 5 MW风力机作为研究对象,基于OpenFOAM开源软件,使用致动线模型和大涡模拟相结合的数值方法。首先对致动线模型中的重要参数高斯分布因子()做了研究,并对数值方法做了可靠性验证;其次对风力机不同叶尖速比下的尾流速度特性进行了分析;最后研究了2种能减小上游风力机尾流效应而使下游风力机输出功率增大的方法。结果表明:在致动线模型中,风轮直径上有50个网格节点,取值为1.6倍的网格尺度时,风力机功率的相对误差最小,为1.1%;风力机尾流速度分布与叶尖速比有关,叶尖速比较大时,近尾流区的速度亏损大,尾流场的速度恢复比较快,叶尖速比比较小时,近尾流区的速度亏损小,尾流场的速度恢复比较慢;串列风力机轮毂高度不同或上游风力机存在偏航角时,可以增大下游风力机功率输出从而增大2台风力机的总功率输出。在入流速度为7 m/s,两台风力机间距离为6倍风轮直径的条件下,当上游风力机轮毂高度减去下游风力机轮毂高度的差值为0.25、0.5和0.75倍的风轮直径时,相比于上、下游风力机不存在轮毂高度差,下游风力机功率输出依次增大了1.36、2.50、4.50倍,2台风力机总功率依次增大了20%、56%和66%。当上游风力机偏航角为15°、30°和45°时,相比于上游风力机偏航角为0°,下游风力机功率输出依次增大了1.58、3.36和4.26倍,两台风力机总功率依次增加了18%、30%和22%。此研究结果可为探究提高风场总功率输出的方法提供参考。
风力机;数值分析;尾流;偏航角;轮毂高度差;总功率输出;致动线;OpenFOAM
0 引 言
随着风场的大型化,由风力机数量增多引起的尾流问题日益显著。来流经过上游风力机后,速度亏损严重,湍动能增大[1-2],导致下游风力机的功率输出减小,当下游风力机完全处在上游风力机的尾流中时,功率损失严重,疲带载荷增加[3-4]。因此通过控制上游风力机尾迹,使下游风力机捕获更多的风能,对提高风力机功率输出,增加风电场效益尤为重要。
为了减少风力机间尾流干扰,提高风场功率输出。Adaramola和Krogstad对2台相同的风力机做了风洞试验,研究了尾流对下游风力机的影响,发现下游风力机功率受入流条件、风力机相对位置和上游风力机运行条件等多种因素影响[5]。因此在风场中可通过改变风力机间的相对位置或控制上游风力机的运行条件来提高风场中风力机的总功率输出。胡丹梅等[6]、李少华等[7]、杨瑞等[8]分别用数值模拟和试验的方法研究了上游风力机尾流效应对下游风力机功率输出的影响,得到了能提高风力机功率输出的最优距离。田琳琳等用小生镜遗传算法对风场做了优化[9];Song等提出了一种在风力机微观选址过程中,计算尾流的粒子模型[10];Dupont考虑成本,风场中风力机的输出功率、尾流干扰和大气稳定度提出了一种风场优化计算的建模系统[11];Fleming等研究了因独立变桨而使尾流效减小时风场的输出功率情况[12];Johnson等通过高精度数值仿真的方法发现上游风力机存在俯仰角可使其尾流发生偏移,从而增大风力机输出功率[13];Guntur等在均匀入流条件下,基于制动盘方法对倾斜尾流建立了经验模型[14]。
从以往的研究可以看出,一方面,通过改变风力机相对位置提高风场中风力机总功率输出的研究,主要集中在风力机之间的距离[6-8]和风力机的布局[9-11]对风力机总功率输出的影响,而轮毂高度差对风力机总功率输出的影响并没有得到国内外学者的广泛关注。所以本文将此作为一个研究点;另一方面,通过改变上游风力机的运行状态的方法提高风力机的功率输出,总体研究比较少[12-14]。而控制上游风力机偏航角最容易操作,也最具有现实意义,所以本文将上游风力机偏航角对风力机总功率输出的影响作为另一个研究点。并且由于传统的全三维模型网格划分复杂,需要耗费巨大的计算资源[15-16],而且下游风力机处在上游风力机的远尾流场,风力机几何外形对远尾流区影响很小[17-18],所以本文使用以体积力代替三维风力机叶片的致动线模型(actuator line model, ALM)研究风力机尾流特性以及尾流对下游风力机的影响[19-21]。
综上,为研究通过在风场中排布不同轮毂高度的风力机或改变上游风力机的偏航角去增大下游风力机的功率输出,从而增大风力机总功率输出的方法,本文选择了2台串列排布的NREL 5 MW风力机作为研究对象,使用致动线模型和大涡模拟(large eddy simulation,LES)相结合的数值方法首先对致动线模型中的关键参数做了研究,并验证了方法的准确性;其次考虑到下游风力机功率输出受上游风力机尾流速度特性影响,而风力机尾流速度特性与轴向诱导因子相关,轴向诱导因子又被叶尖速比()通过推力系数影响,本文研究了不同叶尖速比下风力机尾流的速度特性;最后研究了不同来流速度下两台风力机轮毂高度不同,或上游风力机存在偏航角时,下游风力机的功率输出和两台风力机的总功率输出变化情况。此研究结果可为探究提高风场总功率输出的方法提供参考。
1 研究对象、方案与方法
1.1 数值计算对象
本文使用NREL 5MW风力机作为计算对象[22],风轮基本参数如表1所示。

表1 NREL 5MW风力机主要参数
1.2 数值计算方案
在本文研究中,对于不同的研究的内容,计算域和风力机位置不同。图1为计算域和风力机位置示意图,2台风力机间距离为6[6]。
其中图1a所示的计算域和风力机位置被用来验证数值方法,计算为15、10、8和7(对应风速为3、5、7和11.4 m/s)时的风力机尾流速度特性;图1b被用来研究轮毂高度差对2台的风力机功率输出的影响。为0时,下游风力机风轮正对上游风力机风轮;为负时,下游风力机风轮高于上游风力机风轮;本文研究了不同叶尖速比下为0、0.25、0.5、0.75、−0.25、−0.5、−0.75时的7种工况;图1c用来研究上游风力机偏航角对2台风力机功率输出的影响,研究过程中的取值为15°、30°、45°。
计算区域网格如图2a所示,为了计算出叶尖涡和叶根涡等涡特性,本文在风轮所处位置对网格进行二次加密,加密后风轮直径上为50个网格结点[23],计算域内网格总数为820万,此时风力机位置处截面图为图2b所示。

注:D代表风轮直径,h为上游风力机轮毂高度减去下游风力机轮毂高度的差值,β为上游风力机偏航角。
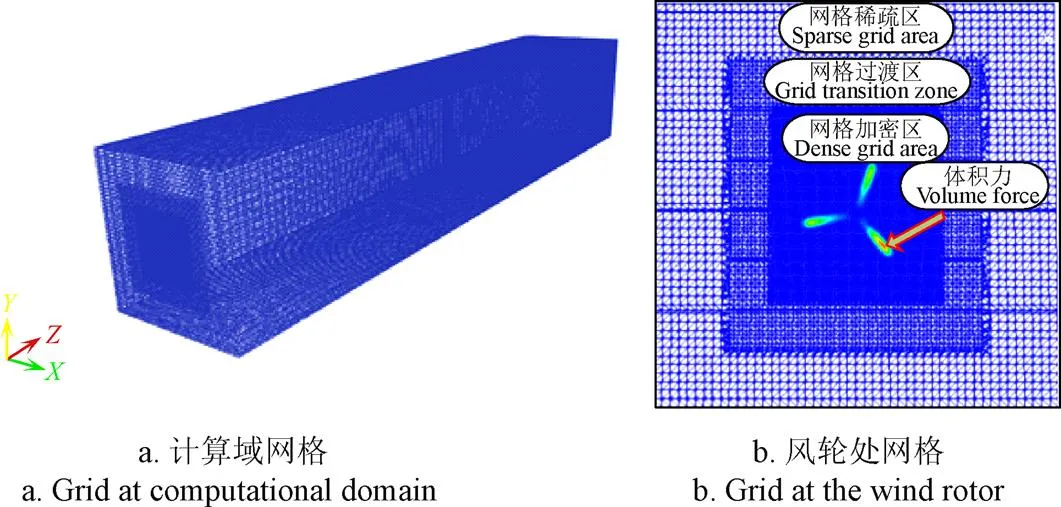
图2 计算域的网格划分
1.3 数值计算方法
1.3.1 大涡模拟
本文采用大涡模拟[24-25]作为数值计算方法,对流场中与风力机几何、边界条件等因素相关的大尺度涡进行数值求解,各项同性的小尺度涡进行模化。式(1)、(2)为三维不可压N-S方程滤波处理后的方程。


式中C和C为无量纲的封闭参数,在本文中的取值分别为0.076和0.93,∆为截至尺度,大于该尺度的涡称为大涡,小于该尺度的涡被称为小涡。
1.3.2 致动线模型
致动线模型[27]是在N-S方程的基础上,把叶片对流场的作用力作为源项加入到N-S方程中的一种模型,其中叶片单位展长受力2D()为

式中为升力,为阻力,为叶片数,rel为翼型截面处来流的合速度;为翼型截面的弦长,C和C分别为升、阻力系数,e和e为升、阻力方向的单位向量。计算升、阻力系数所需要的当地雷诺数和攻角可通过读取流场信息计算得到。致动线上每一点的体积力在以该点为中心的球形范围内以三维高斯形式分布。空间任意一点体积力f()为

式中为网格中心点到叶素点的距离,为制动点到轮毂中心的距离,为风轮半径,η()为分布函数。

式中为高斯分布因子,控制体积力分布的密集程度。
1.3.3 数值离散与边界条件
本文在计算过程中,使用OpenFOAM开源软件进行计算对N-S方程使用有限体积法进行离散。时间项采用Crank-Nicholoson格式,梯度项、对流项、拉普拉斯项等空间项采用高斯线性离散[28-29]。方程在求解过程中,由非线性项引入的亚格子应力在Boussinesq假设的基础上使用Smagorinsky亚格子模型对其封闭。求解方程时使用瞬态压力全隐式分离算法。
计算时,入口采用固定速度入口边界条件,速度方向沿轴正方向。出口采用零压力梯度出口边界条件,计算域壁面处使用滑移边界条件。
2 参数确定与模型验证
2.1 致动线模型中重要参数确定
在致动线模型中,风轮直径上的网格数()和高斯分布因子()直接影响模拟结果的准确性。由文献[23]可知致动线模型要模拟出叶尖涡和叶根涡等涡特性,风轮直径上网格节点数不能少于50个,为节省计算资源,本文计算过程中,取50。而的取值并不确定,与网格尺度有关,的大小为/[30]。因此,为计算出涡特性并保证风轮输出功率在误差允许的范围内,本文在风轮直径上布50个网格节点,对的取值进行了研究。研究过程中取值分别为1.2、1.6、2,用风轮功率的相对误差()作为评价标准。=(−0)/0,式中为数值模拟结果,0为NREL数据。研究发现对于NREL 5 MW风力机,当取1.2时,风轮功率的相对误差比较大,为12.3%;当取1.6和2时,风轮功率相对误差分别为1.1%和3.4%,因此本文计算过程中取1.6。
2.2 不同风速下风力机输出功率验证
为保证计算准确性,本文在上节结论的基础上,对风力机的输出功率做了验证。由于在本文研究中,入流速度分别取为3、5、7和11.4 m/s,对应叶尖速比为15、10、8和7。所以该节验证功率时只将这4种风速下的风力机输出功率的计算值和NREL数据做了对比,结果如图3所示,当入流条件为11.4 m/s时,风力机输出功率的相对误差最小,为1.1%;其他入流体条件下,风力机输出功率的相对误差也均小于10%,满足数值计算要求。其中,NREL 数据经官方校核验证,具有可信度,并且该模型也被国内外其他学者验证、运用[6,31-32]。

注:λ为叶尖速比。
3 结果与分析
3.1 不同叶尖速比时风力机尾流的速度特性分析
下游风力机功率之所以亏损严重,主要是受上游风力机尾流的影响,因此本文首先研究了单台风力机在不同下尾流的速度特性。图4为不同下过轮毂中心点的平面上的速度云图。
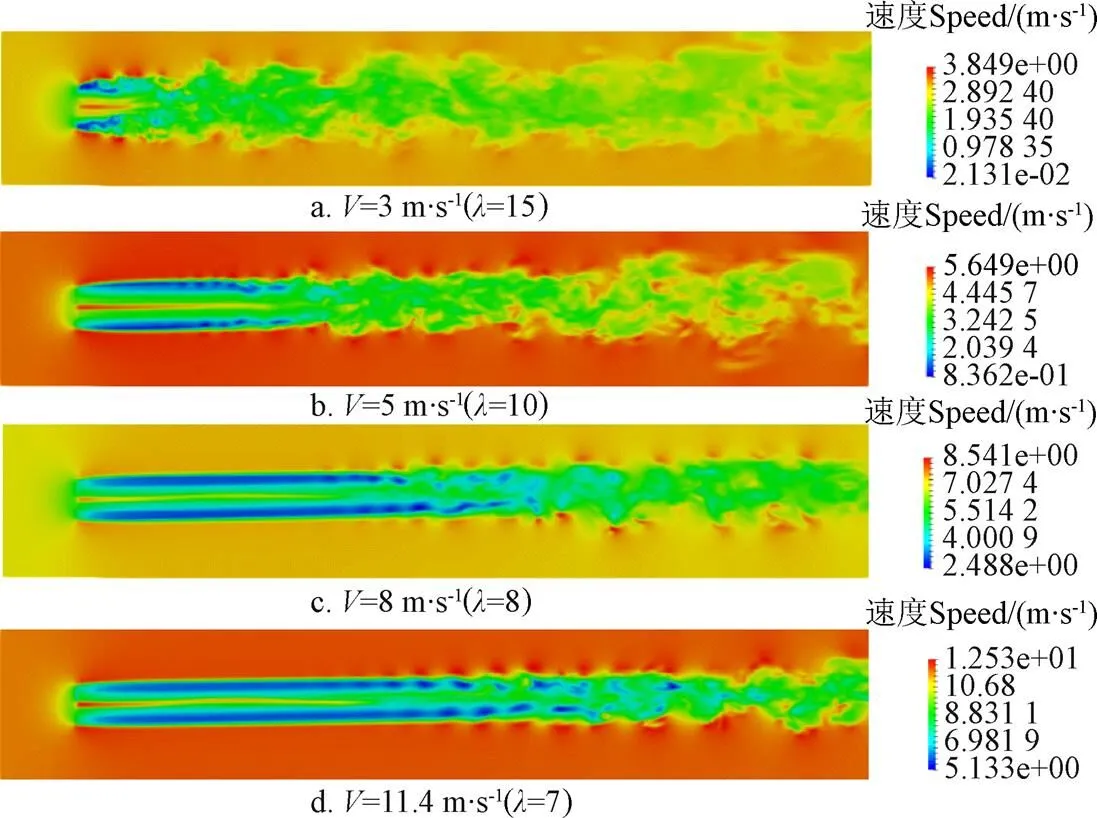
注:V为入流速度,λ为叶尖速比。
从图4中可以看出自由来流经过风力机作用后,尾流区域速度亏损严重;并且在离风轮比较近的区域,尾流速度径向梯度很大;由于致动线模型没有考虑风力机轮毂,所以,当风流经风轮时,轮毂中心处风速受挤压,致使轮毂中心处速度比较大;随着尾流向下游发展,尾流和外界流场相互混掺,在离风力机比较远的区域,径向速度梯度变小,尾流速度增大,轮毂中心处速度亏损变大。
为进一步研究不同叶尖速比下风力机尾流的速度亏损规律,提取了不同时,风力机后1、2、6、10、14和18处的尾流速度,速度分布如图5所示。从图中可以看出由于致动线方法没有考虑机舱,导致轮毂中心处速度比较大,从而导致在离风力机比较近的区域呈“W”型分布,随着尾流的发展,尾流速度呈“倒钟”型分布;比较大时,近尾流区的速度亏损大,比较小时,近尾流区的速度亏损小。当分别为15、10、8、7时,风力机后1位置处速度亏损的平均值分别为来流的45.7%、42.4%、38.8%和33.8%;并且比较大时,尾流速度恢复比较快;当比较小时,尾流速度恢复慢。在风力机后6位置处,速度亏损平均值依次为来流的26.4%、34.2%、38.0%和33.1%,相比于1位置,尾流速度依次恢复了来流速度的19.3%、8.2%、0.8%、0.7%。在风力机后18的位置,从大到小,速度亏损量依次为来流的10.3%、10.0%、9.2%和15.2%,相比1位置处速度分别恢复了35.4%、32.4%、29.6%和18.6%。出现这种现象主要是因为较大时,推力系数比较大导致轴向诱导因子比较大、尾流速度亏损严重,并且尾流向下游推进比较慢。

注:W表示风力机后任意一点的轴向速度,W0表示入流速度,r为速度点到轮毂中心线的距离。
3.2 轮毂高度差对下游风力机功率输出的影响
为提高风场中风力机的总功率输出,可使风场中的风力机具有不同的轮毂高度,本节将研究通过改变2台风力机轮毂高度差来提高风力机的总输出功率。由于篇幅原因,并且当2台风力机相距为6时,上游风力机在不同风速下,尾流效应对下游风力机输出功率影响规律相近,所以下文只分析入流速度为7 m/s的工况。
图6为入流速度为7 m/s,2台风力机间距离为6,不同下为1.0e-5时的速度梯度第二不变量(second-invariant of velocity gradient,<0代表无旋耗散作用;>0代表涡管作用)等值面图。从图中可以看出,改变轮毂高度差能使下游风力机有效地避开一部分上游风力机尾迹,减小上游风力机尾流效应对下游风力机的影响,随着的值增大,下游风力机处在上游风力机尾流中的部分越少。图7为不同风速下,不同时,风力机输出功率的变化曲线。当2台风力机间距离为6时,随着轮毂高度差增大,上游风力机功率几乎不发生变化,下游风力机的功率增大,2台风力机的总功率增大。其中在入流速度为7 m/s的条件下,当为0.25、0.5和0.75时,相比于为0时,下游风力机功率分别增大了1.36、3.50、4.50倍,2台风力机总功率分别增大了20%、56%和66%;当为−0.25、−0.5和−0.75时,相比于为0,下游风力机功率分别增加了20%、2.10和3.36倍,2台风力机总功率依次增大了3%、36%和54%。由于风力机存在仰角,导致尾流向上偏移,所以当|相同时,为正值比为负值,下游风力机输出功率更大,为0.25、0.5、0.75比为−0.25、−0.5和−0.75功率分别大0.96、1.45和0.26倍。
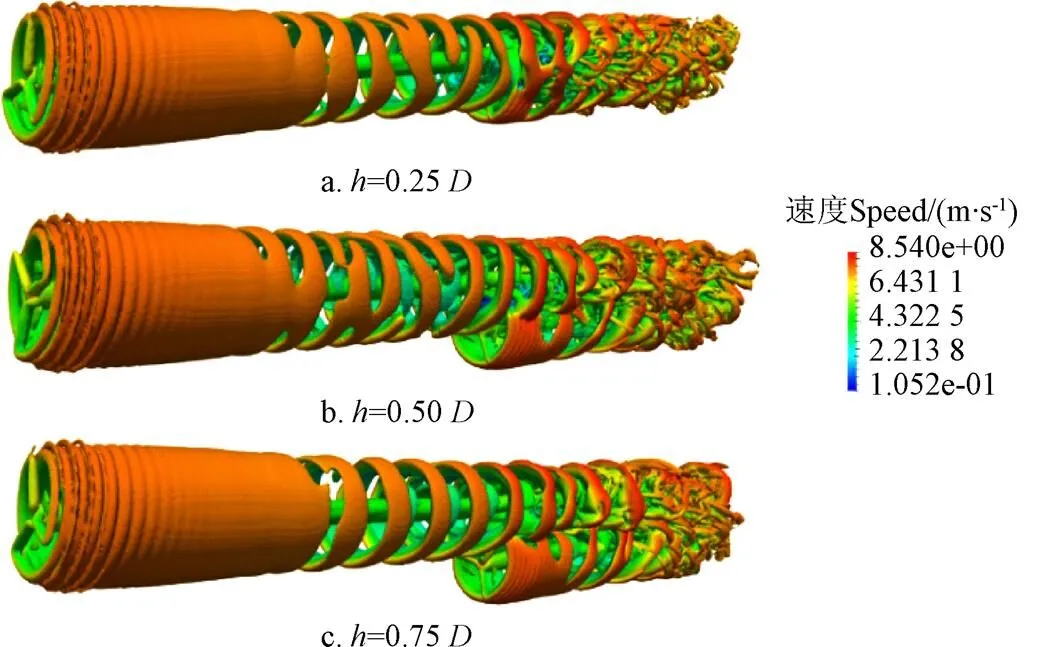
图6 当入流速度为7 m·s-1时,不同轮毂高度差下流场的速度梯度第二不变量等值曲面图

注:P为任意工况下的风力机功率输出,P0为2台风力机轮毂高度相同且上游风力机不存在偏航角时,风力机的功率输出。
3.3 上游风力机偏航角对下游风力机功率输出的影响
在风场中除了采用调整多轮毂高度的方法减小风力机尾流效应的影响外,还可以通过控制上游风力机偏航角,使其尾迹发生倾斜,来减小上游风力机的尾流干扰效应,图8为入流速度为7 m/s,2台风力机间距离为6时,上游风力机存在偏航角时,为1.0e-5时的等值面图,从图中可以看出上游风力机偏航角的存在,导致其尾流向风轮倾斜方向偏移,这主要是因为风轮受到一个垂直于风轮平面的推力,这个推力在来流方向上会有一个分量,气流与该分量发生相互作用后,尾流沿着风轮倾斜方向发生偏移;下游风力机也因此获得了更多的能量。图9为不同风速下,风力机的功率输出随偏航角的变化曲线。从图中可以看出,当2台风力机间距离为6时,随着上游风力机偏航角增大,上游风力机功率减小,下游风力机功率增大,两台风力机总功率先增大后减小,其中在入流速度为7 m/s下,上游风力机偏航角为15°、30°和45°时,相比于上游风力机偏航角为0°,上游风力机功率分别减小了6%、23%和48%,下游风力机功率增加了1.58、3.36和4.26倍,2台风力机总功率增加了18%、30%和22%;当上游风力机偏航角为30°时,2台风力机总功率输出最大,所以风场中可以利用控制上游风力机的偏航角来增加风场的经济效益。

图8 当入流速度为7 m·s-1时,不同偏航角下流场的速度梯度第二不变量等值曲面图
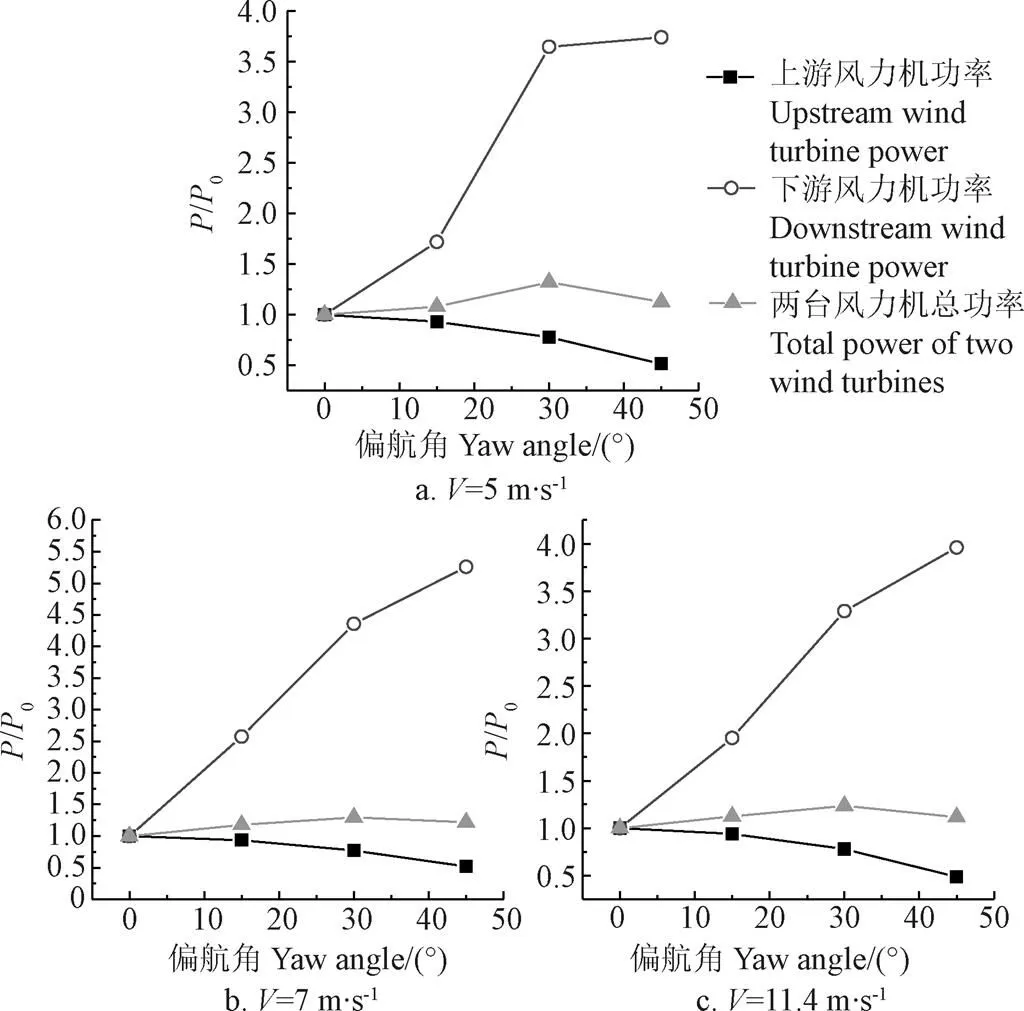
图9 不同入流速度下,风力机输出功率随偏航角的变化曲线
4 结 论
本文基于OpenFOAM开源软件,以NREL 5MW风力机作为研究对象,使用致动线和大涡模拟相结合的数值方法,研究了通过减小上游风力机尾流效应对下游风力机的影响,来增大两台风力机总功率输出的方法,得到了以下结论:
1)通过对致动线模型中的重要参数进行研究,发现对于NREL 5MW风力机,在风轮位置处,当风轮直径上有50个网格节点,高斯分布因子取1.6倍网格尺度时,计算误差最小,为1.1%;
2)在致动线方法中,尾流速度在风力机比较近的区域呈“W”型分布,随着尾流的发展,尾流速度呈“倒钟”型分布;风力机尾流速度分布与叶尖速比有关,叶尖速比比较大时,近尾流区的速度亏损大,尾流场的速度恢复比较快,叶尖速比比较小时,近尾流区的速度亏损小,尾流场的速度恢复比较慢。
3)当两台风力间距离为6倍风轮直径时,随着两台风力机轮毂高度差增大,下游风力机的功率输出增大,两台风力机的总功率输出增大,在入流条件为7 m/s的条件下,上游风力机轮毂高度分别比下游风力机轮毂高度高0.25、0.5和0.75倍的风轮直径时,相比于两台风力机轮毂高度相同,下游风力机功率分别增大了1.36、2.50、4.50倍,两台风力机总功率分别增大了20%、56%和66%;
4)当两台风力机间距离为6倍风轮直径时,随着上游风力机偏航角增大,上游风力机功率减小,下游风力机功率增大,两台风力机总功率先增大后减小。当入流速度为7 m/s,上游风力机偏航角为30°时,两台风力机输出功率最大。和上游风力机不偏航相比,总功率输出增加了30%。
致谢:甘肃省计算中心为本文提供了计算资源,在此表示衷心的感谢。
[1] Mladenović I, Marković D, Milovančević M, et al. Extreme learning approach with wavelet transform function for forecasting wind turbine wake effect to improve wind farm efficiency[J]. Advances in Engineering Software, 2016, 96: 91-95.
[2] 贾彦,刘璇,李华,等. 考虑尾流效应对风电场机组布局的影响分析[J]. 可再生能源,2014,32(4):429-435.
Jia Yan, Liu Xuan, Li Hua, et al. Analysis of wind farm units layout considering wake effect[J]. Renewable Energy Resources, 2014, 32(4): 429-435. (in Chinese with English abstract)
[3] Barthelmie R J, Frandsen S T, Rathmann O, et al. Flow and wakes in large wind farms in complex terrain and offshore[R]. Brussels: European Wind Energy Association, 2008.
[4] 邓英,李嘉楠,刘河生,等. 风电机组尾流与疲劳载荷关系分析[J]. 农业工程学报,2017,33(10):239-244.
Deng Ying, Li Jianan, Liu Hesheng, et al. Analysis on relationship between wake and fatigue load of wind turbines[J]. Transactions of the Chinese Society of Agricultural Engineering (Transactions of the CSAE), 2017, 33(10): 239-244. (in Chinese with English abstract)
[5] Adaramola M S, Krogstad P A. Experimental investigation of wake effects on wind turbine performance[J]. Renewable Energy, 2011, 36(8): 2078-2086.
[6] 胡丹梅,郑筱凯,张建平. 风力机不同排列方式下尾迹数值模拟[J]. 可再生能源,2015,33(5):684-692. Hu Danmei, Zheng Xiaokai, Zhang Jianping. Wake numerical simulation of wind turbine in different arrangement[J]. Renewable Energy Resources, 2015, 33(5): 684-692. (in Chinese with English abstract)
[7] 李少华,岳巍澎,匡青峰,等. 双机组风力机尾流互扰及阵列的数值模拟[J]. 中国电机工程学报,2011,31(5):101-107.
Li Shaohua, Yue Weipeng, Kuang Qingfeng, et al. Numerical simulation of wake interaction and array of double wind turbine[J]. Proceedings of the CSEE, 2011, 31(5): 101-107. (in Chinese with English abstract)
[8] 杨瑞,张志勇,王强,等. 串列风力机三维尾流场的实验研究[J]. 兰州理工大学学报,2017,43(5):60-64.
Yang Rui, Zhang Zhiyong, Wang Qiang, et al. Experimental study three-dimensional wake of tandem wind turbines[J]. Journal of Lanzhou University of Technology, 2017, 43(5): 60-64. (in Chinese with English abstract)
[9] 田琳琳,赵宁,钟伟,等. 基于小生境遗传算法的风电场布局优化[J]. 南京航空航天大学学报,2011,43(5):650-654.
Tian Linlin, Zhao Ning, Zhong Wei, et al. Placement optimization of wind farm based on niche genetic algorithm[J]. Journal of Nanjing University of Aeronautics& Astronautics, 2011, 43(5): 650-654. (in Chinese with English abstract)
[10] Song M X, Chen K, He Z Y, et al. Wake flow model of wind turbine using particle simulation[J]. Renewable Energy, 2012, 41(2): 185-190.
[11] Dupont B, Cagan J, Moriarty P. An advanced modeling system for optimization of wind farm layout and wind turbine sizing using a multi-level extended pattern search algorithm[J]. Energy, 2016, 106: 802-814.
[12] Fleming P A, Gebraad P M O, Sang L, et al. Evaluating techniques for redirecting turbine wakes using SOWFA[J]. Renewable Energy, 2014, 70(5): 211-218.
[13] Johnson K E, Fritsch G. Assessment of extremum seeking control for wind farm energy production[J]. Wind Engineering, 2012, 36(6): 701-716.
[14] Guntur S, Troldborg N, Gaunaa M. Proceedings of EWEA 2012 - European Wind Energy Conference & Exhibition [C]. Copenhagen: European Wind Energy Association (EWEA), 2012.
[15] 杨从新,张旭耀,李银然,等. 风剪切来流下风力机叶片表面压力的分布规律[J]. 太阳能学报,2018,39(4):1142-1148.
Yang Congxin, Zhang Xuyao, Li Yinran, et al. Distribution law of surface pressure of wind turbine blade under wind shear flow[J]. Acta Energiae Solaris Sinica, 2018, 39(4): 1142-1148. (in Chinese with English abstract)
[16] Zanchettin M G, Reginatto R. Grid integration limits for fixed-speed wind turbines with induction generators[J]. Journal of Control Automation & Electrical Systems, 2013, 24(6): 873-884.
[17] Vermeer L J, Sørensen J N, Crespo A. Wind turbine wake aerodynamics[J]. Progress in Aerospace Sciences, 2003, 39(6): 467-510.
[18] 张旭耀,杨从新,郜志腾,等. 水平轴风力机尾流的自相似性与流场特性研究[J]. 中国电机工程学报,2018,38(15):4482-4489,4649.
Zhang Xuyao, Yang Congxin, Gao Zhiteng, et al. Self-similarity and flow field characteristics of horizontal axis wind turbine wakes[J]. Proceedings of the CSEE, 2018, 38(15): 4482-4489, 4649. (in Chinese with English abstract)
[19] Nilsson K, Shen W Z, Sørensen J N, et al. Validation of the actuator line method using near wake measurements of the MEXICO rotor[J]. Wind Energy, 2015, 18(3): 499-514.
[20] 李鹏飞,万德成,刘建成. 基于致动线模型的风力机尾流场数值模拟[J]. 水动力学研究与进展A辑,2016,31(2):127-134. Li Pengfei, Wan Decheng, Liu Jiancheng. Numerical simulations of wake flows of wind turbine based on actuator line model[J]. Journal of Hydrodynamics, 2016, 31(2): 127-134. (in Chinese with English abstract)
[21] Zhong H, Du P, Tang F, et al. Lagrangian dynamic large-eddy simulation of wind turbine near wakes combined with an actuator line method[J]. Applied Energy, 2015, 144: 224-233.
[22] Jonkman J, Butterfield S, Musial W, et al. Definition of a 5-MW reference wind turbine for offshore system development[R]. Colorado: Office of Scientific & Technical Information Technical Reports, 2009.
[23] Matthew Churchfield, Sang Lee, Patrick Moriarty, et al. Overview of the simulator for wind farm application (SOWFA) [EB/OL]. [2012-05-21]. https://nwtc.nrel.gov/system/SOWFA
[24] Leonard A. Energy cascade in large-eddy simulations of turbulent fluid flows[C]//Turbulent Diffusion in Environmental Pollution. 1974, 1: 237-48.
[25] Zheng Z, Gao Z T, Li D S, et al. Interaction between the atmospheric boundary layer and a stand-alone wind turbine in Gansu-Part II: Numerical analysis[J]. Science China Physics Mechanics & Astronomy, 2018, 61(9): 94712.
[26] 东岳流体. CFD中的LES湍流模型[EB/OL]. [2018-8-30]. http://www.dyfluid.com/docs/LES.html
[27] Sorensen J N, Shen W Z. Numerical modeling of wind turbine wakes[J]. Journal of Fluids Engineering, 2002, 124: 393-99.
[28] 卞凤娇,徐宇,王强,等. 改进致动面模型的多风力机尾流研究[J]. 工程热物理学报,2015,36(6):1223-1227.
Bian Fengjiao, Xu Yu, Wang Qiang, et al. Wake study of multi wind turbines based on improved actuator surface model[J]. Journal of Engineering Thermophysics, 2015, 36(6): 1223-1227. (in Chinese with English abstract)
[29] 卞凤娇,徐宇,王强,等. 基于OpenFOAM的风力机致动线模型研究[J]. 工程热物理学报,2016,V37(1):72-75.
Bian Fengjiao, Xu Yu, Wang Qiang, et al. Numerical study of actuator line model of wind turbine based on OpenFOAM platform[J]. Journal of Engineering Thermophysics, 2016, 37(1): 72-75. (in Chinese with English abstract)
[30] 朱翀. 风力机尾流流场的数值模拟[D]. 南京:南京航空航天大学,2012.
Zhu Chong. Numerical Simulation of Wind Turbine Wake Flow Field[D]. Nanjing: Nanjing University of Aeronautics and Astronautics, 2012. (in Chinese with English abstract)
[31] Chow R, Dam C P V. Verification of computational simulations of the NREL 5 MW rotor with a focus on inboard flow separation[J]. Wind Energy, 2012, 15(8): 967-981.
[32] Pirrung G R, Madsen H A, Kim T, et al. A coupled near and far wake model for wind turbine aerodynamics[J]. Wind Energy, 2016, 19(11):2053-2069.
Influence of hub height difference or upstream wind turbine yaw angle on wind turbines total power output
Yang Congxin1,2, He Pan1, Zhang Xuyao1, Zhang Yaguang1, Jin Rui1
(1.730050; 2.730050)
In this paper, in order to obtain a method of increasing the power output of the downstream wind turbine by reducing the wake effect of the upstream wind turbine, NREL 5 MW wind turbines were used as research objects, and we coupled large-eddy simulation with an actuator line technique based on OpenFOAM open-source software as our numerical method. Firstly, the Gaussian width () in the actuator line model was studied at the rated wind speed, we found that the error of the calculation result was the smallest when there were 50 mesh nodes along the direction of rotor diameter andwas 1.6 times grid scale; Secondly, numerical simulations were carried out for a single wind turbine with tip-speed ratios () of 15, 10, 8 and 7, respectively (corresponding to inflow wind speeds was 3, 5, 7, 11.4 m/s). It was found that the wake velocity distribution was “W” type in the near-wake of the wind turbine, and with the development of the wake, the wake velocity distribution was “inverted bell” type in the far-wake of the wind turbine. The wake velocity distribution of wind turbine was related to. Whenwas larger, the velocity loss in the near-wake field was larger, and the velocity of the wake field recovers faster.was smaller, the velocity loss in the near wake region was small, and the velocity recovery in the wake field was relatively slow. Whenwas 15, 10, 8, and 7, respectively, the average speed loss at a position of 1 times rotor diameter () after the wind turbine was 45.7%, 42.4%, 38.8%, and 33.8%, respectively. When the wake developed to 18, compared to the 1position, the velocity recovered by 35.4%, 32.4%, 29.6% and 18.6% in order. Finally, through the numerical simulation of two wind turbines in tandem, two strategies by reducing the wake effect of upstream wind turbine to increase the output power of downstream wind turbine were studied. During the simulation, the distance between the two wind turbines was six times of the rotor diameter, and the inflow speeds was 5 m/s, 7 m/s and 11.4 m/s, respectively. It was found that when the hub heights of the two wind turbines were different or the upstream wind turbine had a yaw angle, the power output of the downstream wind turbine can be increased. Under the condition that the inflow velocity was 7 m/s , when the difference between the hub heights of the upstream and downstream wind turbines was 0.25, 0.5and 0.75, respectively, compared with the situation of 0,the power output of the downstream wind turbine increased by 1.36, 2.50, 4.50 times and the total power of the two wind turbines increased by 20%, 56% and 66%, respectively. When the yaw angles of the upstream wind turbines were 15°, 30° and 45°, respectively, compared with the situation of 0°, the power outputs of the downstream wind turbines increased by 1.58, 3.36, 4.26 times and the total rate of the two wind turbines increased by 18%, 30% and 22%, respectively. The above research results can provide reference for wind turbine selection in wind farms and increase wind farm power output by controlling operating conditions of upstream wind turbine.
wind turbine; numerical analysis; wake; the yaw angle; hub height difference; total output powers; actuator line; OpenFOAM
杨从新,何 攀,张旭耀,张亚光,金 锐.轮毂高度差或上游风力机偏航角对风力机总功率输出的影响[J]. 农业工程学报,2018,34(22):155-161. doi:10.11975/j.issn.1002-6819.2018.22.019 http://www.tcsae.org
Yang Congxin, He Pan, Zhang Xuyao, Zhang Yaguang, Jin Rui. Influence of hub height difference or upstream wind turbine yaw angle on wind turbines total power output[J]. Transactions of the Chinese Society of Agricultural Engineering (Transactions of the CSAE), 2018, 34(22): 155-161. (in Chinese with English abstract) doi:10.11975/j.issn.1002-6819.2018.22.019 http://www.tcsae.org
10.11975/j.issn.1002-6819.2018.22.019
TK83
A
1002-6819(2018)-22-0155-07
2018-07-29
2018-10-05
国家重点基础研究发展(973计划)(2014CB046201)
杨从新,教授,博士生导师,主要从事流体机械的设计与研究。Email:ycxwind@163.com

