
Effect of a Single Repeat Sequence of the Human Telomere d(TTAGGG)on Structure of Single-Stranded Telomeric DNA d[AGGG(TTAGGG)6]
2018-11-09 06:53:22TinleiGungYtingGoXiodongYeb
Tin-lei GungY-ting GoXio-dong Yeb
a.Hefei National Laboratory for Physical Sciences at the Microscale,Department of Chemical Physics,University of Science and Technology of China,Hefei 230026,China
b.CAS Key Laboratory of Soft Matter Chemistry,University of Science and Technology of China,Hefei 230026,China
Key words:Circular dichroism spectroscopy,G-guadruplex,Sedimentation velocity experiments
I.INTRODUCTION
Telomeres are the ends of eukaryotic chromosomes that protect chromosomal DNA from chromosomal fusion and degradation[1].Human telomeric DNA contains thousands of repeats of guanine-rich sequence d(TTAGGG)[2],with a 3′-end overhang of 100−200 nucleotides[3].The 3′-end overhang can fold into G-quadruplex through cyclic Hoogsteen hydrogen bonding andπ-πstacking interaction[4,5].For example,a fourrepeat human telomeric sequence G3-DNA forms an antiparallel basket-type structure with one diagonal and two lateral TTA loop in the presence of sodium ions[6].Similar DNA sequences adopt hybrid-type structures in the presence of potassium ions[7,8].A different intramolecular propeller-type parallel-stranded G-quadruplex with three external loops was observed in crystalline state in the presence of potassium ions revealed by Parkinsonet al.[9].The G-quadruplex structures have received much attention because they can be potential anticancer targets[10].
Until now,numerous studies have been carried out on short human telomeric sequences[11,12]and only a few studies have focused on the structures formed by longer human telomeric sequences[13−20],because it is difficult to study the structures of single stranded DNA with longer sequences by traditional NMR or crystallographic methods.Whereas,the structural information of the longer telomeric sequence is valuable for not only understanding of the interaction between DNA and telomerase and other telomeric proteins but also for designing the target drugs.For example,Vorlìˇcková and co-workers used circular dichroism spectroscopy and polyacrylamide gel electrophoresis to investigate the structure of long human telomeric sequence d[GGG(TTAGGG)n](n=1−16)at physiological concentrations of potassium cations.Numbers of topologies including intramolecular and intermolecular,antiparallel and parallel forms were observed and the thermal stabilities of the fragments decreased with an increasing repeat number of TTAGGG[13].Yu and coworkers stated that two series of long telomeric DNAs fromOxytrichaand human form bead-on-a-string G-quadruplex structures and individual quadruplex units do not interact with each other[14].Petraccone and co-workers obtained structural models for higher-order human telomeric DNA by a combination of the molecular dynamics simulation and fluorescence quenching experiments[15]. A further study from the same group proposed that the sequences containing 8 and 12 repeats of d(TTAGGG)forms higher-order structure with the maximum number of possible G-quadruplexunits and each G-quadruplex melted independently[18].Sannohe and co-workers studied end-extended and 8-bromoguanine substituted oligonucleotides and found that the ends of stable G-quadruplex structures point in opposite directions.In addition,their results proposed rod-like higher-ordered structures formed by human telomeric DNA sequences[19].On the other hand,Wanget al.and Katoet al.stated that a parallel G-quadruplexed DNA can be formed from a single repeat sequence of the human telomere d(TTAGGG)[11,12].However,less is known about the effect of this single repeat sequence of the human telomere on the structure of long single-stranded telomeric DNAs.In this study,the structure of a single-stranded telomeric DNA with a long sequence d[AGGG(TTAGGG)6](G6-DNA)was studied by sedimentation velocity technique,polyacrylamide gel electrophoresis,circular dichroism spectroscopy and UV melting experiments.Moreover,we also studied the effect of a single repeat of the human telomere d(TTAGGG)(G01-DNA)on the structure of G6-DNA.

TABLE I Oligodeoxynucleotides used in this study.
II.EXPERIMENTS
A.Materials and methods
The synthetic DNA oligonucleotides with different numbers of telomere repeats purified by high performance liquid chromatography(HPLC)were purchased from Sangon Biological Engineering Technology and Services(Shanghai,China)and stored at−20◦C.The sequences of used DNA oligonucleotides are shown in Table I.Each lyophilized oligonucleotide was dissolved in 100 mmol/L Tris-HCl buffer(pH=7.5)to form a DNA stock solution[21,22].Before each experiment,the oligonucleotide buffer solution was heated to 95◦C for 5 min,and then slowly cooled to room temperature.The sample was then placed in a 4◦C refrigerator for further use.The precise concentrations of the DNA stock solutions were determined by the absorbance at 260 nm with molar extinction coefficients(Table I)which were calculated from the nearest neighbor model for the unfolded forms[23]. Potassium chloride(KCl,99%),sodium chloride(NaCl,99%),tris(hydroxymethyl)aminomethane(Tris)(99%),and concentrated hydrochloric acid(37.5%)were purchased from Sinopharm Chemical Reagent Co.,Ltd.(Shanghai,China)without further purification.All aqueous solutions were prepared with ultrapure water with a resistivity of 18.2 MΩ·cm.
B.Polyacrylamide gel electrophoresis(PAGE)
Each PAGE experiment was performed on a nondenaturing 20%polyacrylamide gel(the ratio of acrylamide to bisacrylamide is 19:1)at 50 V and 4◦C.The electrophoresis was run in a 40 mmol/L Trisacetic acid buffer(pH=7.5)containing 100 mmol/L KCl.Poly(thymine)with different lengths was used as markers.Gels were stained with Gel-Red for 1 h and photographed by Tanon-1600 gel image system(Tanon,Shanghai,China).
C.CD spectroscopy
The CD spectra of DNA oligonucleotides were recorded using an Applied Photophysics Chirascan spectropolarimeter. A quartz cell of 3 mm optical length,response time of 0.25 s,and scanning speed of 100 nm/min was used for the CD spectroscopy experiments.Each spectrum was an average of three scans between 200−300 nm at 20◦C and was corrected by subtraction of the spectrum of buffer solution.
D.Thermodynamics analysis
UV melting curve of G-quadruplex structures was measured by a UV-2802 spectrophotometer(UNICO)at 295 nm.Before the thermodynamics analysis,samples containing 100 mmol/L Tris-HCl and 100 mmol/L KCl(pH=7.5)were heated to 95◦C for 5 min,gently cooled to 20◦C and then incubated at 4◦C for 3 days.UV spectra were measured at a 2◦C interval in the temperature range of 20−95◦C.The temperature at the midpoint of the transition was de fined as the melting temperature(Tm).
E.Analytical ultracentrifugation

FIG.1 Normalized sedimentation coefficient distributions of d[AGGG(TTAGGG)6](G6-DNA),where the concentrations of DNA were 1.0,3.0,and 5.0µmol/L,respectively.The experiments were measured in 100 mmol/L Tris-HCl buffer(pH=7.5)containing 100 mmol/L KCl at 20◦C.
Sedimentation velocity experiments were conducted using a ProteomeLab XL-A analytical ultracentrifuge(Beckman Coulter Instruments)at 20◦C and a rotor speed of 58000 r/min.Before each sedimentation velocity experiment,samples were kept to equilibrate for 2 h to ensure that the temperature and vacuum degree had been established.Each cell was exposed to a high centrifugal field,and then was scanned sequentially from the meniscus to the bottom until no further sedimentation was observed.The time dependence of the solute concentrationc(r,t)at different radial positions at a wavelength of 260 nm which is described by the Lamm equation was measured in each experiment[24].Data were analyzed by SEDFIT(version 14.1)usingc(s)model with a con fidence level of 0.95.The partial specific volume used for DNA oligonucleotides was 0.55 mL/g[25−27].The density and viscosity of each solution were calculated by the Sednterp software.The data ofc(s)distributions were exported to Origin software(Microcal Software,Northampton,MA)for plotting.
III.RESULTS AND DISCUSSION
The structure of human telomeric DNA in aqueous solutions can be studied by sedimentation velocity experiments[27−32].In these experiments,sedimentation coefficient distribution can be obtained by fitting the experimental data to the solutions of Lamm equation using SEDFIT program developed by Schuck[33,34].Here,we studied the structure of the DNA with a sequence of d[AGGG(TTAGGG)6](G6-DNA)and the effect of a single repeat of the human telomere DNA d(TTAGGG)(G01-DNA)on the structure of G6-DNA.
FIG.1 shows the normalized sedimentation coefficient distributions of DNA(G6-DNA)with a sequence of d[AGGG(TTAGGG)6]at three different concentrations. There are two species in the solutions with sedimentation coefficients of 2.5 and 3.5 S.The molar masses of these two species are 11000 and 20000 g/mol,indicating that G6-DNA can form dimers in the presence of potassium chloride[35].FIG.1 also shows that the amount of the dimers increases with the increase in G6-DNA concentration.The normalized sedimentation coefficient distributions of DNA at other concentrations are shown in FIG.S1 in supplementary materials.
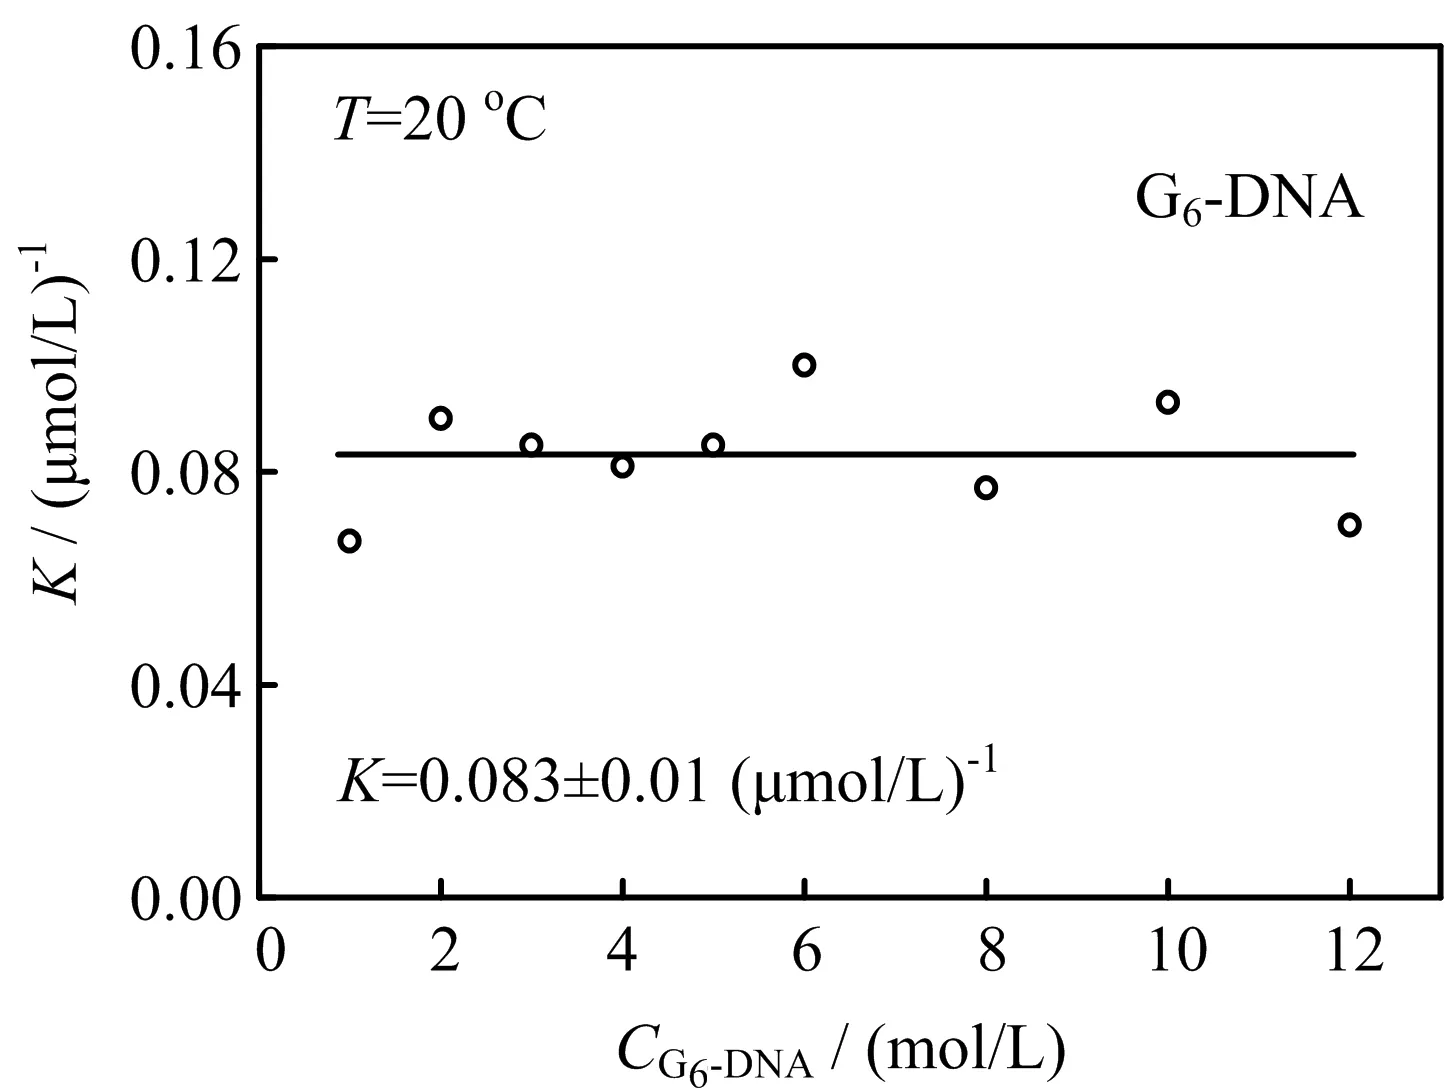
FIG.2 Theequilibrium constantmeasured bysedimentation velocity at different concentrations of d[AGGG(TTAGGG)6](G6-DNA)in 100 mmol/L Tris-HCl buffer(pH=7.5)containing 100 mmol/L KCl at 20◦C.
The amounts of monomers and dimers at different concentrations of G6-DNA and equilibrium constant can be obtained through the integrals of the two peaks in FIG.1.FIG.2 shows the equilibrium constants obtained using this method at 20◦C and reveals that the equilibrium constantKis nearly a constant and the value is 0.083±0.01(µmol/L)−1.
Thermodynamic properties such as melting temperature of G-quadruplex structures formed by G6-DNA can be obtained from absorbance change at 295 nm[36].FIG.3 shows the melting curves of G6-DNA with different concentrations of G01-DNA in 100 mmol/L Tris-HCl buffer(pH=7.5)containing 100 mmol/L KCl.The result shows that there are two transitions in the melting process,suggesting that at least two structures coexist in the solutions.The data can be well fitted by two sigmoidal curves with the two midpoints de fined as the melting temperatures(Tm,DandTm,M).Note that Yu and coworkers observed intramolecular and intermolecular G-quadruplex structures formed by long telomeric DNAs fromOxytrichausing UV-Vis spectrometer[14].They mentioned that the intramolecular structure is more stable than intermolecular structure.So the transitions in the temperature regions of 20−48◦C and 48−80◦C are related to the dimeric G-quadruplex structure and intramolecular structure,respectively.The melting temperatures(Tm,DandTm,M)with the addition of different concentrations of G01-DNA are summarized in Table II.Note that the melting temperature of the intramolecular structure is close to the value reported by Vorlìˇckováet al.[13].Moreover,the results show that the addition of G01-DNA has no obvious in fluence on the stability of both the intramolecular and intermolecular G-quadruplex structures.

TABLE II The melting temperature(Tm)values for 4.0µmol/L G6-DNA with different concentrations of G01-DNA.
FIG.4 shows the sedimentation coefficient distributions of G6-DNA with different concentrations of G01-DNA.The two peaks with the sedimentation coefficients of 2.5 and 3.5 S belong to the intramolecular and dimeric G-quadruplex structures,respectively,as discussed above.The small peak located at 0.75 S belongs to the free G01-DNA without forming complexes with G6-DNA.Moreover,the peak related to the dimers becomes smaller with the increase in the concentration of G01-DNA,indicating that the addition of G01-DNA affects the equilibrium between monomers and dimers of G6-DNA through the formation of additional quadruplex structure with G6-DNA.
FIG.5 shows the CD spectra of G6-DNA under the same condition.Previous work using CD spectroscopy shows that an antiparallel G-quadruplex structure has a positive peak around 295 nm and a negative peak around 265 nm,whereas the parallel G-quadruplex has positive and negative peaks around 260 and 240 nm,respectively[37].These peaks are attributed to the stacking of specific guanine in the folded G-quadruplex structure[38].The CD spectrum of G6-DNA has two positive peaks around 265 and 295 nm,a small negative peak at 240 nm,indicating a hybrid structure[16].The signals of the CD spectra increase with the addition of G01-DNA,revealing that G01-DNA can form additional G-quadruplex with G6-DNA[14].
We also carried out polyacrylamide gel electrophoresis(PAGE)in a buffer containing 100 mmol/L KCl and 100 mmol/L Tris-HCl(pH=7.5)at 4◦C and the results are shown in FIG.6.Poly(thymine)with three different lengths were used as markers(Line 1).The concentration of G6-DNA is 4.0µmol/L and the concentrations of G01-DNA are 2.0,4.0,and 6.0µmol/L,respectively.The results suggest that there are two bands for G6-DNA belonging to monomer and dimer structures of G6-DNA,which is consistent with the sed-imentation velocity experiments,as shown in FIG.4.In addition,the content of the monomer increases and the content of the dimer decreases with the addition of G01-DNA,further suggesting that G01-DNA can bind to the monomeric G6-DNA and change the equilibrium between monomers and dimers of G6-DNA.
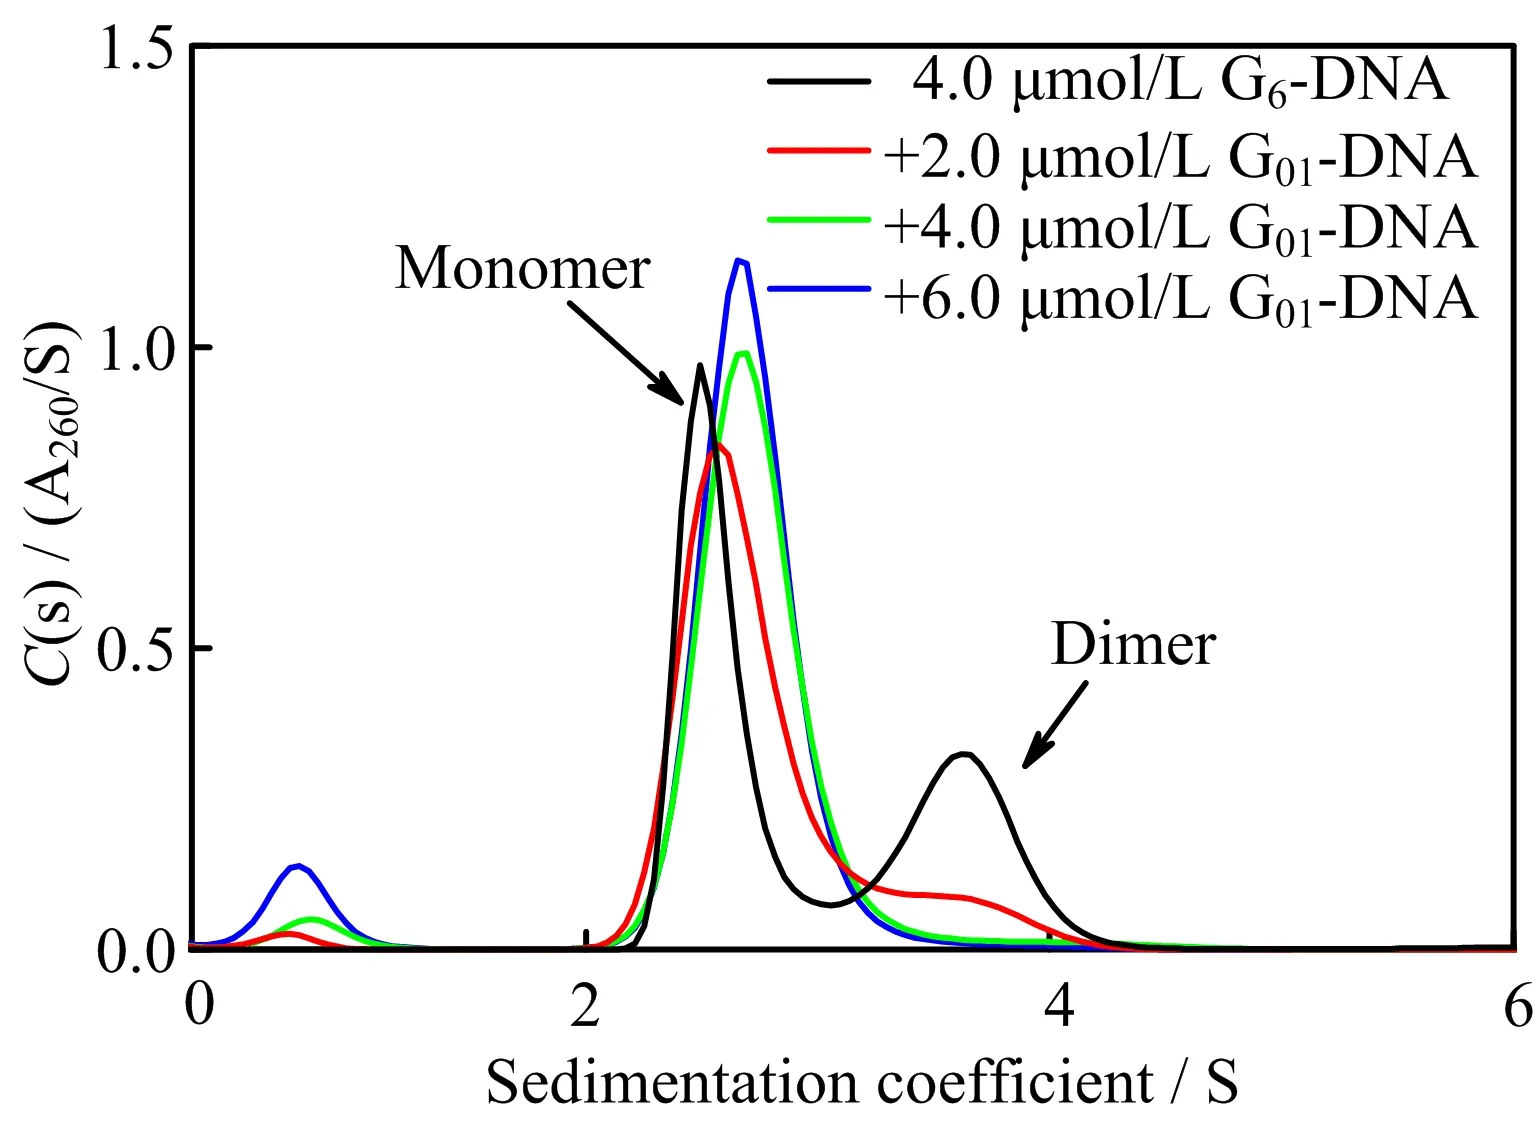
FIG.4 The sedimentation coefficient distributions of 4.0µmol/L G6-DNA with different concentrations of G01-DNA in 100 mmol/L Tris-HCl buffer containing 100 mmol/L KCl(pH=7.5)at 20◦C.
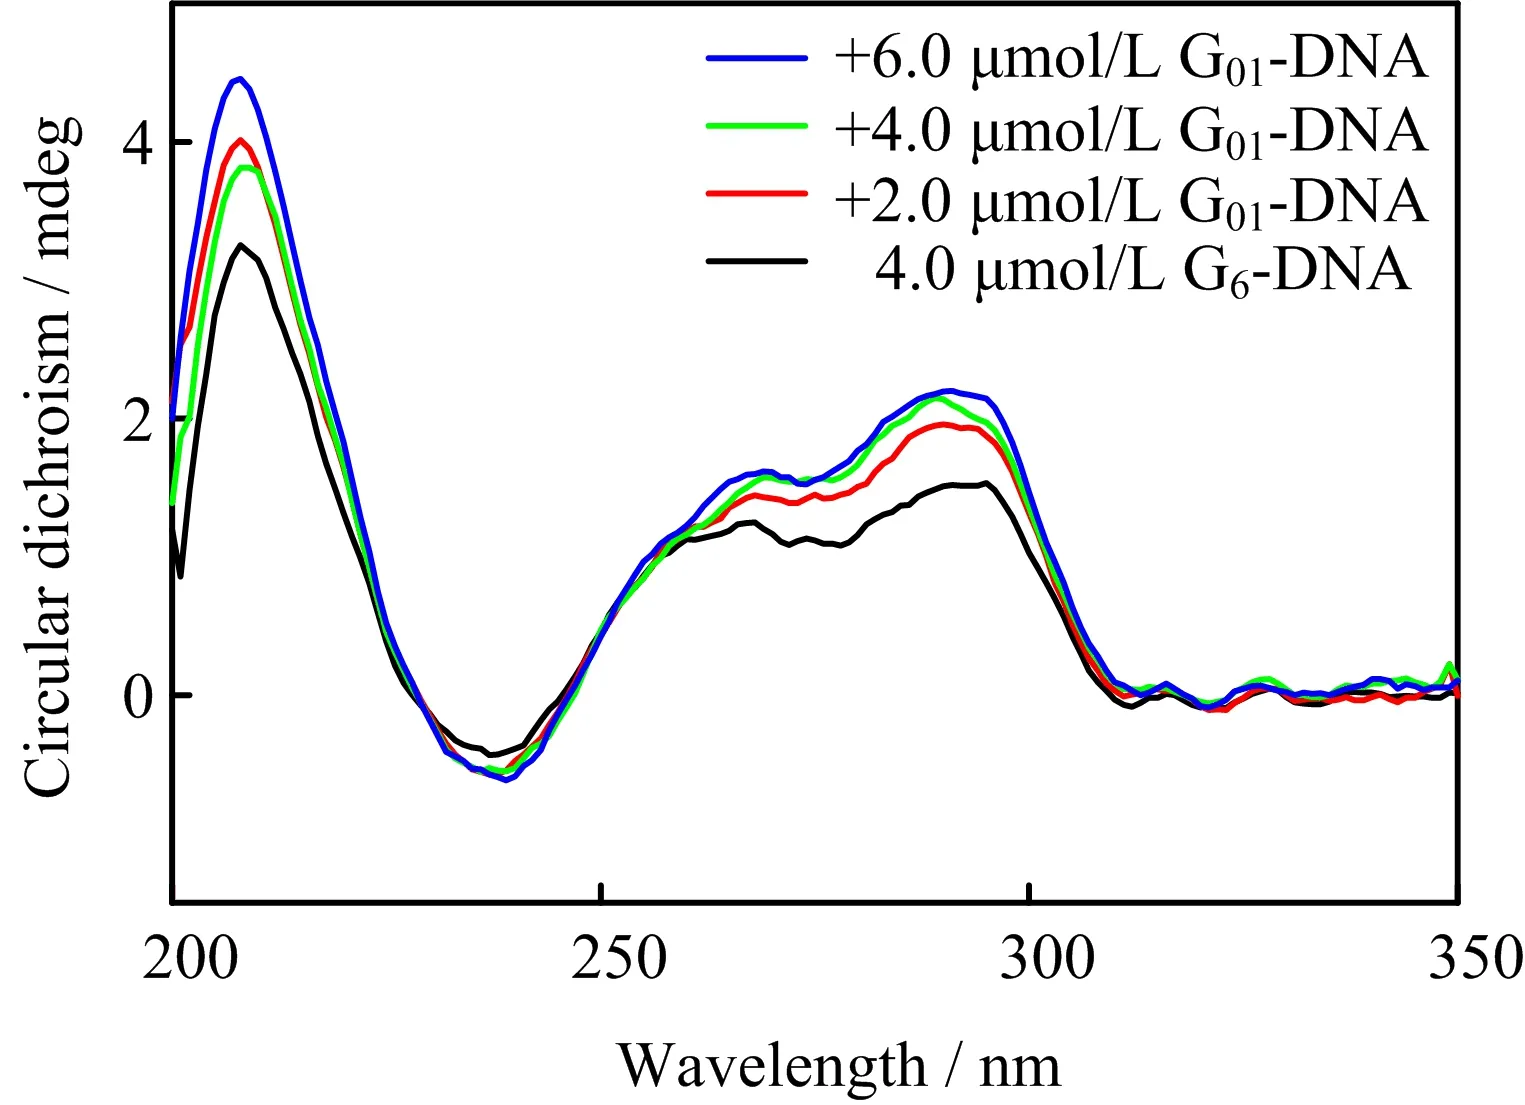
FIG.5 Circular dichroism spectra of 4.0µmol/L G6-DNA with different concentrations of G01-DNA in 100 mmol/L Tris-HCl buffer containing 100 mmol/L KCl(pH=7.5)at 20◦C.
FIG.7(a)shows the sedimentation coefficient distributions of d[AGGG(TTAGGG)3](G3-DNA)with different concentrations of G01-DNA in 100 mmol/L Tris-HCl buffer containing 100 mmol/L KCl(pH=7.5)at 20◦C.The small peak located around 0.72 S belongs to the excessive G01-DNA and the large peak around 1.92 S belongs to the G-quadruplex structure formed by G3-DNA in 100 mmol/L KCl(pH=7.5)at 20◦C.FIG.7(b)shows that CD spectra do not change with the addition of G01-DNA,indicating the addition of G01-DNA does not change the G-quadruplex structure of G3-DNA.FIG.8 shows the schematic diagram of the effect of G01-DNA on monomer-dimer equilibrium of G6-DNA.

FIG.6 Polyacrylamide gel electrophoresis(PAGE)of 4.0µmol/L G6-DNA with different concentrations of G01-DNA in the presence of 100 mmol/L KCl at 4◦C.
IV.CONCLUSION
In conclusion,we have investigated the effect of G01-DNA on the structure of single-stranded telomeric DNA sequence G6-DNA.The results show that G6-DNA can form an intramolecular and dimer G-quadruplex structures.The intramolecular structure is more stable than the dimer G-quadruplex structure.Moreover,the addition of short telomeric DNA sequence can affect the equilibrium between monomer-dimer of G6-DNA,i.e.this short telomeric sequence G01-DNA can bind to the G-quadruplex structure of G6-DNA and form an additional G-quadruplex structure.Furthermore,G01-DNA has no effect on the G-quadruplex structure of G3-DNA.We believe that this study is useful for understanding structure polymorphism of long single-stranded telomeric DNA and offering useful information for drug design.
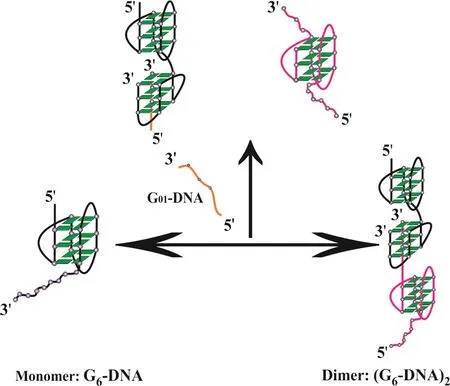
FIG.8 Schematic diagram of the effect of G01-DNA on monomer-dimer equilibrium of G6-DNA.
Supplementary materials:Normalized sedimentation coefficient distributions of d[AGGG(TTAGGG)6](G6-DNA)at different concentrations are shown in FIG.S1.
V.ACKNOWLEDGMENTS
This work was supported by the National Natural Scientific Foundation of China(No.21674107)and the Fundamental Research Funds for the Central Universities(No.WK2340000066).
[1]J.A.Hackett,D.M.Feldser,and C.W.Greider,Cell 106,275(2001).
[2]R.K.Moyzis,J.M.Buckingham,L.S.Cram,M.Dani,L.L.Deaven,M.D.Jones,J.Meyne,R.L.Ratli ff,and J.R.Wu,Proc.Natl.Acad.Sci.USA 85,6622(1988).[3]V.L.Makarov,Y.Hirose,and J.P.Langmore,Cell 88,657(1997).
[4]F.W.Smith and J.Feigon,Nature 356,164(1992).
[5]M.Gellert,M.N.Lipsett,and D.R.Davies,Proc.Natl.Acad.Sci.USA 48,2013(1962).
[6]Y.Wang and D.J.Patel,Structure 1,263(1993).
[7]J.X.Dai,M.Carver,C.Punchihewa,R.A.Jones,and D.Z.Yang,Nucleic Acids Res.35,4927(2007).
[8]J.X.Dai,C.Punchihewa,A.Ambrus,D.Chen,R.A.Jones,and D.Z.Yang,Nucleic Acids Res.35,2440(2007).
[9]G.N.Parkinson,M.P.H.Lee,and S.Neidle,Nature 417,876(2002).
[10]M.I.Zvereva,D.M.Shcherbakova,and O.A.Dontsova,Biochemistry 75,1563(2010).
[11]Y.Wang and D.J.Patel,Biochemistry 31,8112(1992).
[12]Y.Kato,T.Ohyama,H.Mita,and Y.Yamamoto,J.Am.Chem.Soc.127,9980(2005).
[13]M.Vorlìˇcková,J.Chladkova,I.Kejnovska,M.Fialova,and J.Kypr,Nucleic Acids Res.33,5851(2005).
[14]H.Q.Yu,D.Miyoshi,and N.Sugimoto,J.Am.Chem.Soc.128,15461(2006).
[15]L.Petraccone,J.O.Trent,and J.B.Chaires,J.Am.Chem.Soc.130,16530(2008).
[16]J.Dai,M.Carver,and D.Yang,Biochimie 90,1172(2008).
[17]Y.Xu,T.Ishizuka,K.Kurabayashi,and M.Komiyama,Angew.Chem.Int.Ed.48,7833(2009).
[18]L.Petraccone,C.Spink,J.O.Trent,N.C.Garbett,C.S.Mekmaysy,C.Giancola,and J.B.Chaires,J.Am.Chem.Soc.133,20951(2011).
[19]Y.Sannohe,K.Sato,A.Matsugami,K.Shinohara,T.Mashimo,M.Katahira,and H.Sugiyama,Bioorg.Med.Chem.17,1870(2009).
[20]H.Wang,G.J.Nora,H.Ghodke,and P.L.Opresko,J.Biol.Chem.286,7479(2011).
[21]R.F.Weaver and C.Weissmann,Nucleic Acids Res.7,1175(1979).
[22]T.M.Schmidt,E.F.Delong,and N.R.Pace,J.Bacteriol.173,4371(1991).
[23]J.F.Burd,R.M.Wartell,J.B.Dodgson,and R.D.Wells,J.Biol.Chem.250,5109(1975).
[24]H.Fujita,Foundations of Ultracentrifugal Analysis,New York:Wiley,377(1975).
[25]J.E.Hearst,J.Mol.Biol.4,415(1962).
[26]G.Cohen and H.Eisenberg,Biopolymers 6,1077(1968).
[27]L.M.Hellman,D.W.Rodgers,and M.G.Fried,Eur.Biophys.J.39,389(2010).
[28]R.Buscaglia,M.C.Miller,W.L.Dean,R.D.Gray,A.N.Lane,J.O.Trent,and J.B.Chaires,Nucleic Acids Res.41,7934(2013).
[29]J.Li,J.J.Correia,L.Wang,J.O.Trent,and J.B.Chaires,Nucleic Acids Res.33,4649(2005).
[30]J.B.Chaires,W.L.Dean,H.T.Le,and J.O.Trent,Method Enzymol.562,287(2015).
[31]Y.T.Gao,S.Wu,and X.D.Ye,Soft Matter 12,5959(2016).
[32]Y.T.Gao,T.L.Guang,and X.D.Ye,RSC Advances 7,55098(2017).
[33]P.Schuck,Biophys.J.78,1606(2000).
[34]J.Lebowitz,M.S.Lewis,and P.Schuck,Protein Sci.11,2067(2002).
[35]J.L.Cole,J.W.Lary,T.P.Moody,and T.M.Laue,Methods Cell Biol.84,143(2008).
[36]J.L.Mergny,A.T.Phan,and L.Lacroix,Febs Lett.435,74(1998).
[37]D.Miyoshi,S.Matsumura,S.Nakano,and N.Sugimoto,J.Am.Chem.Soc.126,165(2004).
[38]X.H.Cang,J.Sponer,and T.E.Cheatham,Nucleic Acids Res.39,4499(2011).
 CHINESE JOURNAL OF CHEMICAL PHYSICS2018年5期
- CHINESE JOURNAL OF CHEMICAL PHYSICS的其它文章
- A Simple,Compact and Rigid Scanning Tunneling Microscope
- Extraction of Lignin from Tobacco Stem using Ionic Liquid
- Gd Doped Hollow Nanoscale Coordination Polymers as Multimodal Imaging Agents and a Potential Drug Delivery Carriers
- 3D Macro-Micro-Mesoporous FeC2O4/Graphene Hydrogel Electrode for High-Performance 2.5 V Aqueous Asymmetric Supercapacitors
- Gamma Ray Radiation Effect on Bi2WO6Photocatalyst
- Ag-Cu Nanoparticles Supported on N-Doped TiO2Nanowire Arrays for Efficient Photocatalytic CO2Reduction