Carbon,nitrogen and phosphorus stoichiometry in Pinus tabulaeformis forest ecosystems in warm temperate Shanxi Province,north China
Ning Wang•Fengzhen Fu•Baitian Wang•Ruijun Wang
Abstract Although carbon(C),nitrogen(N),and phosphorous(P)stoichiometric ratios are considered good indicators of nutrient excess/limitation and thus of ecosystem health,few reports have discussed the trends and the reciprocal effects of C:N:P stoichiometry in plant–litter–soil systems.The present study analyzed C:N:P ratios in four age groups of Chinese pine,Pinus tabulaeformis Carr.,forests in Shanxi Province,China:plantation young forests(AY,<20 year-old);plantation middle-aged forests(AM,21–30 year-old);naturalyoung forests(NY,<30 year-old);and natural middle-aged forests(NM,31–50 year-old).The average C:N:P ratios calculated for tree,shrub,and herbaceous leaves,litter,and soil(0–100 cm)were generally higher in NY followed by NM,AM,and AY.C:N and C:P ratios were higher in litter than in leaves and soils,and reached higher values in the litter and leaves of young forests than in middle-aged forests;however,C:N and C:P ratios were higher in soils of middle-aged forests than in young forests.N:P ratios were higher in leaves than in litter and soils regardless of stand age;the consistent N:P<14 values found in all forests indicated N limitations.With plant leaves,C:P ratios were highest in trees,followed by herbs and shrubs,indicating a higher efficiency in tree leaf formation.C:N ratios decreased with increasing soil depth,whereas there was no trend for C:P and N:P ratios.C:N:P stoichiometry of forest foliage did not exhibit a consistent variation according to stand age.Research on the relationships between N:P,and P,N nutrient limits and the characteristics of vegetation nutrient adaptation need to be continued.
Keywords Pinus tabulaeformis Carr.·Forest ecosystem ·Content of carbon·Nitrogen and phosphorus·Ecological stoichiometry·Warm temperate zone·China
Introduction
Carbon(C),nitrogen(N),and phosphorous(P)cycles in ecological systems are one of the most discussed issues in studies considering global changes.These cycles are interconnected(Stevenson and Cole 1999;Sterner and Elser 2002;Elser et al.2003;Lal 2004;Zeng and Chen 2005;Yu et al.2010),and changes in N and/or P cycles strongly influence C(Chapin et al.2011).The supply of N and P under relatively stable ecological conditions controls C storage(Hessen et al.2004;Yu et al.2015).An absence or limitation of these two key nutrients results in a relative excess of C(higher C:N and C:P ratios),and their excess results in C deficiencies(Tessier and Raynal 2003;Güsewell 2004;Yu et al.2011).Therefore,C,N,and P stoichiometric ratios calculated for plants in a given ecological system might indicate N and P limitation status,which in turn can affect C accumulation(Zhang et al.2003;Elser et al.2007;He et al.2008;Wang and Yu 2008).
Since leaves are the main photosynthetic organ of plants,their N:P ratios are often used to indicate whether the limitation of either of these elements affects the system productivity.Such relationships vary according to changes in the external environment(Koerselman and Meuleman 1996;Aerts and Chapin 1999;Güsewell 2004;He et al.2008;Goddert et al.2010;Zhang et al.2014).Temperate forests at high latitudes are more prone to N limitations than tropical and subtropical forests at low latitudes,which are more likely to experience P limitations(Aerts and Chapin 1999;Wardle et al.2004;Yan et al.2010).Plants within the same area will also experience distinct nutrient limitations due to differences in their external environments and intrinsic properties(Aerts and Chapin 1999;Wardle et al.2004;Davidson et al.2007;Yu et al.2015).Vegetation productivity is controlled by N and P availability and their soil levels affect C:N and C:P ratios to some degree(Tessier and Raynal 2003;Güsewell 2004;Hogan et al.2010).Therefore,these ratios re flect plant productivity per unit of the nutrient supplied,and N:P ratios can indicate N and P availability patterns(Niva et al.2003;Wardle et al.2004;He et al.2008;A˚gren 2008).
Stoichiometric characteristics of C,N,and P have been evaluated at global and regional scales(Han et al.2005;Richardson et al.2008;He et al.2008;Yan et al.2010;Wang et al.2011).However,few reports have discussed their variation patterns and the reciprocal effects of C,N,and P ratios in plant–litter–soil systems of natural and plantations forests with stand age.This study analyzed the C,N,and P levels of leaves,litter,and soils in natural and artificial Pinus tabulaeformis Carr.(Chinese pine)forests in Shanxi Province,calculated C,N,and P stoichiometric ratios,and evaluated the changes in these ratios with stand age.
Materials and methods
Study sites
Shanxi Province is located east of the Loess Plateau and west of the Taihang Mountains(34°34′–40°3′N,110°14′–114°33′E),with a total area of 156,806 km2;elevations range from 1000 to 2000 m in most areas.It is classified as a semiarid continental region in a warm-temperate zone,as annual average temperature is 9.4°C,the frost-free season lasts 120–220 days,and annual average rainfall ranges from 400 to 650 mm.Winters are long,cold,and dry and summers hot and rainy.During spring,daily temperatures vary greatly in the north and central parts which are windy and dusty(sand particles),and are more stable in the south where winds and dust are not strong.Autumn is short and moderate in the north,and longer in the south.Forest coverage is approximately 18.0%and the main soil types are brown,cinnamon,and yellow loams.
Pinus tabulaeformis forests constitute the zonal vegetation in humid and sub-humid areas in warm temperate zones(Wu and Feng 1994).In Shanxi Province,natural P.tabulaeformis forests are located in state-owned regions covering Zhongtiao,Lvliang,Taiyue,and Taihang Mountains;plantations are located in several regions.Most(90%)P.tabulaeformis forests are middle-aged or young(Forest Resources Management Department 2003;Feng 2010)and cover 26.2%of the total forest area within the province.Corylus mandshurica Maxim.,Rosa xanthina Lindl.,Spiraea dasyantha Franch.,Lespedeza bicolor Turcz.,Lonicera maackii(Rupr.)Maxim.,and Abelia bi flora Turcz.,are the main shrubs in P.tabulaeformis forests;herbs mainly include Carex lancifolia C.B.Clarke,Thalictrum aquilegifolium Linn.,Sanguisorba officinalis L.,Dioscorea nipponica Makino.
We divided P.tabulaeformis forests into four types based on their age and origin:artificial young forests(plantations)(AY),artificial middle-aged forests(plantations)(AM),natural young forests(NY),and natural middle-aged forests(NM)(Forest Resources Management Department 2003).Field surveys,and plant and soil sampling were conducted in these forests in July 2011(Fig.1,Table 1).
Within each sampling site,leaves were collected from east,west,north,and south-facing sides of the crown of three trees using a lopper machine.To reduce the workload,leaves from the same tree were placed on a tray and 300 g of this mix was selected via quartering,transferred to a breathable tuck net and brought to the lab.Simultaneously,using the same methodology,leaves of dominant and auxiliary shrubs and herbs were collected,resulting in three leaf samples(trees,shrubs,and herbs)per site.Three quadrats(1×1 m)were set along the diagonal line of each site and the litter within each was collected and samples taken from the mix.Finally,soil samples up to 1 m depth(C layer)were taken within the quadrats with a soil auger(50 mm,diameter),and divided into five layers:0–10,10–20,20–30,30–50,and 50–100 cm.
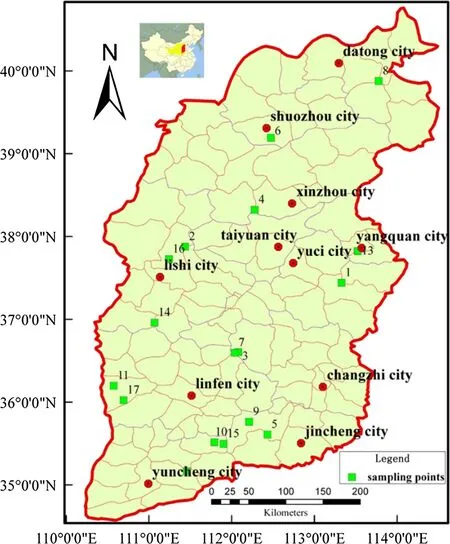
Fig.1 Location of field surveys,plant and soil sampling and study sites.These sites(Green Square)are distributed well across the forest regions of the study area(Red line area).Site 1 indicates Tieqiaoshan nature reserve,Site 2 indicates Pangquangou nature reserve,Site 3 indicates Lingkongshan nature reserve,Site 4 indicates Yunzhongshan nature reserve,Site 5 indicates Yanshan nature reserve,Site 6 indicates Zijinshan nature reserve,Site 7 indicates Qiliyu forest farm,Site 8 indicates Hualinbei forest farm,Site 9 indicates Beitan forest farm,Site 10 indicates Nanfan forest farm,Site 11 indicates Hongqi forest farm,Site 12 indicates Sijiao forest farm,Site 13 indicates Shinaoshan forest farm,Site 14 indicates Dongshan forest farm,Site 15 indicates Dahe forest farm,Site 16 indicates Fangshan county test site of the Beijing Forestry University,Site 17 indicates Ji county test site of the Beijing Forestry University
Plant and litter samples were oven-dried to constant weight at 75°C and powdered using a high-speed universal pulverizer(FW100,China);soil samples were ground after natural drying,passed through a 0.25-mm sieve and used in nutrient measurements.Carbon contents were determined for each sample using potassium dichromate-sulfuric acid digestion and ferrous sulfate titration,and the Kjeldahl method(KDY-9820,China)used to determine total nitrogen content.Plant total phosphorus levels were measured using the vanadium-molybdate yellow colorimetric method(UV-2550,Japan),and total phosphorus soil contents were measured by molybdenum-antimony colorimetric method (UV-2550,Japan)(State Forestry Administration 1999).C,N,and P levels in leaves,litter,and soil samples were mass-based.The atomic ratios,according to the formula atomic ratio=(mass ratio)/(atomic weight ratio of different chemical elements)were determined.
Data analysis
Paired t-tests compared differences in C,N,and P contents and C:N:P ratios.Tukey’s tests evaluated the differences in mean values among different levels.
C,N,and P stoichiometric relationships in leaves,litter,and soils were analyzed using Type II linear regressions;all data were log10transformed before regression analyses.Relationships were described by log y=a+b(log x),where x represented C and y represented N or P when evaluating the relationships between C and N or P contents.x corresponded to N and y to P when evaluating the relationships between N and P contents.a in the equation refers to the intercept and b to the slope;for b=1,the two variables were directly proportional,for b>1,the increase in y depended on the increase in x,and for b<1,the increase in y did notdepend on the increase in x(McGroddy et al.2004;Yan et al.2010).To evaluate the relationships among C,N,and P in leaves,litter,and soils,the four forest types were combined because of the low sample size of each group.Excel 2003 and SPSS 18.0 analyzed all the data.
Results
C,N,and P contents in leaves,litter,and soils
Nutrient contents increased with stand age(Table 2).Leaf C,N,and P levels were in the normal range of plant growth(Marschner 1995;Niinemets and Kull 1999).Tree leaves had significantly higher C contents than shrub and herbaceous leaves(p<0.05),and significantly lower N and P contents(p<0.05)in all stands.There were no significant differences between C,N,and P levels in tree leaves among the four groups(p>0.05).The highest values were found in AM;the lowest C in AY,whereas the lowest N and P levels were in NY.In shrub leaves,C contents were not significantly different(p>0.05)among forest types,N levels were not significantly different among AY,AM,and NM(p>0.05).P contents showed significant differences between AY and AM(p<0.05)but not between NY and NM(p>0.05).In herbaceous leaves,C,N,and P levels were significantly different among all forest types(p<0.05).

Table 1 Characterization of Pinus tabulaeformis forest types and their corresponding sampling sites
Litter C contents ranged from 430.8 to 473.6 g/kg;there were no significant differences among the forests(p>0.05,Table 2).N contents were significantly different between NY and NM(p<0.05)but not between AY and AM(p>0.05);P contents were significantly different among all groups(p<0.05).Natural forest litter had higher C and N contents and lower P levels than the litter from plantations.Regardless of the stand origin,litter in middle-aged forests had higher C,N,and P contents than in young forests,which relates to stand age,canopy density,and disturbance intensity(Fang et al.2003).
Soil C contents(0–100 cm)showed significant differences(p<0.05)among AY,AM,NY,and NM(Table 2),and were higher in NM(12.4 g/kg),followed by NY(6.8 g/kg),AM(4.4 g/kg),and AY(3.4 g/kg).N levels were significantly different between NY and NM(p<0.05)but not between AY and AM(p>0.05),whereas P contents were not significantly different among all groups(p>0.05)but showed significantly higher values in natural than in plantations(p<0.05).C,N,and P levels decreased with increasing soil depth(Fig.2a–c).The relationship between C content and soil depth was best described by an exponential function(p<0.001),whereas that between N and P contents and soil depth was best described by a quadratic function(p<0.001).
Stoichiometric ratios in leaves,litter,and soils
C:N ratios(Table 3)in tree leaves were not significantly different among the four forest types(p>0.05),having an average value of 35:1.No significant differences in the C:P ratios were found between the two plantations(average value=280:1),but a significantly higher value(p<0.05)was obtained in NY(458:1)compared to NM(362:1).The two plantations had identical N:P ratios(8:1)and there was no significant difference between the two natural forests(NY=12:1,NM=11:1).Considering shrub leaves,the two plantations presented no significant differences in C:N ratios(p>0.05),showing a 17:1 average value,whereas the ratio in NY(27:1)was significantly higher(p<0.05)than that in NM(15:1).The C:P ratios of the two natural forests were not significantly different (average value=225:1),but the value in AY(181:1)was significantly higher(p<0.05)than that in AM(132:1).The N:P ratios were higher in NM(15:1),followed by AY(11:1),NY(9:1),and AM(8:1).The C:N ratio of grass leaves was not significantly different among forests(p>0.05).The two artificial forests had similar C:P ratios(average value=206:1),whereas the value in NM(230:1)was significantly higher(p<0.05)than in NY(190:1).N:P ratios were not significantly different between the two plantations(average value=9:1),but the value in NM(11:1)was significantly higher(p<0.05)than in NY(8:1).
There were no significant differences for litter C:N ratios between different aged plantations (average value=47:1),whereas the value in NY(56:1)was significantly higher(p<0.05)than in NM(36:1).C:P ratios showed significant differences among the four forests,with values in AY (347:1)>AM (246:1) and NY(507:1)>NM(327:1).The N:P ratios in the two plantations were not significantly different (average value=9:1),but the value in NM(11:1)was significantly higher(p<0.05)than in NY(8:1).
C:N and N:P ratios showed no significant differences among the soil layers of the four groups(p>0.05),with average values of 5:1 and 6:1,respectively;the highest C:P ratio was found in AM(37:1),followed by NM(30:1),NY(28:1),and AY(23:1).C:N ratios decreased with increasing soil depth in all forest types but there were no clear trends for C:P and N:P ratios.
Stoichiometric relationships among C,N,and P in leaves,litter,and soils
Type II linear regression analysis found a significant relationship between N and P levels in tree leaves(R2=0.1215,p=0.032)(Fig.3),with the b~1 indicating that the process of leaf formation in trees is proportional to N and P inputs.
In shrub leaves,a significant linear relationship was found between N and C contents(R2=0.1355,p=0.041)(Fig.4a),as well as between N and P levels(R2=0.1687,p=0.017)(Fig.4b).
There was a significant linear relationship between N and C levels in forest litter(R2=0.2044,p=0.015)(Fig.5).
There was a significant linear relationship among C,N,and P levels in soils(Fig.6,p<0.05),with the slope values close to one in the relationship between N and P,reflecting the proportional reabsorption relation between these units in the soil.
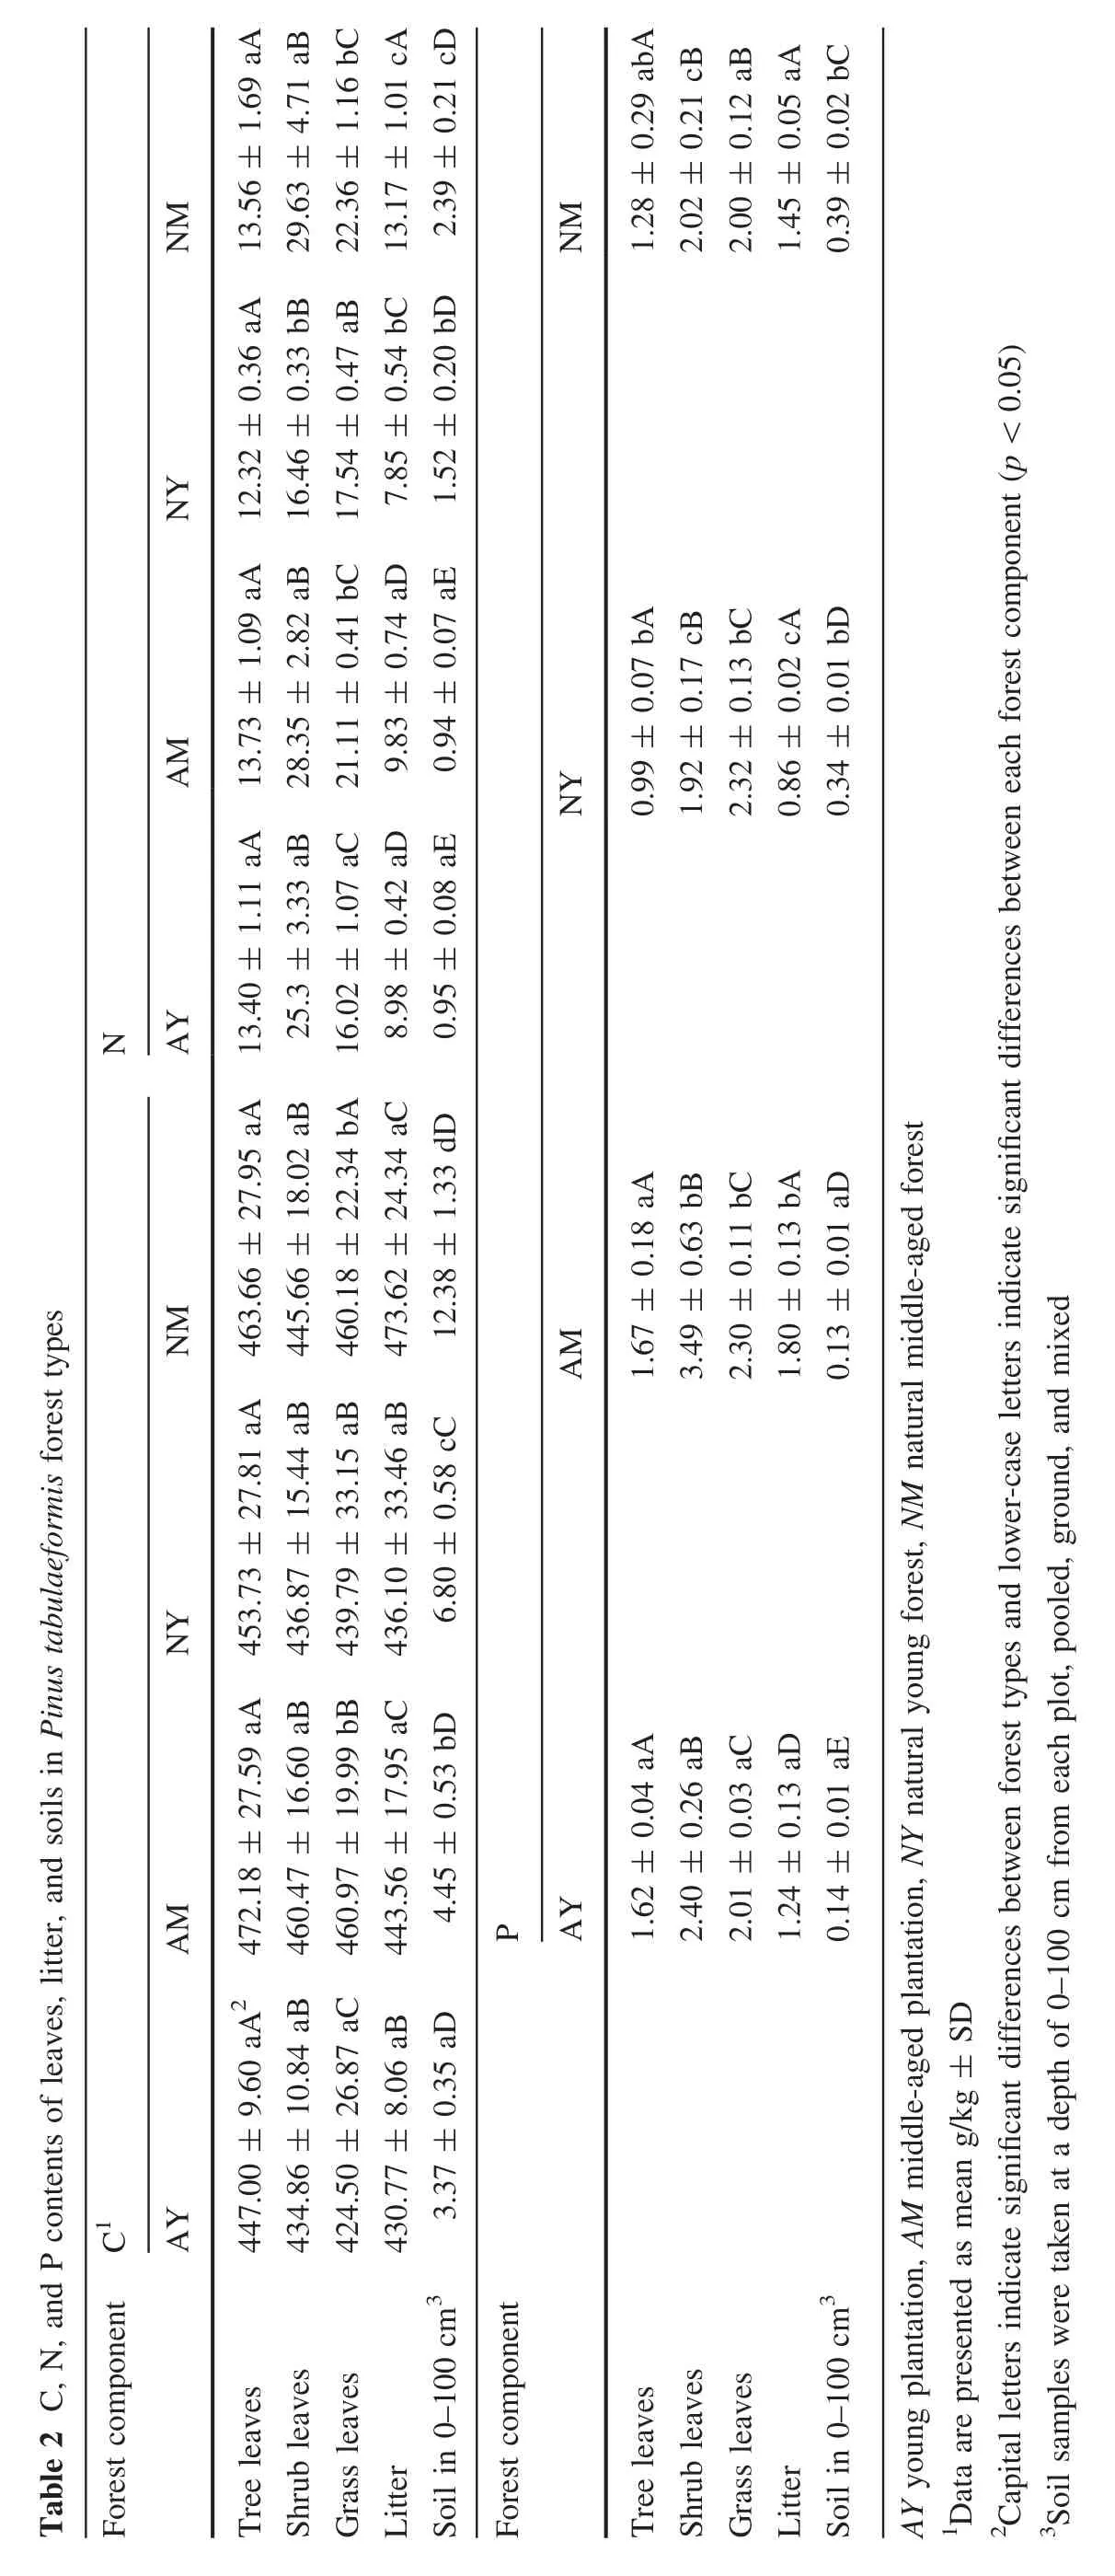
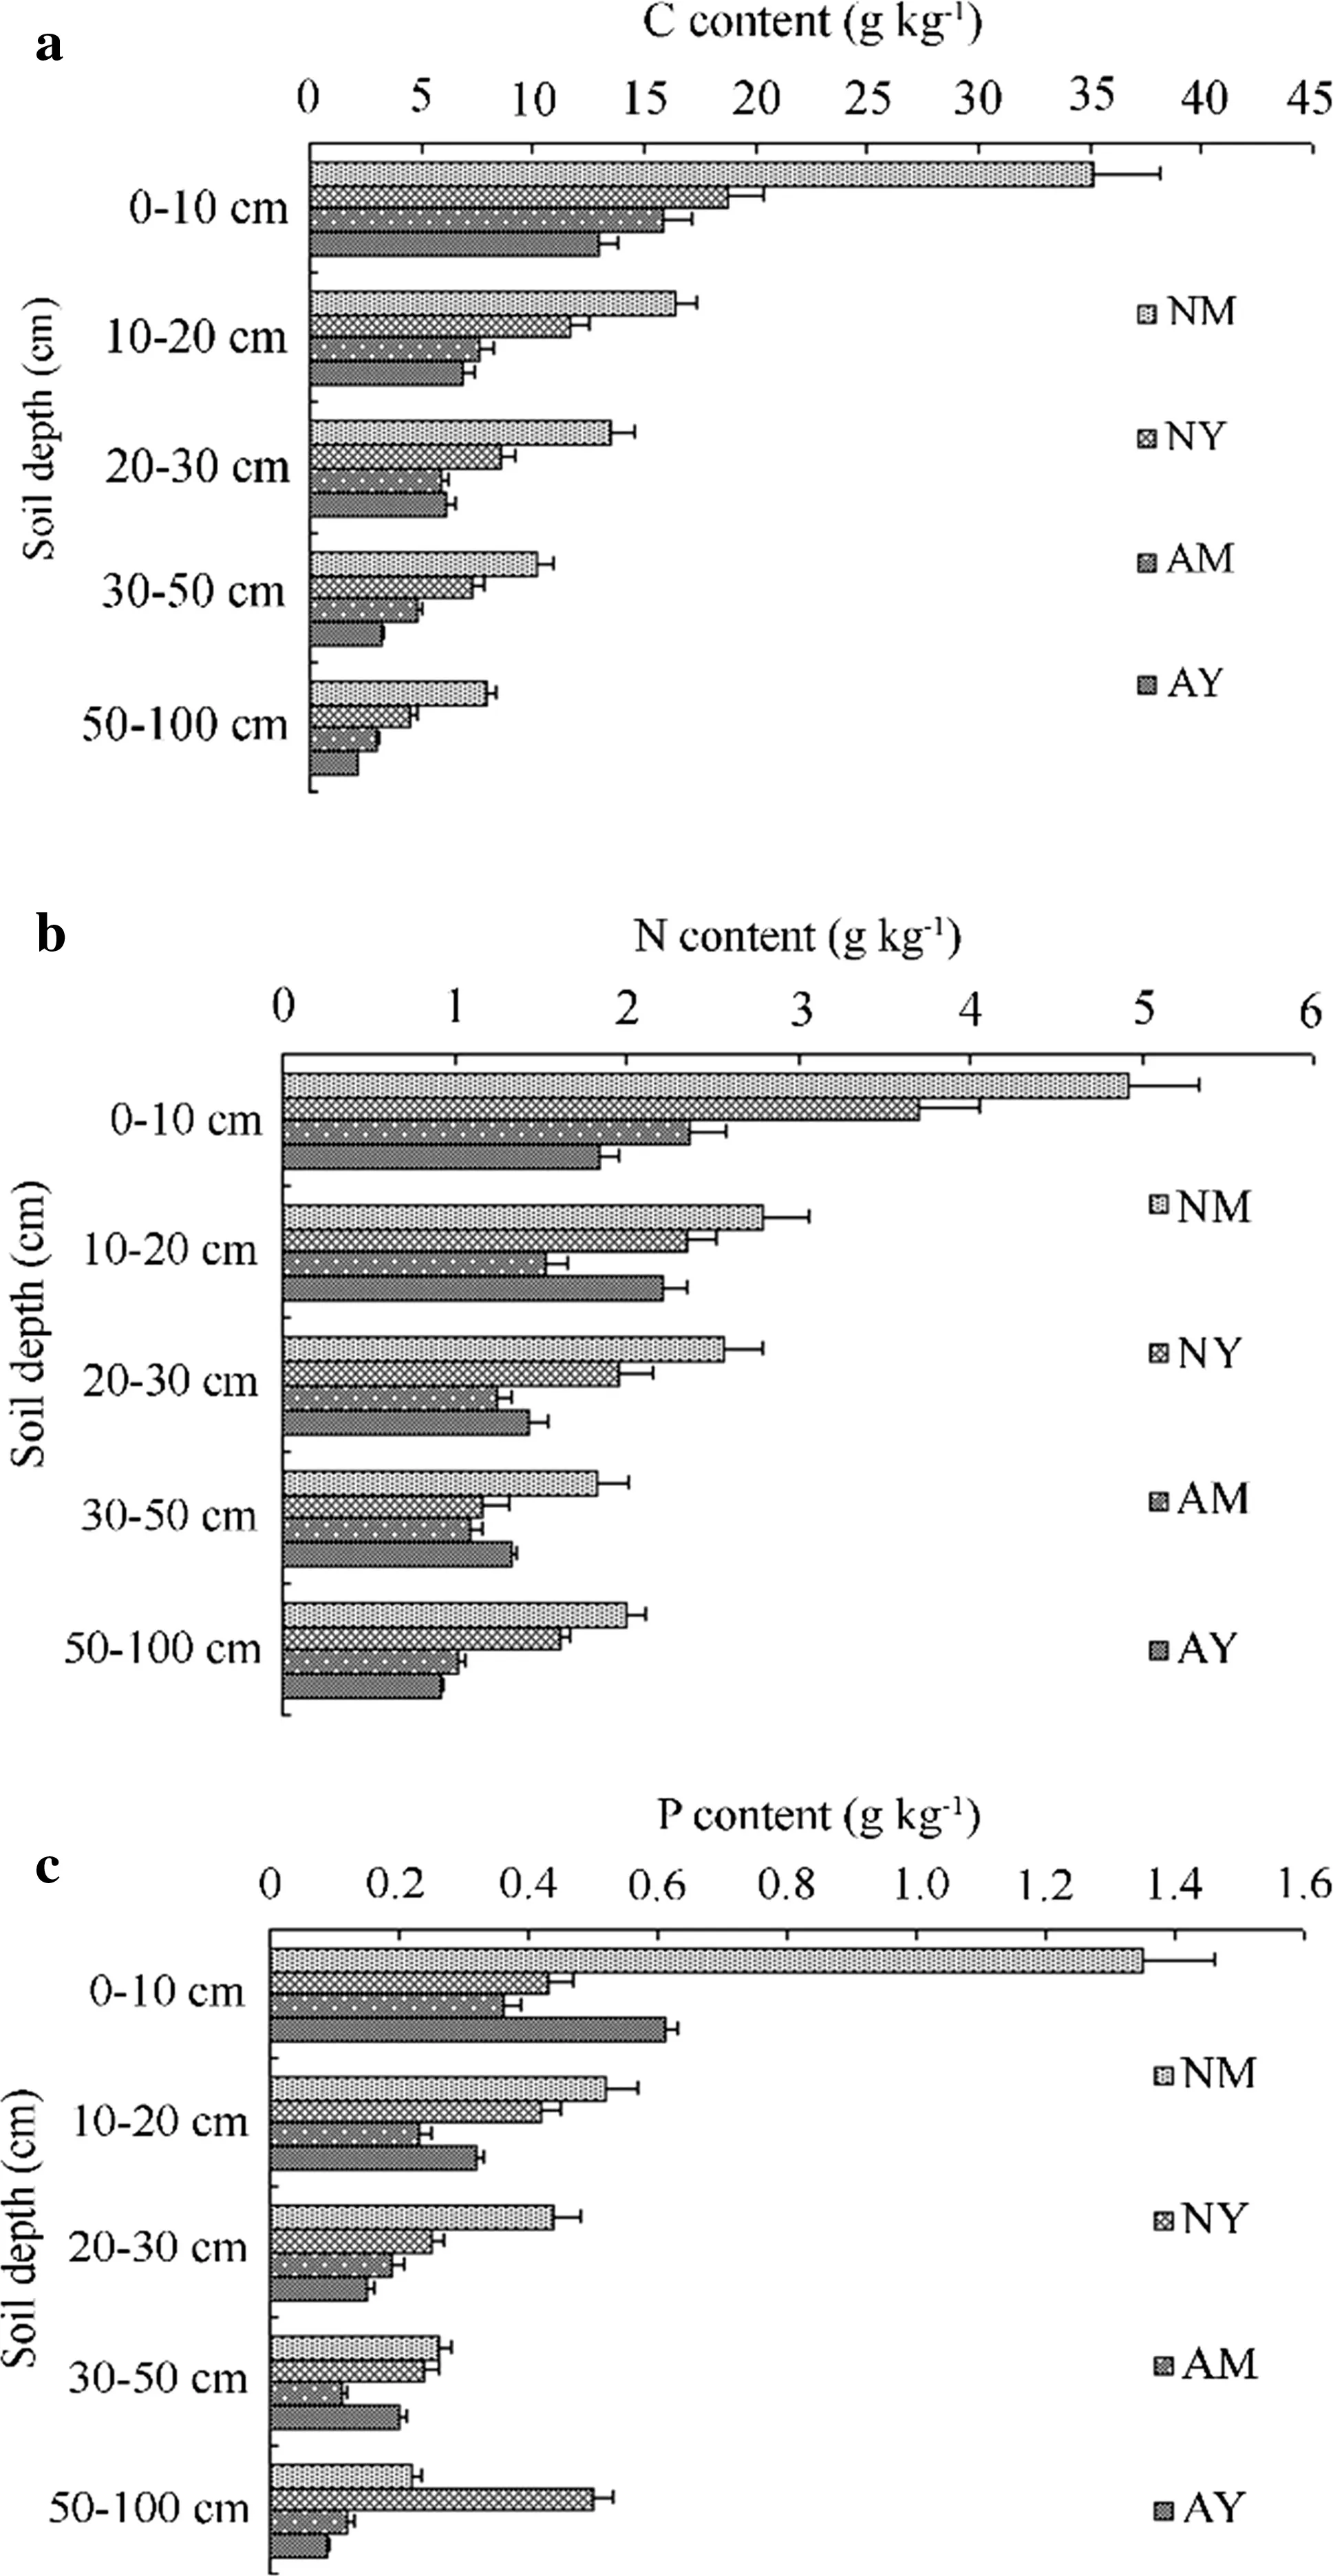
Fig.2 C,N,and P distribution in the soil layers of the four forest groups(AY young plantation,AM middle-aged plantation,NY natural young forest,NM natural middle-aged forest)
Discussion
The mass-based(atomic)C:N:P ratios obtained for AY,AM,NY,and NM tree leaves(Table 3)were lower than ratios that have been calculated for the foliage of global forests(1212:28:1)(McGroddy et al.2004)and for coniferous forests in subtropical China(1752:31:1)(Yan et al.2010).However,the average C:N:P ratios for AY,AM,NY,and NM foliage(853:21:1)were similar to that for mixed broadleaf-conifer forests in temperate China(829:29:1)(Wang et al.2011).C:N:P shrub leaf ratios in AY,AM,NY,and NM(Table 3)were lower than in thetemperate forests(752:33:1)(Han et al.2009)and coniferous forests of subtropical China(1656:33:1)(Yan et al.2010).Mass-based C:N:P ratios of grass leaves in AY,AM,NY,and NM(Table 3)were lower than the average for Chinese grasslands(270:15:1)but similar to grass leaves in China’s temperate forests (202:13:1) (He et al.2006,2008).The difference between C:N:P ratios for the foliage in P.tabulaeformis forests and those in studies in subtropical zones is mainly due to the different temperature zones in the research areas.Temperature and water availability are higher in subtropical than in temperate areas,plant leaves contain more carbon,and the efficiency of leaf formation is higher per unit of N and P supplied(McGroddy et al.2004;Wang and Yu 2008).
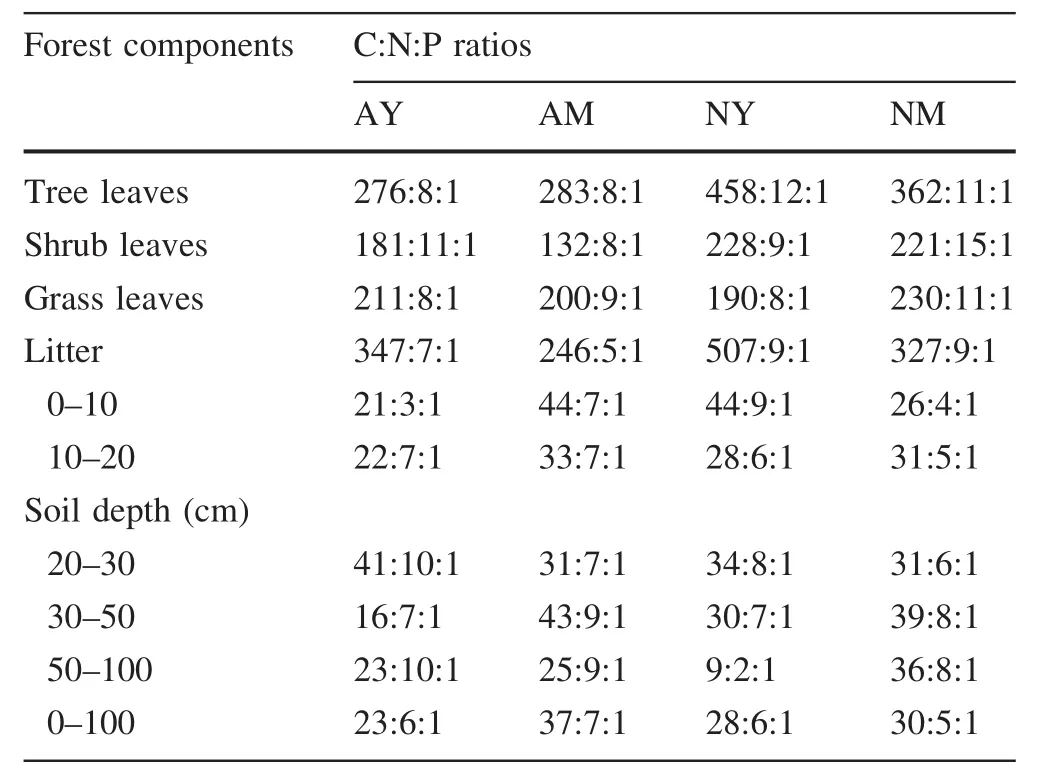
Table 3 C:N:P stoichiometric ratios of the components of Pinus tabulaeformis forests

Fig.3 Regression analysis plots for the relationships between N and P in P.tabulaeformis leaves
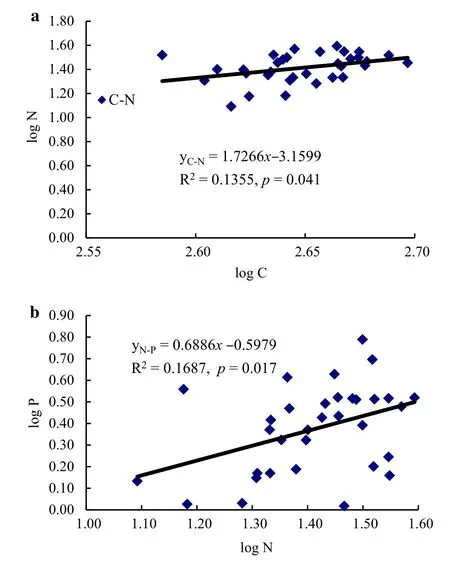
Fig.4 Regression analysis for the relationships between C,N,and P in shrub leaves
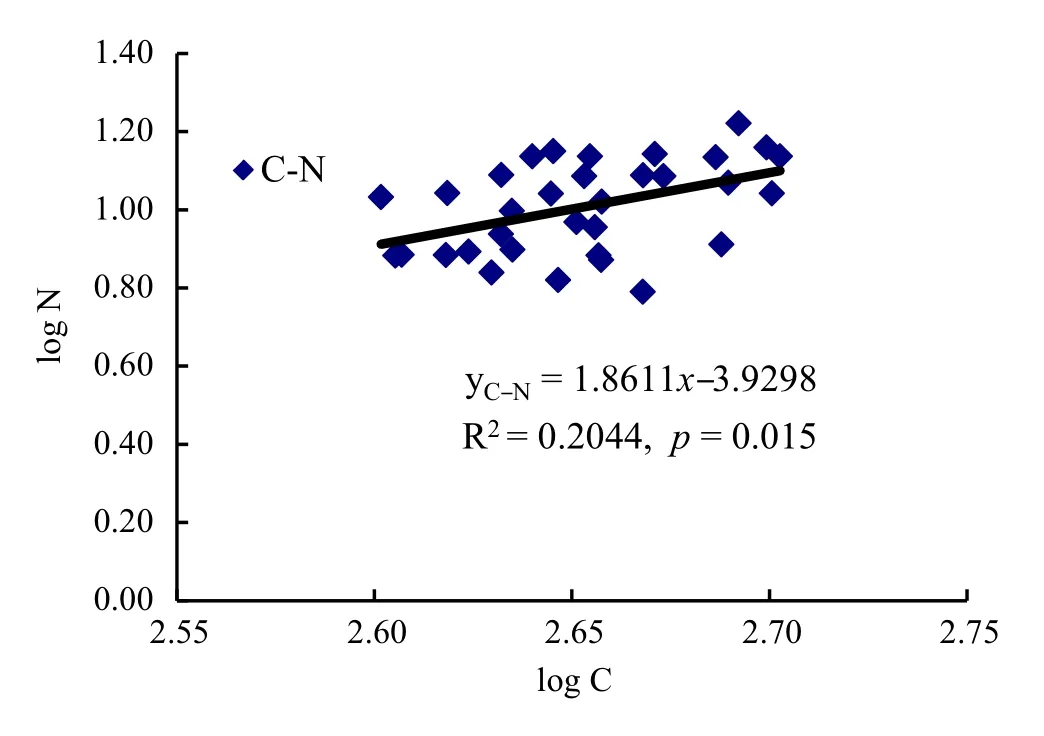
Fig.5 Regression analysis plots for the relationships between C and N in forest litter
Leaf N:P ratios can be used as an index to diagnose nitrogen saturation and as a threshold to determine nutrient limits(Güsewell et al.2003;Elser et al.2007).According to Tessier and Raynal(2003),leaf N:P values<14 indicate N limitation,whereas values>16 indicate P limits.The N:P values for plant leaves in the four P.tabulaeformis forests were<14 suggesting N limitation.These results also support Chapin and Moilanen(1991)and Aerts and Chapin(1999)suggestion that plants in low latitudes would be more prone to P limitation,whereas plants in high latitudes would more likely experience N limitation,as the four P.tabulaeformis forests were located in high latitudes.C:N and C:P,being important physiological indices,can also reflect the growth rate of plants(A˚gren 2004;Frost et al.2005).In the four forest types,C:P ratios were higher in tree leaves,followed by herbaceous and shrub leaves,indicating that leaf construction efficiency is higher in trees than in herbs and shrubs.
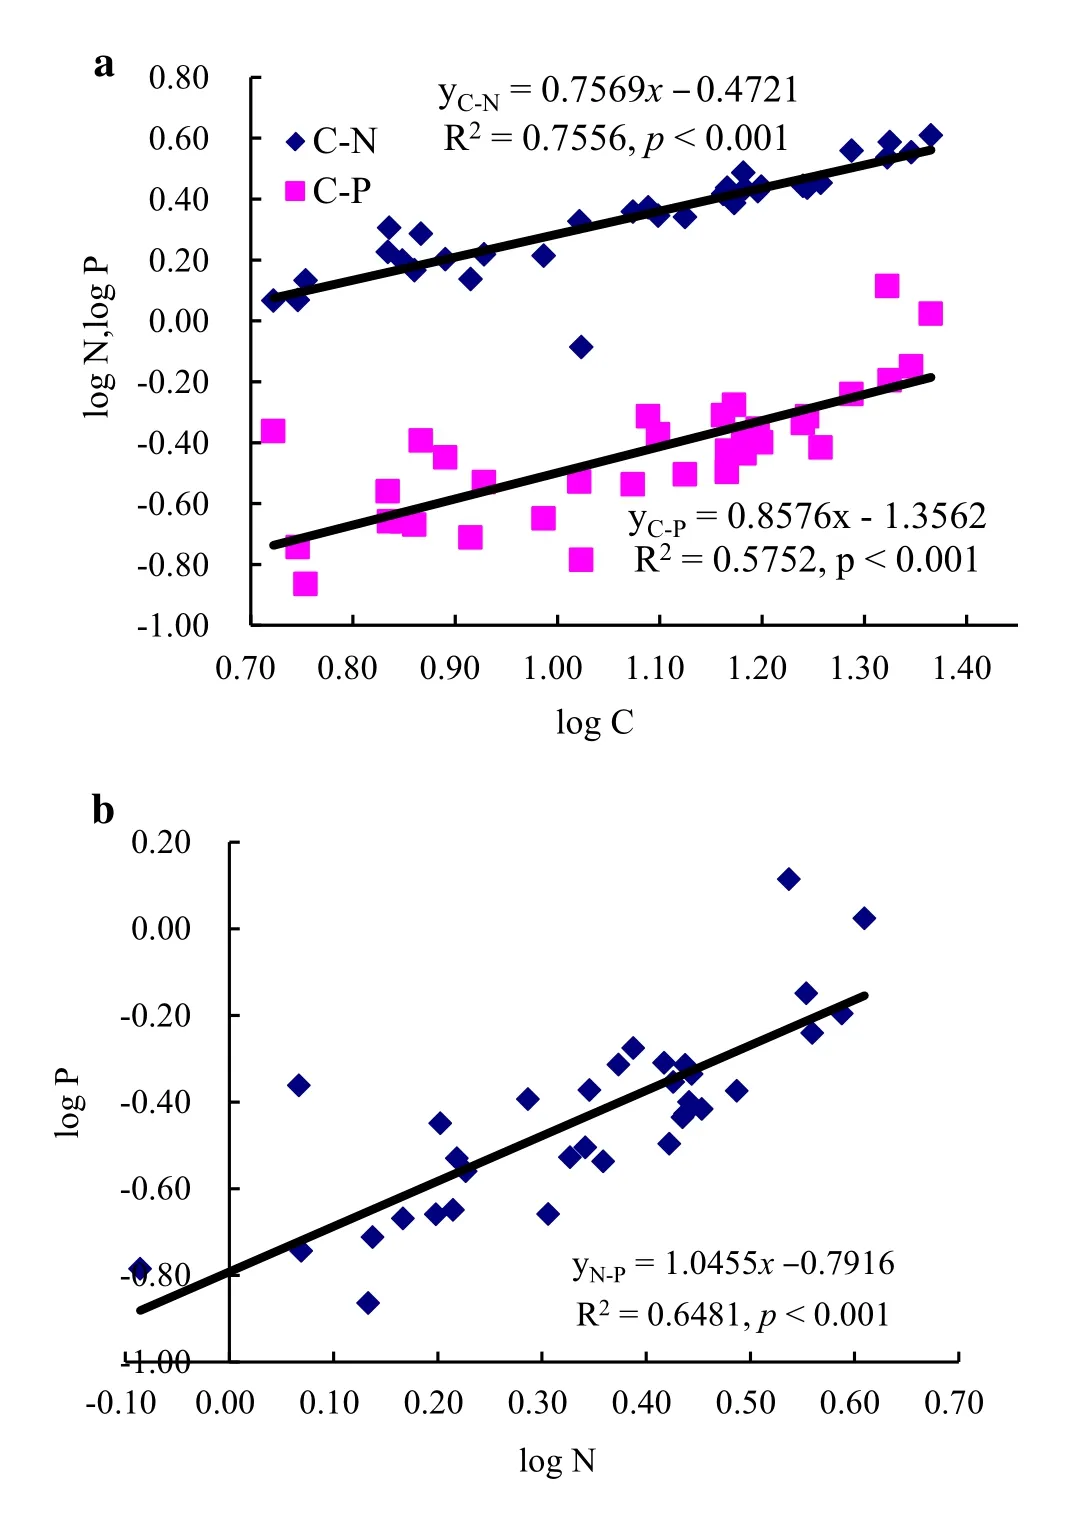
Fig.6 Regression analysis plots for the relationships between C,N,and P in forest soils
Litter C:N:P atomic ratios in AY,AM,NY,and NM(Table 3)were lower than the ratios calculated for global forest litter(3007:45:1)(McGroddy et al.2004),subtropical Chinese coniferous forests litter(1886:53:1)(Yan et al.2010),and temperate Chinese mixed broad leaf-conifer forests litter(1426:31:1)(Wang et al.2011).While litter C:N ratios do not differ appreciably,C:P and N:P ratios are substantially lower than global(3144.1:1,45.5:1),tropical(4116.0:1,62.7:1)and temperate ratios(2352.9:1,26.0:1)(McGroddy et al.2004).These differences might relate to forest origin,stand age,litter decomposing rates,human activities,temperature,and water conditions(Fang et al.2003).
Soil(0–100 cm)C:N:P ratios in AY,AM,NY,and NM(Table 3)were lower than those obtained in Iowa,US(78:7:1),Brazil(161:8:1),Scotland(87:8:1),New Zealand(59:4:1),and India(76:5:1)(Stevenson and Cole 1999).These differences result from soil C:N:P being mainly controlled by regional hydrothermal conditions and soil formation characteristics,with changes in C,N,and P totals leading to a large spatial variability of C:N:P(Batjes 1996).Soil C:N ratios in China’s moist and temperate zones were 10:1 and 12:1,respectively,while that in red and yellow soils of tropical and subtropical zones reached 20:1(Huang 2000).These ratios were higher than the soil C:N ratios obtained in this study(4:1–6:1),which is possibly due to the organic matter present in the high-density soils analyzed here(De Camargo et al.1999).In addition,soil C:N decreased with increasing depth in the four forest types,groups,reflecting soil age and humus deposition at the deepest soil levels(Batjes 1996).
Plant at high latitudes are limited by N availability while those in low latitudes are limited by P.However,results show that plants limited by N or P do not have higher N or P resorption(Yan et al.2010).The interaction between soil nutrient levels and plant characteristics is dif ficult to distinguish,and therefore research on the relationship between N:P ratios,N and P nutrient limitations and characteristics of vegetation nutrient adaptation is needed.
Conclusions
There were significant differences in the C:N:P ratios of tree leaves between two natural Pinus tabulaeformis forests of different ages(p<0.05),but not between the two different aged artificial forests(plantations)(p>0.05).Thus,C:N:P stoichiometry in tree leaves did not exhibit consistent variation according to age.C:N and C:P ratios were higher in litter than in leaves and soils,and generally higher in young forests than in middle-aged forests;however,these ratios were higher in soils of middle-aged forests than in younger forests.N:P ratios were higher in leaves than in litter and soil,but there was no trend in relation to age.Nevertheless,N:P ratios in the four forest types were lower than 14,suggesting N limitation.
AcknowledgementsThe authors thank engineer Gao Haiping from the Forestry Bureau in Fangshan County,Shanxi Province,teacher Qu Hong from the Biological College of Beijing Forestry University,and the students Peng Xiaofei,Cao Xiaoyang,Wang Wenjing,Yan Nan,and Shu Xin from the Soil and Water Conservation College for their help during sampling.
 Journal of Forestry Research2018年6期
- Journal of Forestry Research的其它文章
- Black locust(Robinia pseudoacacia L.)as a multi-purpose tree species in Hungary and Romania:a review
- The impact of the environmental factors on the photosynthetic activity of common pine(Pinus sylvestris)in spring and in autumn in the region of Eastern Siberia
- Osmoregulators in Hymenaea courbaril and Hymenaea stigonocarpa under water stress and rehydration
- Effect of nitrogen levels on photosynthetic parameters,morphological and chemical characters of saplings and trees in a temperate forest
- Free amino acid content in trunk,branches and branchlets of Araucaria angustifolia(Araucariaceae)
- Exogenous application of succinic acid enhances tolerance of Larix olgensis seedling to lead stress
