Osmoregulators in Hymenaea courbaril and Hymenaea stigonocarpa under water stress and rehydration
Luma Castro de Souza •Luana Moraes da Luz •Jéssica Taynara da Silva Martins •Cândido Ferreira de Oliveira Neto •Juscelino Gonc¸alves Palheta •Tamires Borges de Oliveira •Ediane Conceic¸ão Alves •Risely Ferraz de Almeida •Raimundo Leonardo Lima de Oliveira•Roberto Cezar Lobo da Costa•Nariane Quaresma Vilhena
Abstract The objective of this work was to evaluate the effect of different water deficiency and rehydration levels on the concentrations of osmoregulators in two plant species(Hymenaea courbaril and H.Stigonocarpa)in the Amazon.We adopted a 2×5×5 factorial system,referring to 2 species(H.courbaril and H.stigonocarpa)and 5 stages of hydration and rehydration.The five hydration and rehydration stages were established in:(1)Control treatment E0;(2)Plants with 13 days of stress after incubation—E13;(3)Plants with 26 days of stress E26;(4)The plants that were established after 26 days after incubation and rehydrated for two days(RD2);(5)rehydrated for two days(RD4).The plants that were established after 26 days after incubation and rehydrated for four days.The experiment totaled fifty young plants with five replicates.Biochemical measurements were performed at the beginning of the experiment(E0)at 13(E13)and 26(E26)days after the water stress,in which the plants were rehydrated,repeating the analyses after two(RD2)and four(RD4)days.Both species increased the sucrose concentration by 18%,with a decrease of 52%in starch content.The RD4 time presented the highest mean starch concentration(0.19 mmol g-1of the residue for H.courbaril and 0.27 mmol g-1of residue for H.stigonocarpa).Increased proline concentrations were recorded for controls until RD2 for both species.For glycine betaine,the highest increases in treatments E26 and RD2 were observed for the H.courbaril species.Our rehydration period was not sufficient for total recovery of pre-stress concentrations of all studied solutes.
Keywords Amazonia·Water stress·Osmotic adjustment·Proline ·Sucrose
Introduction
Environmental stresses affect plant growth and can cause decreased performance of crops(Carlin and Santos 2009).Water deficiency is one of the major limitations affecting world agriculture,due to its negative effects on plant growth and development.Water stress,caused by heat and thermal shock,as well as salinity and oxygen deficiency are the major stressors that restrict plant growth(Batista et al.2008;Lopes et al.2011).Thus,one of the great challenges of agriculture is to increase crop productivity in environments with deficient water supply(Carlin and Santos 2009).Studies of the biochemical behavior of plants in these environments are needed to identify plants that are tolerant to these abiotic stress.
In the Brazilian Amazon the genus Hymenaea L.has been gaining importance for several researchers for presenting adaptation in inappropriate areas,such as water deficiency.It is considered a great relevance in forestry and economic aspects(Nascimento et al.2011).Hymenaea courbaril L.is a promising species for reforestation and recovery programs in degraded areas.It has a wide geographical distribution and survives in environments with diverse climatic and soil characteristics(Paiva and Vital 2003).
Nascimento et al.(2011)reported that water deficit affects dry matter production in H.courbaril.Pimentel(1999)reported that water stress leads to increase in concentrations of soluble carbohydrates.Increase in soluble carbohydrate concentrations contributes to regulation of photosynthetic and respiratory processes(Pimentel 2004).Santos Filho et al.(2010)verified increase in the carbohydrate content of roots of the H.courbaril subjected to water deficit.
Hymenaea stigonocarpa can survive in abandoned pasture and being recommended for recovery of degraded areas(Barbosa and Martins 2003)in water deficiency conditions.
The plants in water deficiency conditions trigger the greater energy demand to the production due to the problems in the plant physiology(Larcher 2006),such as:Sucrose,starch,proline and Glycine betaine content.Thus,the search for cultivars tolerant to environmental stress has increased interest in physiological and biochemical mechanisms that can indicate response to various environmental conditions(Kavi Kishor et al.2005),since these tolerance mechanisms in plants are not yet fully explained(Grennan 2006).
We tested the hypothesis that concentrations of osmoregulators in H.courbaril and H.stigonocarpa are influenced by levels of water deficiency and rehydration.
Materials and methods
Location and experiment performance
The experiment was conducted in a greenhouseat Universidade Federal da Amazônia in Brazil,between May and September 2013.To assess the concentrations of osmoregulators in plants,we studied two plant species,H.courbaril(JA)and H.stigonocarpa(JU),popularly known as courbaril and jatobá-do-cerrado.
The experiment was run with a 2×5 factorial system,with five replicates,referring to:2 species(H.courbaril and H.stigonocarpa); five stages of hydration and rehydration(1:control treatment E0;2:plants with 13 days of stress after incubation—E13;3:Plants with 26 days of stress E26;4:The plants were established after 26 days after incubation and rehydrated for two days(RD2);5:rehydrated for two days(RD4)).
Plants were grown in pots containing 18 kg of mediumtextured yellow latosol and irrigated to field capacity on alternate days,kept in an environment with natural lighting with an average of photosynthetically active radiation(PAR)of 1130 μmol m-2s-1,reaching daytime temperature of 30± °C with air relative humidity variation between 60.5 and 80%.
Biochemical responses to water deficit were evaluated on days 0,13 and 26,and responses to rehydration were measured on the days 2 and 4 after the 26 days of water deficit.All pots were weighed every other day in order to maintain the water capacity of all groups.
Osmoregulator evaluation
At the end of the experiment,the fresh plant material was used to quantify nitrate reductase activity.Collected leaves were dried in an air circulation oven at 65°C for 72 h.They were then ground and packed in hermetically sealed vials pening biochemical analyses.Seedling behavioral responses were evaluated using the methods described below.
Starch concentrations were quantified using the method described by Dubois et al.(1956)in which ethanolic extraction(50 mg of the roots and leaf dry mass)was carried out in 5.0 mL of 80%ethanol for 30 min at 80°C.Further extraction was performed with 5.0 mL of 30%HClO 4 for 30 min at 25°C.The supernatants collected from the first and second extractions were centrifuged(2000 rpm for 10 min)and the supernatants of each extraction were pooled and calibrated to a volume to 10 mL with distilled water to obtain the total extract.
Sucrose content was quantified using the Van Handel method(1968),in which samples of 30 mg of root and leaf dry mass were used.These were homogenized in 2.0 mL volume Eppendorf tubes containing 1.5 mL of MWC solution(methanol,chloroform and water,12:5:3 v/v/v),and agitated in a shaker for 30 min at room temperature.The homogenate was centrifuged at 10,000 rpm for 10 min and the supernatant was collected.The residuals were again extracted with equal volume of MCW,followed by a new centrifugation and another collection of supernatants in order to obtain the total extract.
Glycine betaine content was quantified using the method described by Grieve and Grattan(1983)in which 25 mg of lyophilized or oven dried DM were transferred into 2 mL Eppendorf tubes and 2 mL of distilled water were added.The solution was stirred for 4 h in the shaker at 25°C(cold extraction)and centrifuged at 10,000 rpm for 10 min at 25°C.After centrifugation,the supernatant was collected to obtain the aqueous extract and the precipitate was discarded.
The proline was obtained using the method described by Bates et al.(1973)in which 50 mg of lyophilized dry mass(DM)were transferred to 15 mL test tubes,adding 5 mL of distilled water and placed in a water bath for 30 min at 100°C.After extraction,the samples were centrifuged in a bench centrifuge(1000 rpm)and the supernatants were collected to obtain the total extract.
Data analysis
Analysis of variance(ANOVA)was performed for a completely randomized design.Means were compared using the Tukey test,at a significance level of α=5%.Statistics were analyzed using the SAS system(SAS version 9.1,SAS institute,Cary,NC,USA,1987).
Results
Concentrations of starch and sucrose
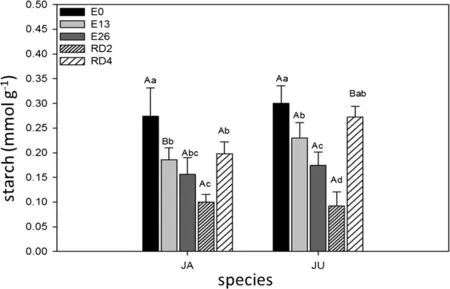
Fig.1 Starch concentrations in H.Courbaril(JA)and H.stigonocarpa(JU)due to the weather.Non-stressed plants(E0),plants stressed for 13 days(E13),26 days(E26)and plants rehydrated for 2 days(RD2)and 4 days(RD4).The values shown are the means and standard deviation of all measurements.In the chart,bars identified with uppercase letters represent the difference between the two species in treatments E0(CV:16.58),E13(CV:13.30),E26(CV:18.48),RD2(CV:24.09)and RD4(CV:9.70).When the bars were labeled with different lowercase letters,they represented the difference between the periods(times)in the species JA(CV:18.58)and JU(CV:13.60).Means were compared using the Tukey’s test(p<0.05)
In both species the control had the highest average starch content(0.18 and 0.3 mmol g-1of residue).Minimum starch content was recorded for time RD2(0.19 mmol g-1of residue for species JA and 0.09 mmol g-1of residue for species JU(Fig.1).
Controls(E0)for both species(JA=24.93 mg g-1and JU=18.66 mg g-1of MS)presented the lowest sucrose values(Fig.2).The treatments E26(JA=35.21 mg g-1and JU=27.02 mg g-1of MS) and RD2(JA=38.40 mg g-1and JU=33.08 mg g-1of MS)showed the highest sucrose concentrations.
Concentrations of proline and glycine-betaine(GB)
Treatment RD2 (JA=7.19 μmol g-1of MS and JU=5.19 μmol g-1of MS)for both species had the highest proline levels(Fig.3).
GB content was signi icantly greater with increasing stress levels(Fig.4).Larger additions of GB were recorded for treatments E26 and RD2 with the respective means of 16.85 and 18.52 μg g of GB g-1MS for species JA.For species JU,mean GB was lower at 8.80 and 11.06 μg g of glycine-betaine g-1MS,respectively.The control showed lowest concentrations of GB for both species.
When irrigation was resumed,some concentrations reacquired pre-stress levels.Although water deficiency altered the concentrations of all solutes,after rehydration they returned to normal,indicating that the water deficit period(26 days)did not cause irreversible stress.
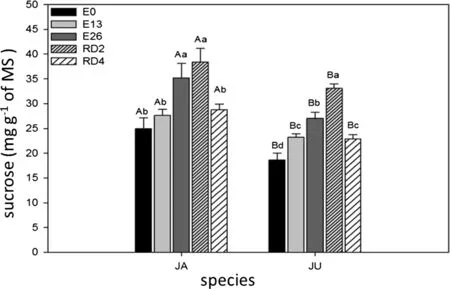
Fig.2 Concentration of sucrose in JA(H.courbaril)and JU(H.stigonocarpa)due to the weather.Non-stressed plants(E0),plants stressed for 13 days(E13),26 days(E26)and plants rehydrated for 2 days(RD2)and 4 days(RD4).The values shown are the means and standard deviation of all measurements.In the chart,bars identified with uppercase letters represent the difference between the two species in treatments E0(CV:8.25),E13(CV:3.90),E26(CV:7.22),RD2(CV:5.78)and RD4(CV:3.92).When the bars were labeled with different lowercase letters,they represented the difference between the periods(times)in the species JA(CV:7.03)and JU(CV:4.14).Means were compared using the Tukey’s test(p<0.05)
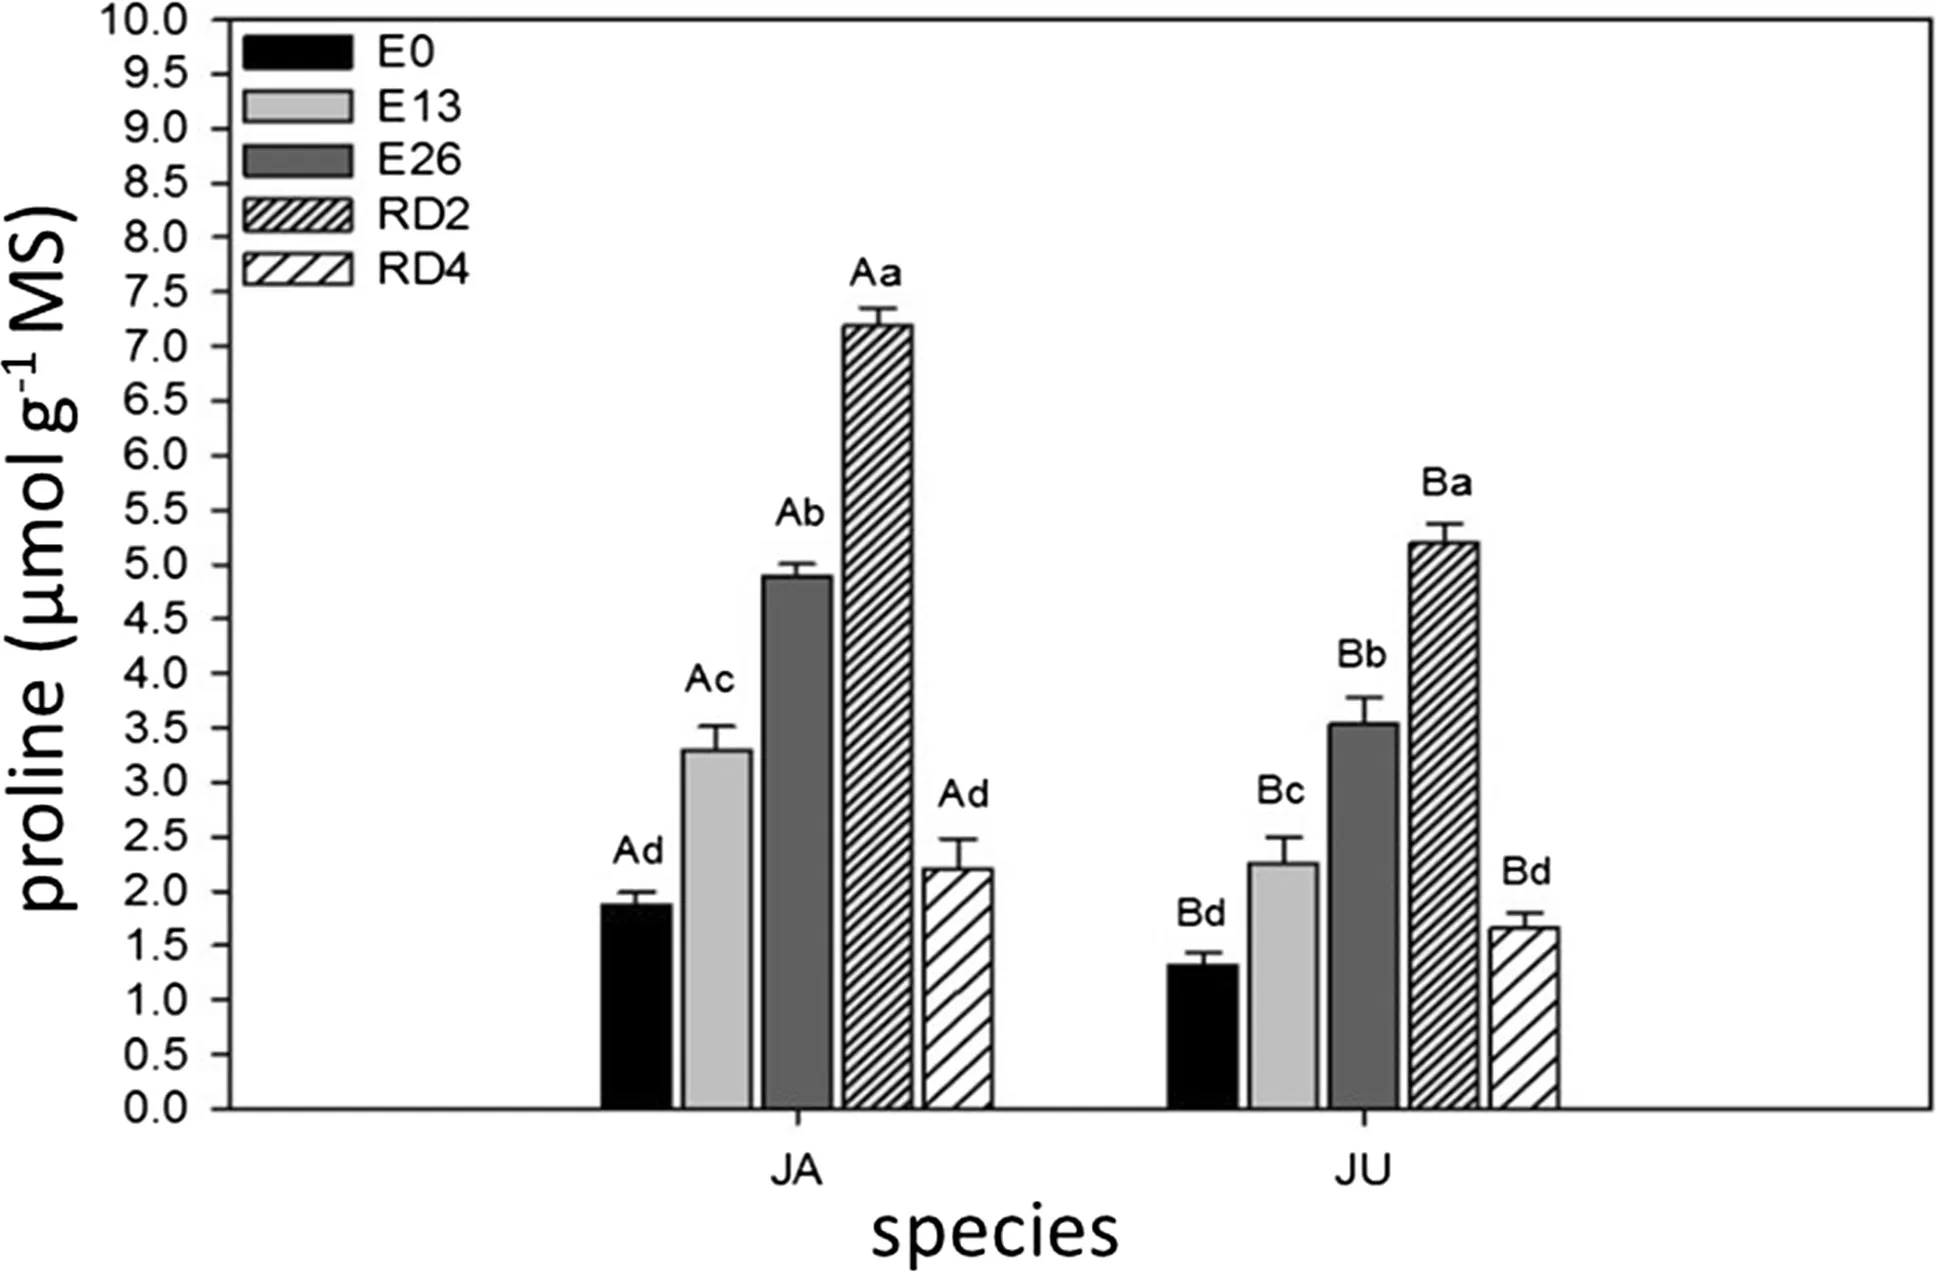
Fig.3 Concentration of proline in JA(H.courbaril)and JU(H.Stigonocarpa)due to the weather.Non-stressed plants(E0),plants stressed for 13 days(E13),26 days(E26)and plants rehydrated for 2 days(RD2)and 4 days(RD4).The values shown are the means and standard deviation of all measurements.In the chart,bars identified with uppercase letters represent the difference between the two species in treatments E0(CV:7.33),E13(CV:8.19),E26(CV:4.60),RD2(CV:2.87)and RD4(CV:11.77).When the bars were labeled with different lowercase letters,they represented the difference between the periods(times)in the species JA(CV:4.97)and JU(CV:2.79).Means were compared using the Tukey’s test(p<0.05)
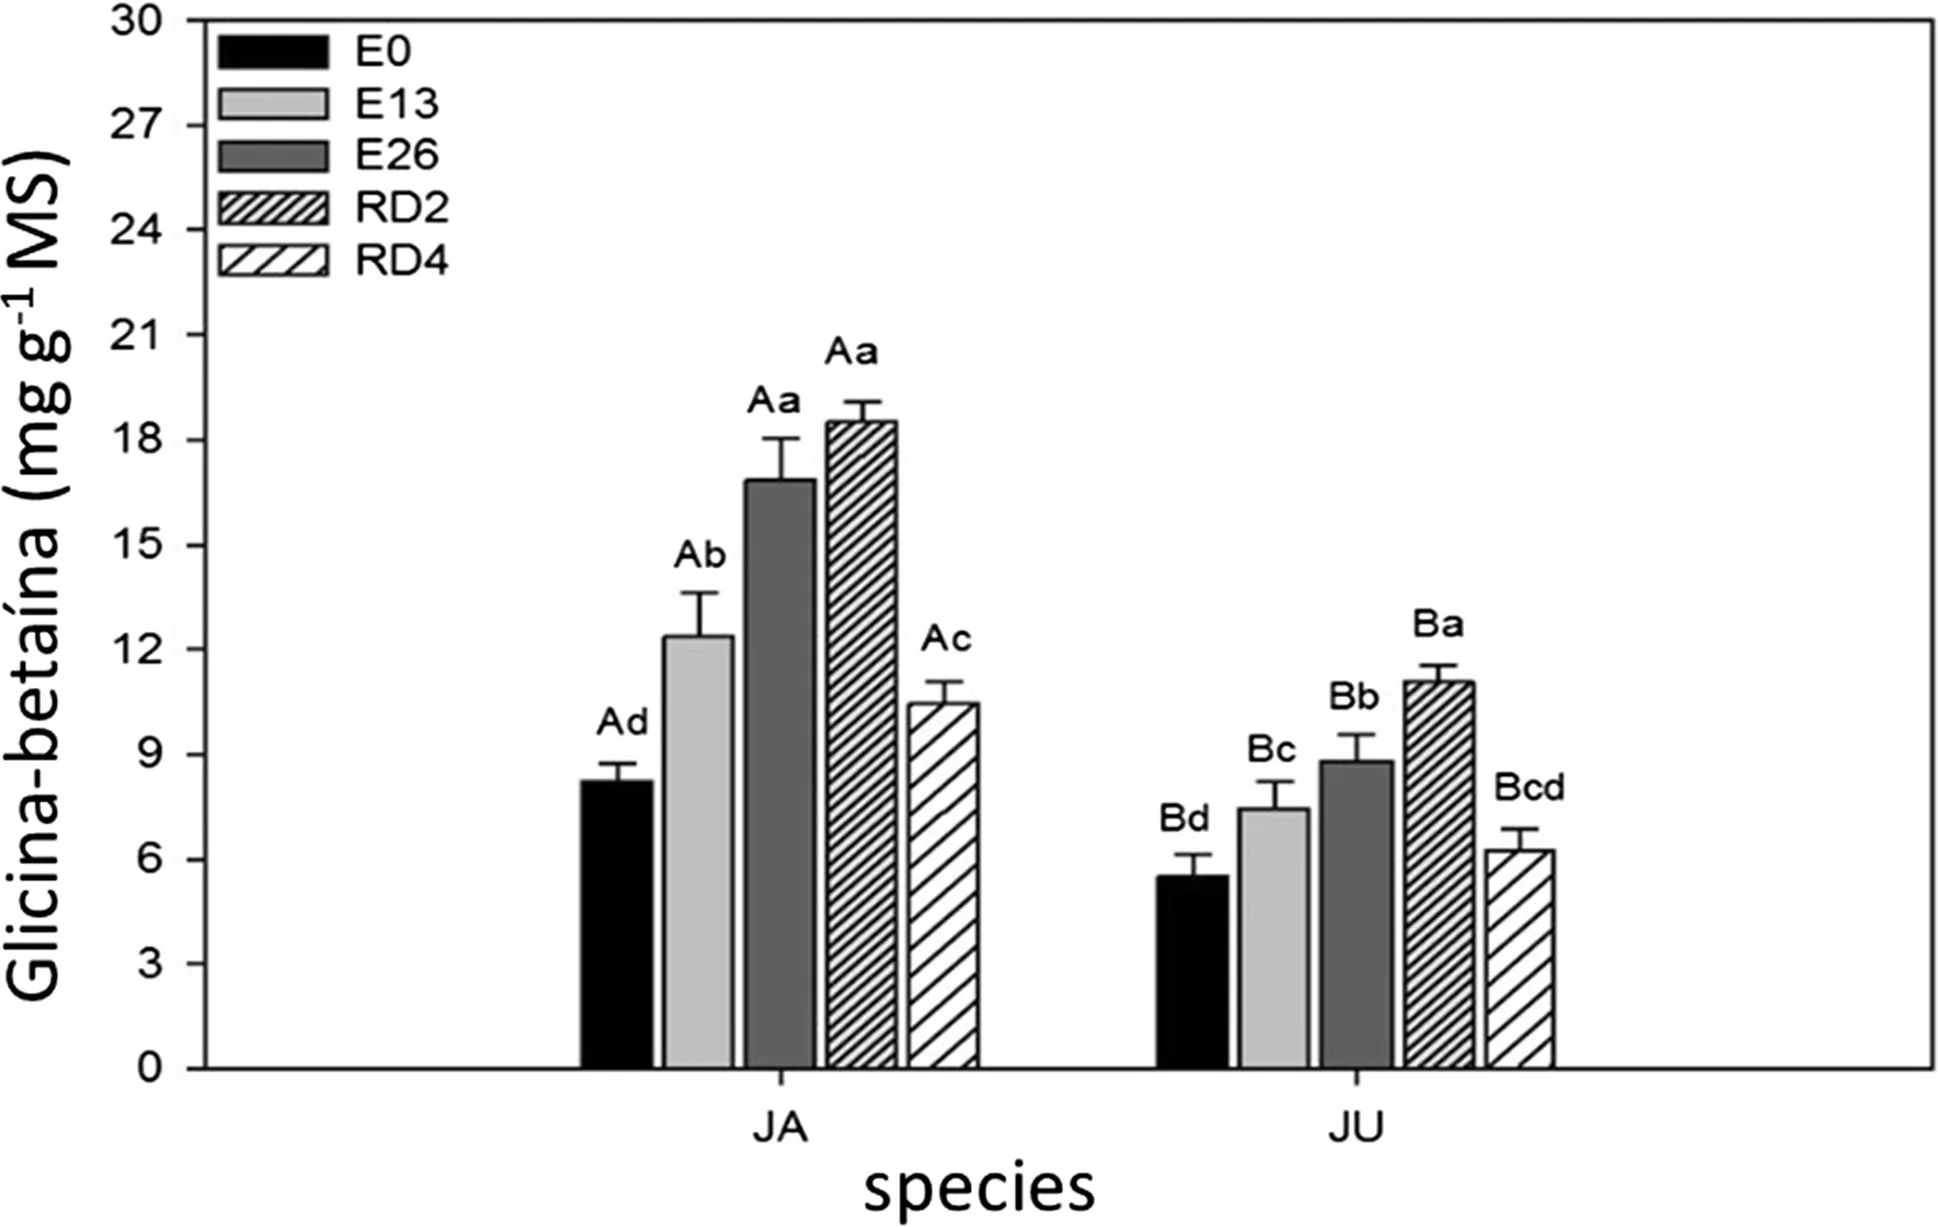
Fig.4 Glycine-betaine(GB)in JA(H.courbaril)and JU(H.stigonocarpa)due to the weather.Non-stressed plants(E0),plants stressed for 13 days(E13),26 days(E26)and plants rehydrated for 2 days(RD2)and 4 days(RD4).The values shown are the means and standard deviation of all measurements.In the chart,bars identified with uppercase letters represent the difference between the two species in treatments E0(CV:8.36),E13(CV:10.48),E26(CV:12.82),RD2(CV:3.45)and RD4(CV:7.29).When the bars were labeled with different lowercase letters,they represented the difference between the periods(times)in the species JA(CV:4.97)and JU(CV:2.79).Means were compared using the Tukey’s test(p<0.05)
Discussion
Concentrations of starch and sucrose
The decline in starch concentration was due to increased activity of enzymes responsible for starch hydrolysis,such as α-and β-amylase enzymes,and also to the accumulation of sugars in plants subjected to water deficiency.Thus,when the reserve polysaccharides were mobilized,the product of the hydrolysis was usually sucrose,which is considered the main transporting sugar in plants.
The reduction in starch concentration was not accompanied by an increase in soluble sugars content,which is indicative of consumption of these sugars to keep plants alive,even in drought conditions in plants subjected to eleven days of water stress(Melo et al.2007).
The increase in sucrose concentration probably occurred due to the degradation of the starch by the sugars of the α and β-amylase enzymes.In addition,this sugar can be broken and the starch processed through biochemical reactions,turning it into sucrose.Among the various sugars formed,sucrose is the principal one and is transported by the plant.The results obtained in this work were similar to those reported by Brito et al.(2016),in which young H.courbaril L.plants submitted to water stress and flood con firmed that leaves of plants submitted to water de ficiency (36.875 mg g-1MS sucrose)showed higher sucrose concentrations when compared to leaves of control plants(27,622 mg sucrose g-1MS)and flooded plants(15,533 mg sucrose g-1MS).Liu et al.(2011)reported that sucrose content gradually increases in plants subjected to water deficiency and this may be related to degradation of biological membranes due to water stress in the cytosol of the plant and also the elevations in the content of ionic substances,which entails the inactivation of several enzymes in the cytosol.
Concentrations of proline and glycine-betaine(GB)
Proline is an osmoregulator important in the protection of plants submitted to abiotic stresses,favoring both osmotic adjustment and increase in the contents of other osmolytes.This result has been demonstred by Taiz and Zeiger(2006)and Ashraf and Foolad(2007).
The formation of amino acids through protein degradation and high levels of ammonia might explain the higher increases in glycine betaine contents in plants submitted to water deficit(Mcneil et al.1999).
Sakamoto and Murata(2002)reported that changes in concentrations of GB are probably due to its function as an osmoregulator,but also to its function in stabilizing the structures and activities of enzymes of the protein complex,and maintaining the integrity of membranes from the damaging effects of different abiotic stresses.Nascimento(2009)reported that H.courbaril performs osmotic adjustment when exposed to water stress.Nascimento et al.(2015)verified that jatobáplants in water deficit condition present a osmotic adjustment due to the increase of the turgor in the leaf.
Conclusions
Young H.courbaril and H.stigonocarpa plants are influenced by water deficiency and rehydration,in which the osmotic adjustment in the leaves occurred to maintain the cellular turgescence.These species can adapt to adverse conditions of abiotic stress.
AcknowledgementsThe authors are grateful to the Universidade Federal Rural da Amazônia for the financial support of this work and the collaborations of researchers.
 Journal of Forestry Research2018年6期
- Journal of Forestry Research的其它文章
- Black locust(Robinia pseudoacacia L.)as a multi-purpose tree species in Hungary and Romania:a review
- The impact of the environmental factors on the photosynthetic activity of common pine(Pinus sylvestris)in spring and in autumn in the region of Eastern Siberia
- Effect of nitrogen levels on photosynthetic parameters,morphological and chemical characters of saplings and trees in a temperate forest
- Free amino acid content in trunk,branches and branchlets of Araucaria angustifolia(Araucariaceae)
- Exogenous application of succinic acid enhances tolerance of Larix olgensis seedling to lead stress
- Pilot study on the effects of elevated air temperature and CO2 on artificially defoliated silver birch saplings
