Mixed-effects modeling for tree height prediction models of Oriental beech in the Hyrcanian forests
Siavash Kalbi•Asghar Fallah•Pete Bettinger•Shaban Shataee•Rassoul Yousefpour
Abstract Height–diameter relationships are essential elements of forest assessment and modeling efforts.In this work,two linear and eighteen nonlinear height–diameter equations were evaluated to find a local model for Oriental beech(Fagus orientalis Lipsky)in the Hyrcanian Forest in Iran.The predictive performance of these models was first assessed by different evaluation criteria:adjusted R2,root mean square error(RMSE),relative RMSE(%RMSE),bias,and relative bias(%bias)criteria.The best model was selected for use as the base mixed-effects model.Random parameters for test plots were estimated with different tree selection options.Results show that the Chapman–Richards model had better predictive ability in terms of adj R2(0.81),RMSE(3.7 m),%RMSE(12.9),bias(0.8),%Bias(2.79)than the other models.Furthermore,the calibration response,based on a selection of four trees from the sample plots,resulted in a reduction percentage for bias and RMSE of about 1.6–2.7%.Our results indicate that the calibrated model produced the most accurate results.
Keywords Random effects·Tree height·Calibration ·Sangdeh forest·Chapman–Richards model·Oriental
Introduction
Measurements of tree heights and diameters are essential in forest assessment and modeling(Schmidt et al.2010).In routine forest inventories,tree heights and diameters at breast height are important growth parameters assessed to describe and estimate stand structure and volume(Jayaraman and Lappi 2001;Adame et al.2008),to calculate an index of stand productivity(Vanclay 1994;Jayaraman and Lappi 2001),and to assess growth dynamics and succession(Curtis 1967;Peng et al.2001;Adame et al.2008).Height–diameter(H–D)models are often used to predict the height of trees where the only the diameter at breast height(DBH)has been measured for all trees in a plot,and where only a few trees were measured for total height.This is because diameters can be determined quickly,easily,and accurately at little cost,but height is more difficult to measure,relatively complex,time-consuming and expensive.Therefore,in association with many permanent and temporary sample plot systems,DBH is conventionally measured for all of the trees sampled but tree height for only a sub-sample of trees over the range of diameters(Huang 1997).H–D regression models are then developed and used to estimate the heights of trees for each diameter class,thus reducing the cost of data acquisition.For these reasons,the development of suitable H–D models may be considered as one of the most important elements in forest planning and monitoring(Schmidt et al.2010).
A number of H–D models,both linear and nonlinear,with only DBH as the predictor variable,have been developed(e.g.,Huang 1997;Zhang 1997;Amaro et al.1998;Krumland and Wensel 1988;Yuancai and Parresol 2001;Temesgen and Gadow 2004;Calama and Montero 2004;Lei and Zhang 2004;Castedo Dorado et al.2005;Sharma 2009;Krisnawati et al.2010;Ahmadi et al.2013;Xu et al.2014;Corral-Rivas et al.2014).For a given species,the H–D relationship varies with the environment and stand conditions and,in the case of even-aged stands,is not constant over time even within a single stand(Curtis 1967;Pretzsch 2009;Arcangeli et al.2014).As a consequence,H–D models,which include DBH as the only explanatory variable,are fundamentally local and need to be defined for each single stand at every measurement occasion.The use of a local model may still provide the best unbiased estimates of tree height if based on a sufficient number of measurements(van Laar and Akça 2007;Arcangeli et al.2014),but it is a costly and sometimes impractical approach.More recently,several studies have included mixed-effects in calibrating the model parameters for describing the H–D relationship in order to tackle the problem of a lack of independence among height and DBH measurements that arises from the inherently hierarchical structure of the data(trees within plots within stands).
Peng et al.(2001)examined the relative performance of a Chapman–Richards H–D model for nine boreal forest species in Ontario,Canada,and recommended the Chapman–Richards function based on its mathematical properties,its amenity to biological interpretation,and its satisfactory prediction performance.However,the hierarchical structure of the datasets used in the previous H–D models(i.e.,trees within plots and plots within stands)usually leads to a lack of independence among measurements because observations from the same sampling unit are highly correlated(West et al.1984).In essence,trees from the same plot tend to be more similar to each other than they do to trees in different plots,and the classical regression assumption that observations are independent may not hold(Neter et al.1990).Mixed model techniques have been used successfully to deal with this problem(Hall and Bailey 2001),providing a statistical method capable of explicitly modeling this nested stochastic structure.
Iran has lagged behind in adopting modeling techniques that can assist in the estimation of tree heights,particularly approaches that lead to higher precision and accuracy than what might be obtained using ordinary least squares and nonlinear least squares methods(which are the commonly used approaches).This study was therefore carried out to demonstrate the utility of the mixed effects modeling approach in tree height prediction models.Mixed-effect models allow for both population-averaged and subject specific responses.The first considers only fixed parameters common to the population,while the second considers both fixed and random parameters,common to each subject.The inclusion of random parameters enables the variability of given phenomena among different locations and time to be modeled(Lappi and Bailey 1988),once a common fixed functional structure has been defined(Lindstrom and Bates 1990).The Hyrcanian forests in Iran have been forested since the third geological era and are considered one of the oldest forests in the world(Sagheb-Talebi et al.2004).Oriental beech(Fagus orientalisLipsky)is one of the most abundant broad-leaved species in the Hyrcanian forests,accounting for approximately 17.6%of the total forest area,30.0%of the standing volume and 23.6%of the stem numbers.The aim of this study is to evaluate and modelF.orientalisheight–diameter relationships using a mixed effects modeling approach to determine whether tree heights can be estimated with higher precision and accuracy.The objectives of this study were:(1)to compare linear and nonlinear H–D equations for unevenaged forests in northern Iran;and,(2)to use local and generalized equations to study the capacity of mixed models to explain the variability in the H–D relationship.
Materials and methods
Study area
The study area was the Hyrcanian forest,District 3 of the Sangdeh’s forests,northern Iran(Fig.1).The management plan indicates that the total area is 2709.0 ha.The study area consists of uneven-aged forests dominated byF.orientaliswhich cover approximately 90%of the area.Elevation ranges from 320 to 1350 m a.s.l.
The data used for modeling the H–D relationships were collected using a random systematic network of 233 permanent sample plots.These plots were circular and 0.1 ha in size.In each plot,information on all trees with DBH>12.5 cm was collected.The height of five trees in each plot was determined as were basal areas and number of trees per hectare.A total of 1165 height–diameter measurements were recorded and separated into two sets;70%(n=810)of the data were used for model fitting(Fig.2a),and 30% (n=355)for model calibration(Fig.2b)and validation.In addition,an independent data set was collected which consisted of 100 trees in 20 sample plots,and used for model testing.
Model analyses
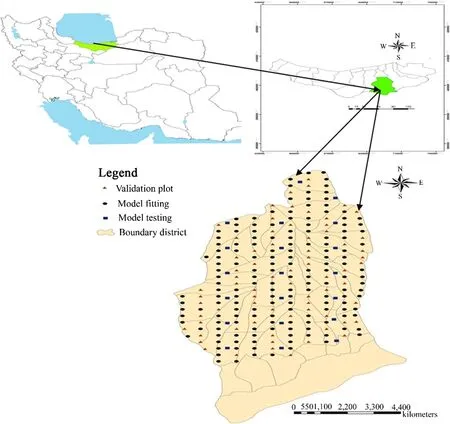
Fig.1 Location of the study area
A number of different equations have been described in the literature for modeling H–D relationships with stand variables(e.g.,Huang et al.1992;Soares and Tomé2002;Trincado et al.2007).In this study,two linear regression models,including simple and quadratic models,and 18 generalized H–D equations were selected(Table 1).All have adequate mathematical properties and have performed satisfactorily in previous studies(Huang et al.1992;Adame et al.2008;Ahmadi et al.2013;Li et al.2015).
Model selection and evaluation
Evaluation of the models was based on the root mean squared error(RMSE),relative RMSE,bias,relative bias,adjusted coefficient of determinationand significance of parameters estimate(p<0.05).The model resulting in the largestsmallest relative RMSE,RMSE,and smallest values of bias and relative bias was selected as the best model.The expressions of these statistics are as follows:
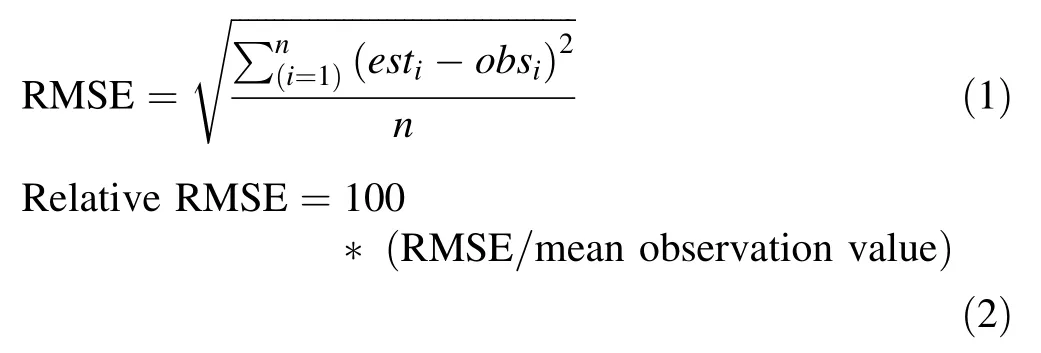
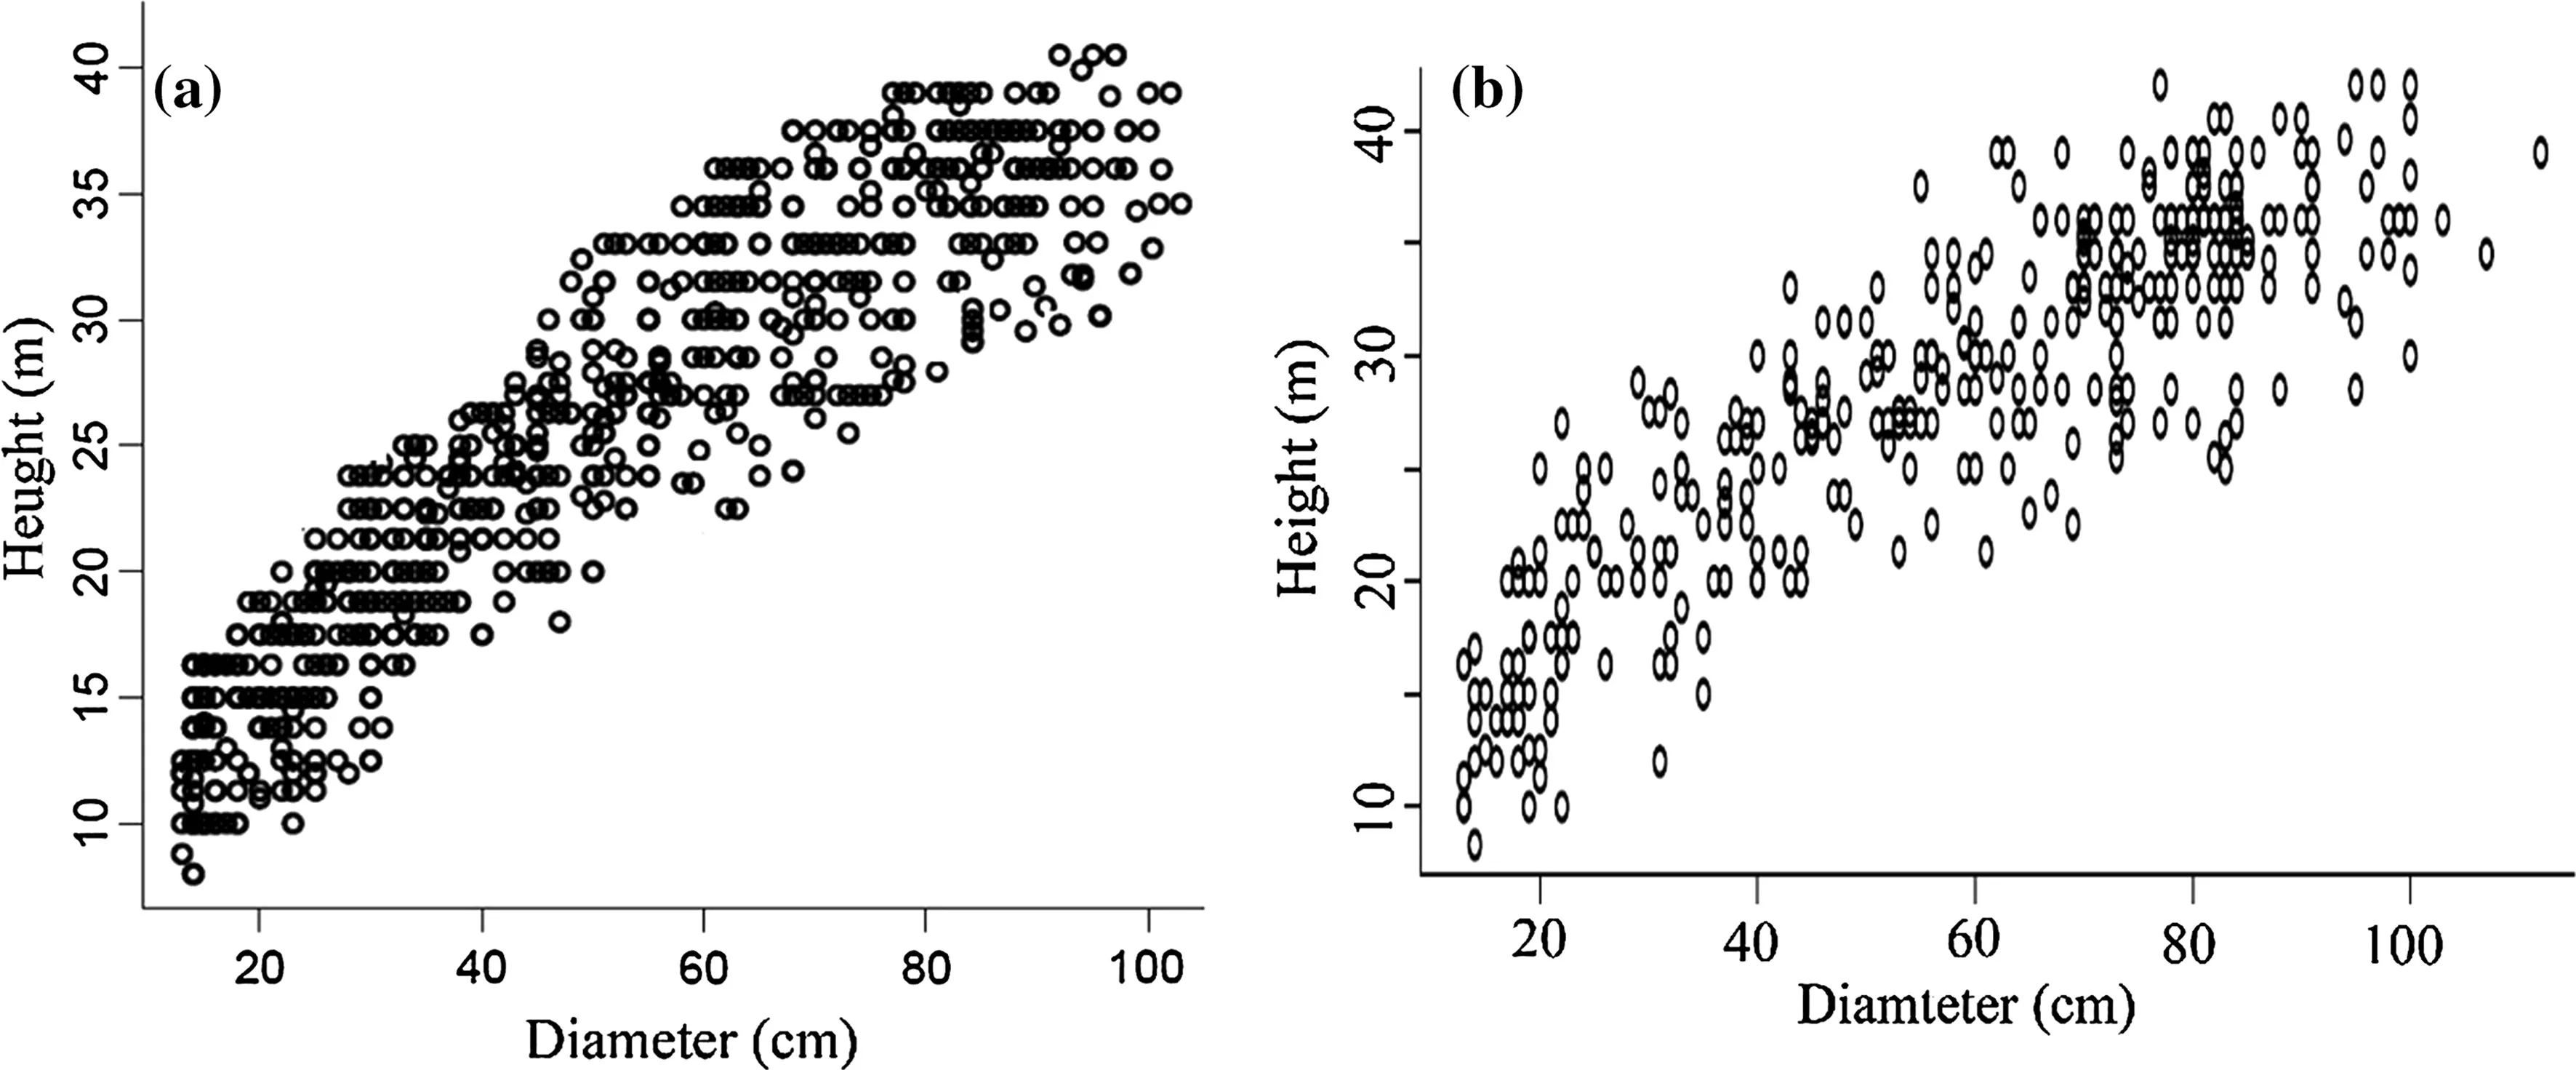
Fig.2 Model fitting(a)and model validation data(b)for Oriental beech height–diameter relationships
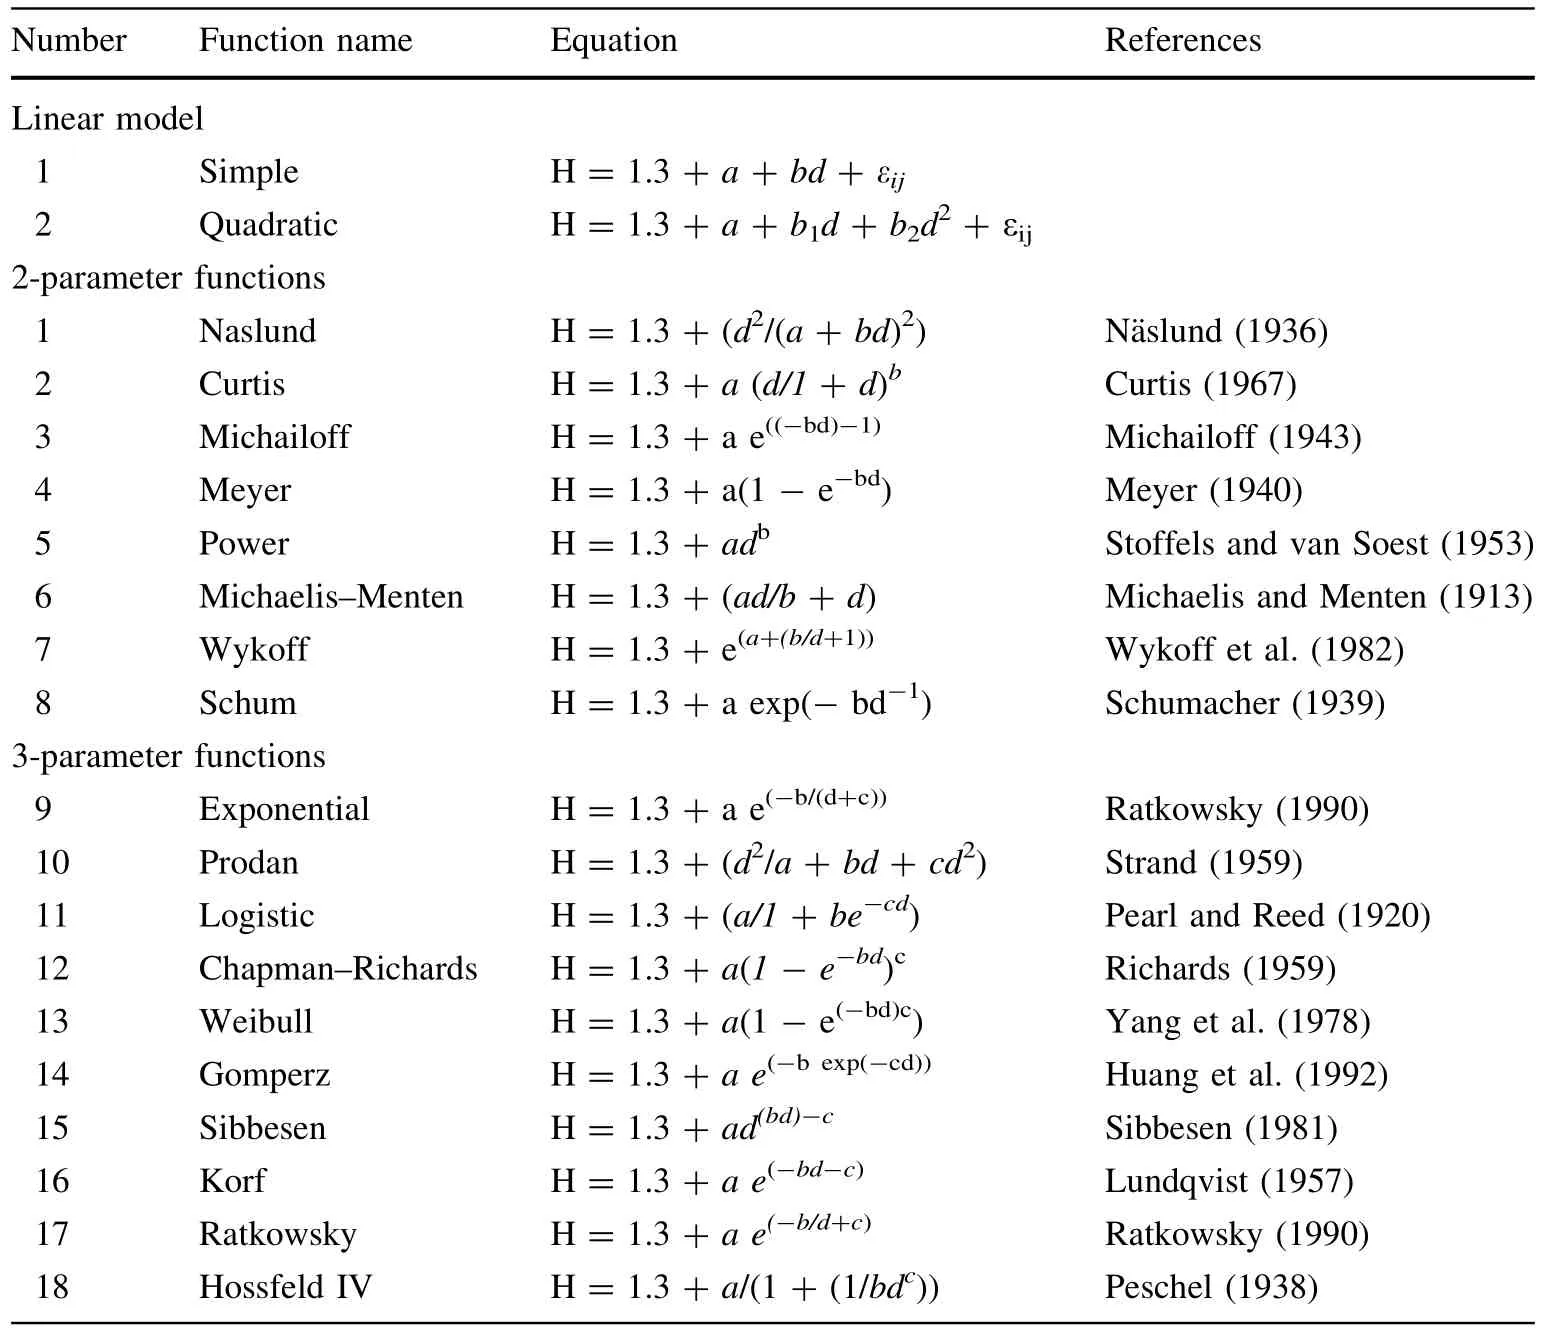
Table 1 Generalized H–D equations

whereestiis theith estimated value;obsitheith observed value andnthe number of observations.
Nonlinear mixed modeling
Once the best eighteen generalized H–D models were selected,a nonlinear mixed-effects modeling framework was used to fit the models to the sample data.A general expression for the model may be written(Lindstrom and Bates 1990)as follows:

whereyiis an(ni×1)observation vector of heights from theith sampling unit(plot),f(.)a nonlinear function,Φia(r×1)parameter vector(ris the number of parameters in the model),Xithe(ni×r)predictor matrix for theith plot,andeia(ni×1)vector of the residuals.
Equation(5)is assumed to be common to all plots but the parameter estimates may vary across the plots.Therefore,regression coefficients can be broken down into fixed components,common to the population,and random components,specific to each plot.Nonlinear mixed models contain unobserved mean-zero random variables known as random effects.These are conditional upon the observed data and assumed to have a Gaussian distribution with some general nonlinear mean function and unknown variance–covariance parameters(Adame et al.2008).
Details on nonlinear mixed-effects modeling for height–diameter relationships are provided by Calama and Montero(2004)and Castedo Dorado et al.(2005).A key question when fitting mixed-effects models is the selection of parameters considered as representing fixed effects and those considered as representing random effects.The best local mixed-effects model was the Bertalanffy–Richards model(Yuancai and Parresol 2001;Corral-Rivas et al.2014)in which parameters a and c were expanded for mixing(Eq.5)and which yielded a 33%reduction in RMSE relative to the ONLS model.

wherea,bandcfixed effects,anduandvare random effects.
Parameter estimation for nonlinear mixed-effects models requires numerical integration of random effects in the model,which often enter it nonlinearly.Traditional approaches for fitting nonlinear mixed models are based on a linear approximation to the marginal likelihood function,using an expansion with a Taylor series so that the vector of random parameters is linear.The Taylor expansion can be either at 0(best linear unbiased predictor,BLUP)or at the empirical best linear unbiased predictor(EBLUP)of the random effects.The first approach is less expensive in terms of computing time but the second approach can be more accurate,although possibly more unstable(Wol finger and Lin 1997).The variance components,along with the parameters of fixed predictors,were estimated using the REML method since it results in lower biases(Littell et al.1996).The maximization of the marginal likelihood function was achieved using the BLUP approximation(Beal and Sheiner 1982).
Calibrated response pattern
For the purposes of forest management,yield predictions are important and previous height observations may or may not be available for a studied plot.If a subsample ofktree heights has been measured,such data can be used to predict the random effects vectorbi.The prediction ofbiis carried out using the expression of Vonesh and Chinchilli(1997):

Results
Summary statistics,including mean,minimum,maximum,and standard deviation ofF.orientalisvariables for both the fitting and evaluation data sets are shown in Table 2.
Selection of the basic nonlinear H–D model
Results from the comparative analysis between the functions,including values of RMSE,%RMSE,bias,and%bias,are shown in Table 3.These goodness-of- fit statistics indicate that the Chapman–Richards model has better predictive ability in terms of(0.81),RMSE(3.7 m),%RMSE(12.9%),bias(0.8),%bias(2.71%)than the other models.Therefore,the Chapman–Richards was chosen as the best H–D relationship model and used for the nonlinear mixed effect modeling analysis that simultaneously included both fixed and random parameters in the model structure.
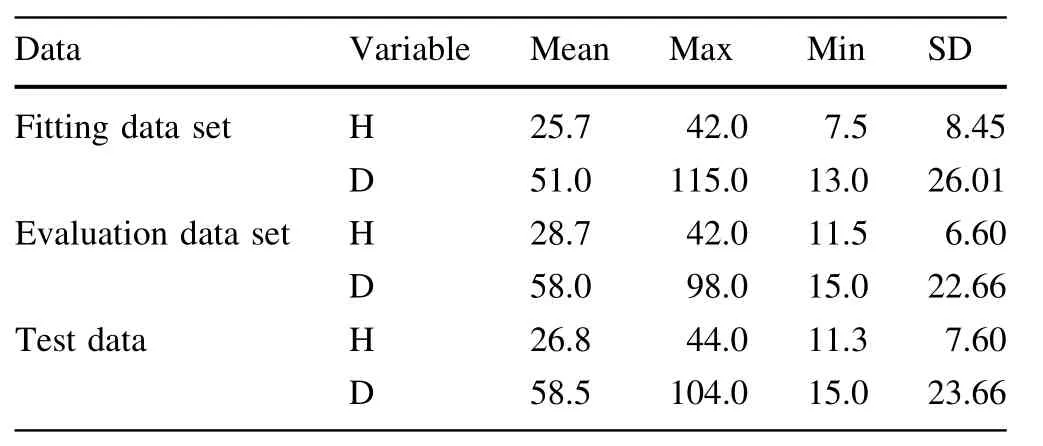
Table 2 Description of the fitting and evaluation data sets
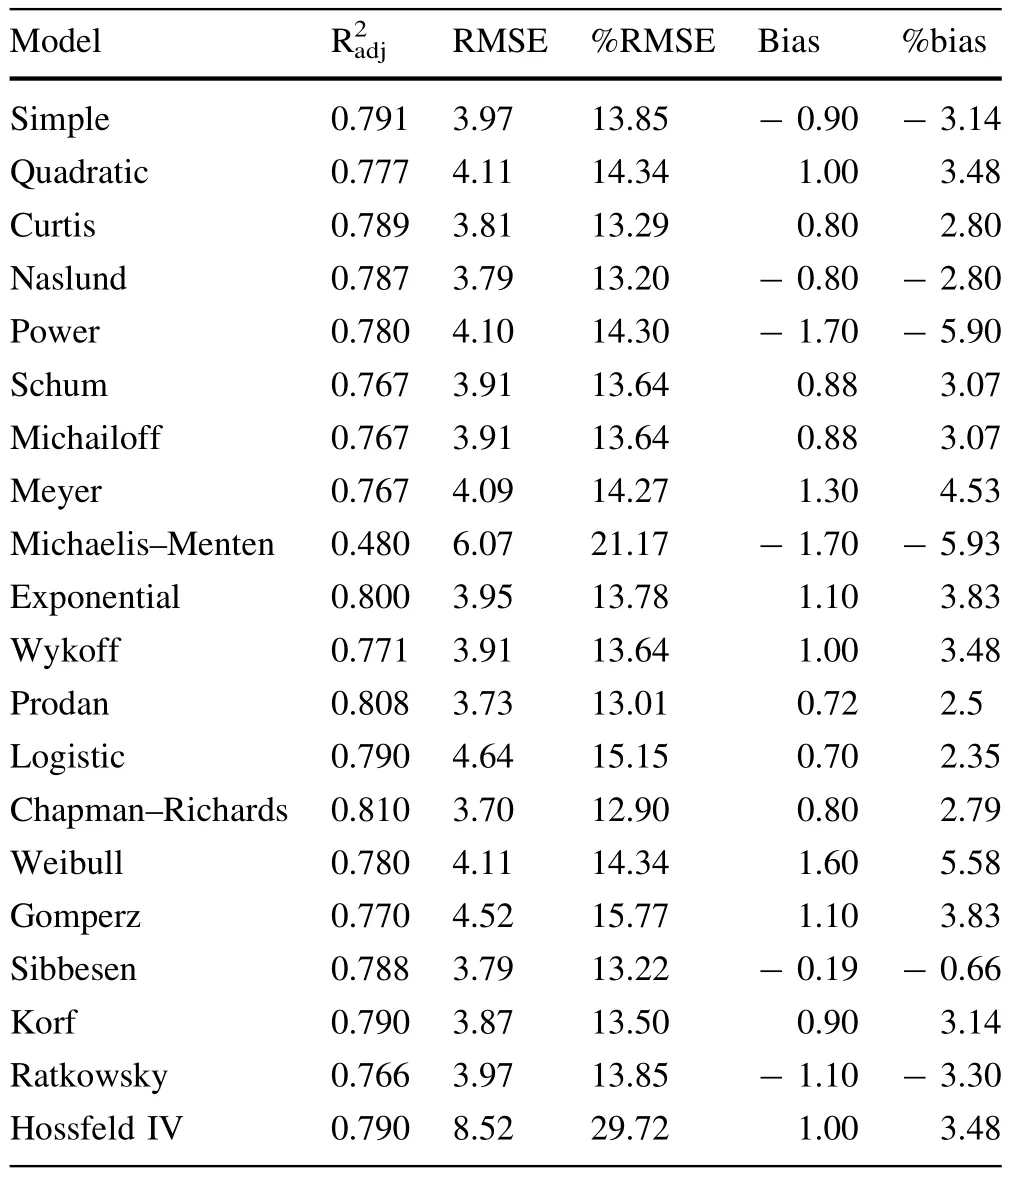
Table 3 Results from the comparative analysis between the functions
Parameter estimations with their standard errors and probability levels for all models are shown in Table 4.All parameters were significant(p<0.05).
The residuals versus predicted heights in the Chapman–Richards model are shown in Fig.3.Most data points were distributed around the zero line.This model showed an approximately homogeneous variance over the full range of the predicted values,as well as independence of the residuals.
As shown in Fig.4 for the Chapman–Richards model,the biases for large values of diameter were greater than the biases for other values;this may be due to a small number of observations in larger trees.
Calibration response evaluation
Results from the analysis of different sample sizes and designs on the predictions are shown in Table 5.The largest values of RMSE and bias were obtained when applying the fixed-effects response model without predicting random parameters.However,the best predictive results with the lowest bias and RMSE,0.1 m and 3.24 cm,respectively,with the highest reduction percentages,-2.68 and-1.6%,were by the sampling alternative based on the selection of four trees in the sample plot.
The estimates of the mixed-effects model(Eq.6),along with variances and covariances for the random parameters in Eq.(6)and the goodness-of-fit statistics are shown in Table 6.
Discussion
Tree height is an important variable used for estimating stand volume,site quality and for describing stand structure.A height inventory for all trees in a stand is almost impossible to obtain unless in particular conditions and if scientific research is being carried out(perhaps using LiDAR).Therefore,height–diameter(H–D)functions are often utilized so that the height of an individual tree can be predicted only from the diameter.This is often convenient since measuring diameter is relatively simple,accurate,and inexpensive(Corral-Rivas et al.2014).For these reasons,the development of suitable height–diameter models may be considered one of the most important elements in forest design and monitoring.The aim of this study was to develop a model capable of predicting the height–diameter pattern ofF.orientalisfor application in yield simulators and basic calculations of inventories.We compared the capability of two linear regression models and eighteen general H–D models.The results show that nonlinear models performed better than linear models.This is consistent with the findings reported by Li et al.(2015)that showed for height–diameter modeling,nonlinear models are more flexible than linear models.Among these twenty models,the nonlinear Chapman–Richards model that accounted for 81%of the total variance in height–diameter relationships showed the best predictive ability based on the statistics fit.Our results are consistent with findings reported by Zhang (1997)and Peng et al.(2001).According to Yuancai and Parresol(2001),the Chapman–Richard’s functions is flexible and versatile for modeling H–D relationships.Peng et al.(2001)also found the Chapman–Richards moel,along with two others,superior to other models as regards prediction performance.According to Zeide(1993),Chapman–Richard’s model,valued for its accuracy,has been employed more than anyother functions in studies of tree and stand growth.At one time,it was noted that the Chapman–Richards model was widely used for forest growth and yield purposes(Amaro et al.1998).However,the mathematical features and the growth performance of the Chapman–Richards function have not been fully understood,and there still exists some unclear conceptions(Lei and Zhang 2004).In addition,thenonlinear mixed-effects modeling procedure was used and the Chapman–Richards model was fitted by including simultaneously both fixed and random effects on the height model structure.
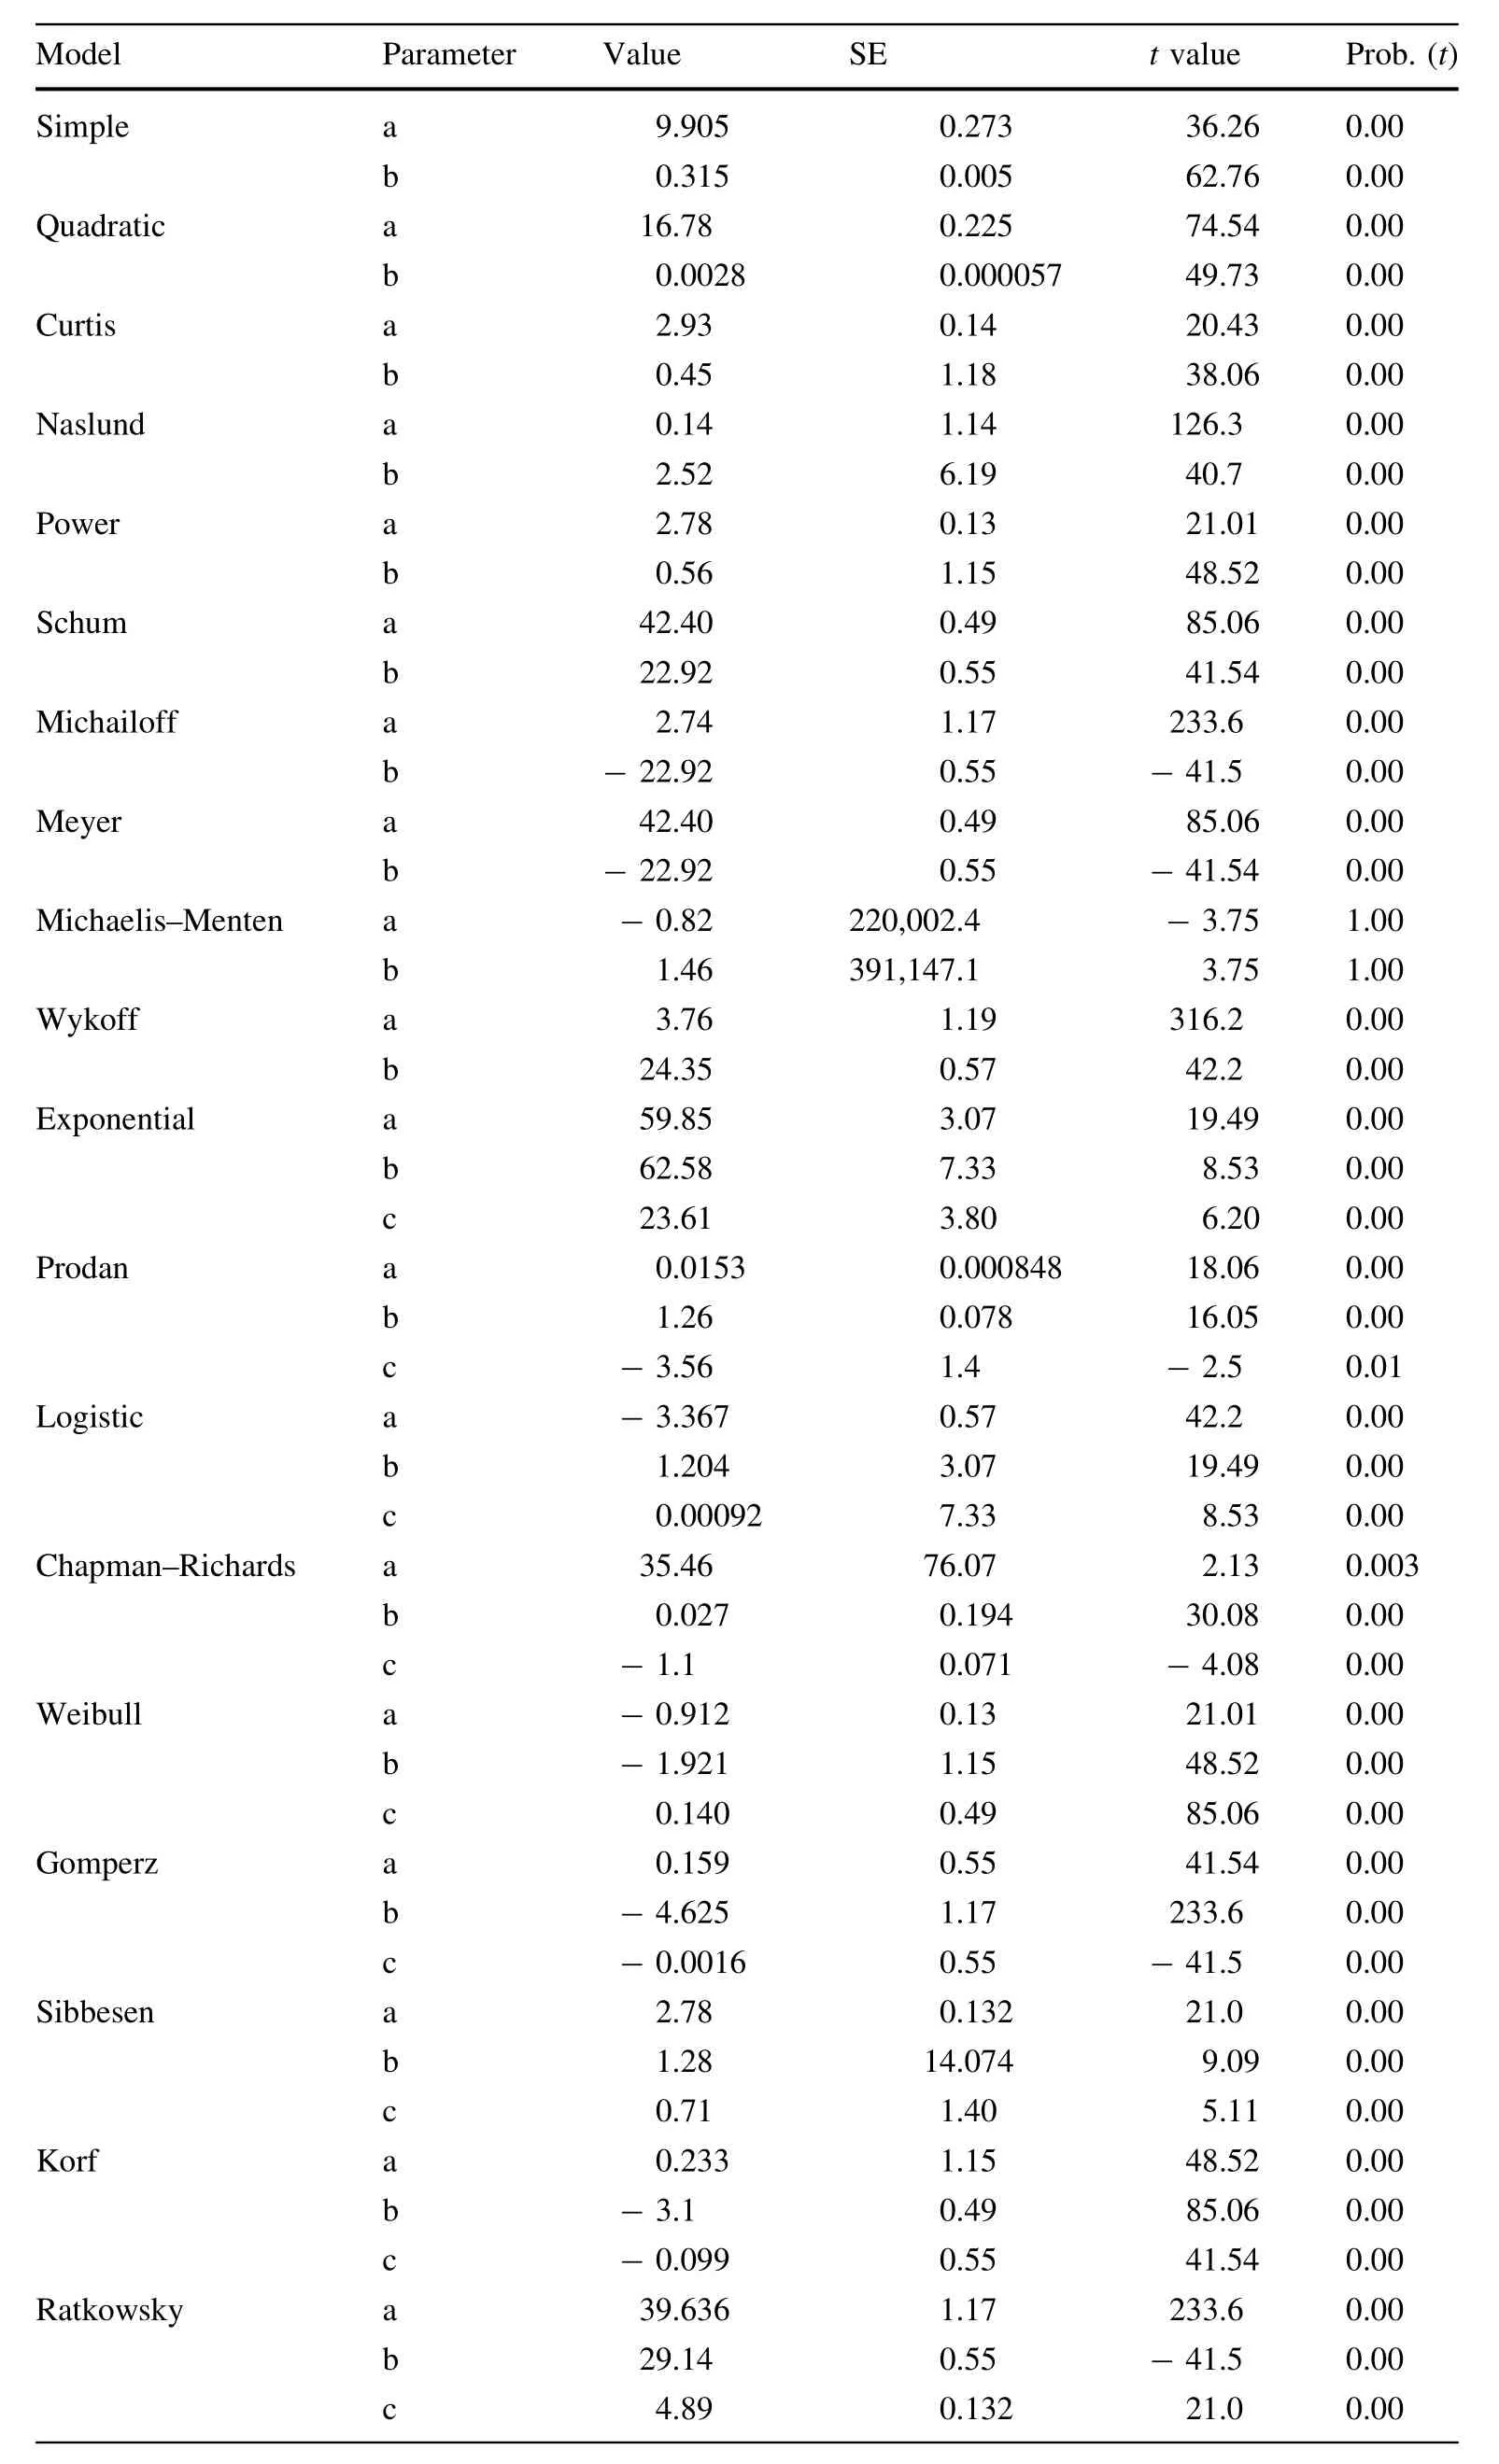
Table 4 Parameter estimations with their standard errors and probability levels

Table 4 continued
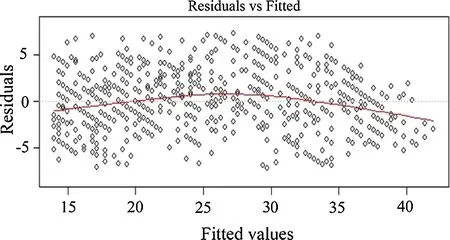
Fig.3 Residual plots in the validation dataset for the three best models

Table 6 Fitting parameters and variance component for mixed model
The calibration response based on the selection of four trees in the sample plots resulted in fewer biased predictions,the highest reduction percentage for bias and RMSE,about 2.68 and-1.6%,respectively.The results obtained in this research are similar in many respects to those obtained by other researchers.For example,Corral-Rivas et al.(2014)observed that a mixed-effects model had better fit statistics(R2=0.85;RMSE=2.21)than the base model fitted using ONLS(R2=0:73;RMSE=2.95).This is similar to that obtained by Calama and Montero(2004)and Castedo Dorado et al.(2005)for different types ofPinusspecies.Calama and Montero(2004)proposed the use of height measurements from four random trees.Krumland and Wensel(1988)suggested that height measurements should be for four dominant trees,and Castedo Dorado et al.(2005)found the heights of three trees per plot to be adequate.The calibration responses for any mixed-effects model depend on the model structures and the characteristics of species growing in different regions and under local conditions.Thus,some sampling scenarios with different sub-sample selections can present more additive information for calibration than other sampling alternatives.

Fig.4 Values of average bias in relation to DBH for the best models

Table 5 Comparisons of nonlinear mixed effect on Chapman–Richards model’s predictive performance for different sub-sample size alternatives in calibration response
Conclusions
Based on the nonlinear mixed model techniques,eighteen basic height–diameter models were evaluated forF.orientalis.We found that the Chapman–Richards model was the best and this was selected for calibration.We compared the basic models with the calibrated model through an evaluation of the biases and the RMSE from individual plots and found that the calibrated model produced the most accurate results.Calibration,including the prediction of random parameters that used the sub-sampled tree measurements obtained from any sample plots,can be recommended for obtaining more effective and predictive results.
 Journal of Forestry Research2018年5期
- Journal of Forestry Research的其它文章
- Environmental load of solid wood floor production from larch grown at different planting densities based on a life cycle assessment
- An overview of proven Climate Change Vulnerability Assessment tools for forests and forest-dependent communities across the globe:a literature analysis
- Assessing the vulnerability of a forest ecosystem to climate change and variability in the western Mediterranean sub-region of Turkey:future evaluation
- Effects of management regimes on carbon sequestration under the Natural Forest Protection Program in northeast China
- Estimation of a basal area growth model for individual trees in uneven-aged Caspian mixed species forests
- Comparable water use of two contrasting riparian forests in the lower Heihe River basin,Northwest China
