Estimation of a basal area growth model for individual trees in uneven-aged Caspian mixed species forests
Zohreh Mohammadi•Soleiman Mohammadi Limaei•Peter Lohmander•Leif Olsson
Abstract The aim of this study was to estimate a basal area growth model for individual trees in uneven-aged Caspian forests.A survey was conducted in order to find a natural forest without any harvesting activities,a so called‘untouched forest’and an area was selected from the Iranian Caspian forest.Three sample plots in the same aspect and of the same forest type were selected.In each plot,total tree height,diameter at breast height,distance of neighbor trees and azimuth were measured.Thirty trees were selected and drilled with increment borer to determine the increment model.Regression analysis was used to estimate the growth model.Results show that,for individual trees,there is a significant nonlinear relationship between the annual basal area increment,as the dependent variable,and the basal area.The results also show that the basal area of competing trees has a positive influence on growth.That the increment is higher with more competing neighboring trees is possibly because plots with higher volume per hectare and more competition,most likely also have higher site index or better soil or better site productivity than the plot with lower volume per hectare.
Keywords Basal area increment·Diameter growth ·Regression analysis·Caspian forests
Introduction
In forest management the objectives often are achieved by controlling the characteristics of a forest stand or set of stands in order to influence the growth and yield of those stands.The availability of information on diameter increment and growth patterns for individual trees is an important asset in forest management which allows the selection of species for logging or protection as well as the estimation of cutting cycles and the prescription of silvicultural treatments.Diameter increment measurements are also required to feed statistical models of forest dynamics both for modelling and simulation(Pereira da Silva et al.2002).Growth and yield models and diameter growth models in particular,are invaluable tools for forest management planning(Uzoh and Oliver 2008).Therefore,predicting growth and yields have long been at the heart of simulating the future forests.Growth and yield models were classified by Clutter et al.(1983)for natural forests(either even-aged or uneven-aged)or plantations(either thinned or unthinned).
Schutz(2006)used an incremental growth model based on a basal area-oriented density index(GCUM)for pure beech plenter forests.Plenter,or ‘‘selection’’forests,the way to achieve,assess and control sustainability differs fundamentally from most other systems with obvious generation alternation.In this text,the term ‘‘plenter’’was used because the term ‘‘selection’’generally has other implications.The determination of the optimal stand density ensuring equilibrium uses an incremental growth model based on GCUM.This provided a sample of 15 inventories(3 plots×5 occasions)and 12 increment periods.Because the stem form-function used for standing volume calculation in Tharandt,Germany is derived from regular forest stands,volume has been estimated according to the local volume-function per DBH-class for beech from the Schallenberg-Rauchgrat plenter forest in Switzerland based on section-wise measurement of thinned beech trees.Muller-Landau et al.(2006) fitted growth models to data from 1.7 million trees in 10 tropical forests.They showed that the scaling of mean diameter growth with size varied considerably among the forests,and was not described by a power law with slope of 1/3.They argued that the changing supply of light with size exerted a strong influence on the scaling of growth:small trees were shaded by taller neighbours and grew slowly as a consequence,while larger trees were less affected by shading.Coomes and Allen(2007)explored the factors regulating the diameter growth of 3334 trees of mountain beech(Nothofagus solandri var.cliffortioides(Hook.f.)Oerst.)growing in natural singlespecies forests in New Zealand.Maximum-likelihood modelling was used to quantify the influences of tree size,altitude,the basal area of taller neighbours(BL)and the basal area of all neighbours(BT)on growth.Their interpretation of the models assumed that taller neighbours compete for light whereas all neighbours compete for nutrients.Stadt et al.(2007)compared individual diameter growth of five species of mature trees from natural-origin boreal mixed forests using a series of conventional distance-independent and distance-dependent competition indices,a highly flexible distance-dependent crowding index,and two light resource estimation indices.The crowding index was the superior index for most species and ecosites.However,distance-independent indices,such as basal area of competing trees,were also effective.Distance-dependent light estimation indices,which estimate the fraction of seasonal photosynthetically-active radiation available to each tree,ranked intermediate to low.Determining separate competition indices for each competitor species accounted for more variation than ignoring species or classifying by ecological groups.
Uzoh and Oliver(2008)developed and evaluated a diameter increment model for individual trees of ponderosa pine throughout the species range in the United States using a multilevel,linear-mixed model.Stochastic variability was broken down among period,locale,plot,tree and within-tree components.Covariates acting at tree and stand level,as breast height diameter,density,site index,and competition indices,are included in the model as fixed effects in order to explain residual variability.Adame et al.(2008)developed a distance-independent mixed model for predicting the diameter growth of individual trees in Mediterranean oak(Quercus pyrenaicaWilld.)coppices located in northwest Spain.The data used to build the model came from 41 permanent plots belonging to the Spanish National Forest Inventory,with the dependent variable being 10-year diameter increment over bark for trees larger than 7.5 cm at breast height.The basic field data required for predictions had been divided into four main groups:size of the tree,stand variables,competition indices and biogeoclimatic variables.The most significant independent variables were individual-tree diameters,the basal area of trees larger than the subject tree,dominant heights,site index,and biogeoclimatic stratum.The model was defined as a mixed linear model with random plot effects,achieving an efficiency of 44.4%.Rathbuna et al.(2011)developed diameter growth models for three species in mixed-stands of Coastal British Columbia(BC),Canada under a variety of silvicultural treatments.A random coefficients modeling approach,(i.e.,parameter prediction approach),was used to modify the estimated parameters for each species using functions of tree size and stage of development,site productivity,and inter-tree competition variables,while accounting for temporal correlation within trees.Impacts of fertilization on diameter growth were estimated by including the time since fertilization as an additional variable.
Pokharel and Dech(2012)developed individual-tree basal area increment(BAI)models for major species in the boreal forest of Ontario,Canada.A composite distance independent,individual-tree BAI model was structured based on the log-linearized gamma base function using a dataset derived from a network of 1800 permanent growth plots.A suite of fixed effects covariates that included basal areas of trees larger than the subject tree,diameters at breast height,stand basal areas and latitude,along with ecological land classification ecosites used as a random effect parameter,were found to be significant covariates in the model.A model fitted with the intercept designated as a mixed-effect parameter had a smaller Akaike’s information criterion,(an estimator of the relative quality of statistical models),compared with other competing models.Lohmander(2016)developed an increment diameter model for the optimal stochastic dynamic control of spatially distributed interdependent production units.
Iranian Caspian forests are mixed uneven-aged,consisting of broadleaf species managed for timber production for over 40 years according to forest management plans.Forestry in Caspian forests is based on continuous cover forestry(CCF)management principles.Many different species of trees grow together in large parts of these forests.The types of species studied in this research were beech–hornbeam with other species(ash,lime,maple,and alder).Studying natural uneven-aged forest growth and yield for management requires the inclusion of competition factors as well.Therefore,there is an urgent need to develop growth models for uneven-aged forests that are suitable to actual forest production,and to satisfy the requirements of sustainable forest management(Nguyen 2009).There are a few studies that address the estimation of growth in Iranian Caspian forests.Attarod(1999)investigated and estimated forest growth in southern and northern aspects using a multivariate statistical method.Heshmatol Vaezin et al.(2008)provided a pilot increment model for major species,including hornbeam(Carpinus betulusL.),oriental beech(Fagus orientalisLipsky)and alder[Alnus cordata(Loisel.)Duby]by routinely-measured variables in forest inventories.Amini et al.(2009)investigated the homogeneity of diameter increment models in beech trees.Lohmander et al.(2016)estimated basal area growth and volume functions for beech.In all of the afore-mentioned mentioned studies,competition of neighbouring trees was ignored.The number of options to model forest growth is almost unlimited,such as stand models,models of individual trees,diameter class models,models that describe altitude,slope and directions,and models in continuous or in discrete time.Furthermore,in the Schutz function,increment model was estimated accurately with the two estimators diameter class(di)and GCUM(the sum of the cross-section area of every tree larger than the considered d-class)and each tree is only affected by competition from trees with larger diameters.In the present study,competition from trees with smaller diameters is also considered.However,it is possible that trees with smaller diameters are less competitive.The motivation for the new function used here is that competition for light,water and nutrients is obviously stronger from neighbouring trees than from trees further away.Furthermore,smaller trees use some of the available light,water and nutrients(Lohmander 2016).
Hence the aim of this study was to develop a basal area growth model for uneven-aged stands,considering the competition of neighbouring trees.
Materials and methods
Study area
This research was conducted in Nav district#3 at A salem forests,Guilan province in northern Iran. The altitude ranges from 450 to 2150 m;latitude is 37°41′20′′–37°35′40′′north,and longitude 48°48′00′′–48°42′0′′east(Fig.1).The total area of these forest districts is 3770 ha.Compartment#320 with latitude and longitude of 37°39′30′′–37°39′5′′north,48°45′57′′–48°45′30′′east was selected.This compartment has an area of 43 ha and minimum,average,and maximum altitudes are 1050,1120,and 1210 m,respectively.The general direction is north and slopes are 30.0–60.0%.In this district,forest types in the central part are beech(Fagus orientalis),hornbeam(Carpinus betulus)with Cappadocian maple(Acer cappadocicumGled.),and alder(Alnus subcordataC.A.Mey.)(Anonymous 2006).
According to studies by Amanzadeh(2015)in this compartment,three forest types,including hornbeam-beech,beech-hornbeam and mixed hardwoods were identified.His and in the same forest type (Schutz 2006). In each plot, variables such as total height (m), diameter at breast height (DBH)of all trees with diameters larger than 7.5 cm, distance of neighbouring tree (m) and the azimuth were measured. Based on the collected data, species numbers per hectare were calculated in each diameter class. Using the local tariff of Chooka (IranWood and Paper Industries) for healthy species (positive volume table of Chooka and number per hectare in each diameter class), the volume per hectare for each diameter class was determined (Bayat et al. 2014) (Table 1). A survey was carried out in order to find a natural forest without any harvesting activates, a so called untouched forest. Hence, a forest reserve area (compartment No 320, district No 3) in the Asalem region in watershed number 7 (Nav) west of the Hyrcanian forests was selected. In each plot, the number and volume per hectare was classified into three diameter classes: ≤ 30 cm, average (30–60 cm), and ≥ 60 cm (Table 2).Ten trees in each diameter class were selected per plot using random number tables. Thirty trees were then selected for the estimation of diameter increment. An increment borer was used to take samples from individual trees. The locations of all trees were specified using Arc GIS 9.3 software. In addition,neighbouring trees from the sample tree were determined within a 10-m radius.
Regression analysis for the three plots was performed using Excel software.Various model forms were applied to the data.For example,models(1),(2),and(3)were tested for their predictive ability(based onpvalue).

whereIiis the diameter increment of treei(cm),dithe diameter of tree i(cm),bcthe basal area of smaller and larger competing trees divided by 2(cm2),(all within the 10-m radius circle)andk0,k1,k2are parameter values that will be estimated using regression analysis(Lohmander 2016).

whereD(t)is the diameter of treeiat timet,c(i,t)the competition index of tree i at time t andk0,k1,k2,k3are parameter values that will be estimated using regression analysis.
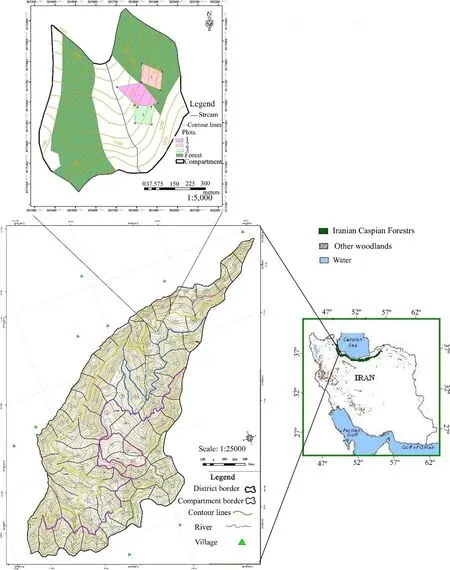
Fig.1 Study areas in the Asalem forest,Guilan province(compartment#320,district#3)

Table 1 Inventory results

Table 2 Classification of the number and volume per hectare of trees in studied plots into 3 diameter classes:≤30 cm,average(30–60 cm)and≥60 cm
Finally the most appropriate model for all three plots was selected using Eq.(3).

The basal area increment(cm2)is also affected by bcwhich is the basal area of smaller and larger competing trees divided by 2(cm2),(all within the 10-m radius circle)(Lohmander 2016).
Results
Regression analysis of Eq.(1)shows no significant relationship between dependent and independent variables at the 0.05 significance level(Table 3).
Regression analysis of Eq.(3)shows a significant relationship between bincandb0.5,b1.5,bcat the 0.05 R2=0.92 significance level.Estimated parameters of the regression model based on Eq.(3)are shown in Table 4.

Table 3 Estimated parameters of the regression model based on Eq.(1)
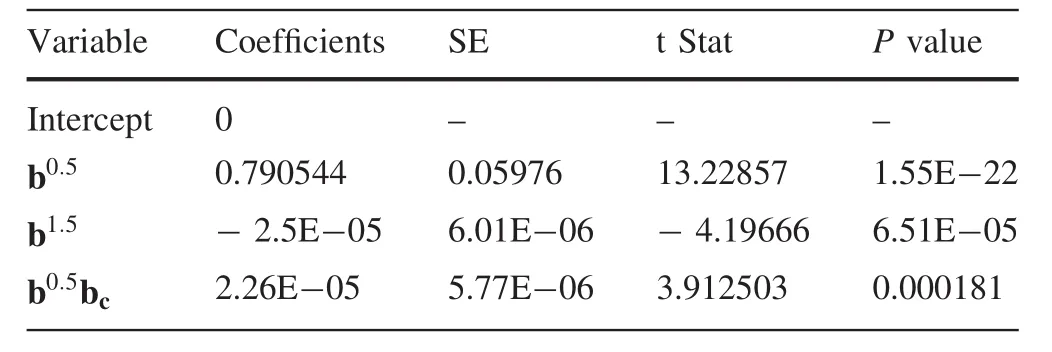
Table 4 Estimated parameters of the regression model including competition effects

The results show that bchas positive effects on growth(Table 4);Whenbc=0,the function shows the estimated(yin Fig.2)as a function of b(xin Fig.2).When b=0,growth is zero.Growth first increases with b then decreases,and finally reaches zero(Fig.2).
Results of regression analysis when the basal area of competing trees is zero showed that there is a significant relation between bincandb0.5,b1.5at the significance level ofThe estimated parameters of the regression model based on Eq.(5)are shown in Table 5.
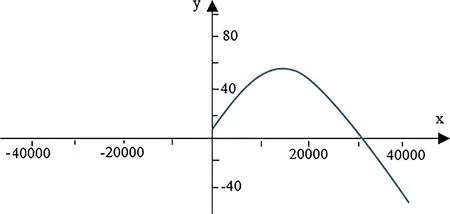
Fig.2 Basal area increment per year(y)as a function of basal area(x)when bc=0

Table 5 Estimated parameters of the regression model without including competition effects

After obtaining the parameters fitted to the combined data,residuals were analyzed with respect to all the variables in the model.The residual is the difference between the observed value of the dependent variable and the predicted value.A residual plot is a graph that shows the residuals on the vertical axis and the independent variable on the horizontal.The residuals were examined by plotting in various ways:(1)Plot of the residuals against predicted values is invaluable because it shows the deviation of the residual values about the reference line at 0;(2)Plot of the residuals against independent variables;and,(3)Plot a histogram of the residuals.If the points in a residual plot were randomly dispersed about the reference line at 0,then the model was appropriate for the data(Figs.3,5).Histograms of the residuals of the basal area increment model,including competition and without competition effects are shown in Fig.7.The elevation of the histogram of residual errors indicates that they are normally distributed.The predicted versus observed basal area increment for the three plots with respect to the basal area of competing trees is shown in Fig.4.The model between bincindices and independent variables performed well(R2=0.92)so the predicted bincclosely resembles the observed binc(Fig.4).When bc=0,the difference between observed and predicted values of basal area increment is shown in Fig.6.The elevation of residual errors shown in Figs.3 and 5 indicates that if competition from neighbouring trees is considered,the predicted model will be closer to the actual data(Figs.4,6).
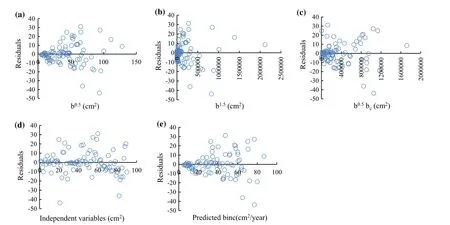
Fig.3 Residuals of the basal area increment model(Eq.(4))with respect to basal area 10 years ago(cm2)(a,b),basal area of competing trees(cm2)(c),independent variables(b0.5,b1.5,b0.5bc)(cm2)(d),predicted binc(cm2/year)values(e)

Fig.4 Observed and predicted basal area increment per year including competition effects
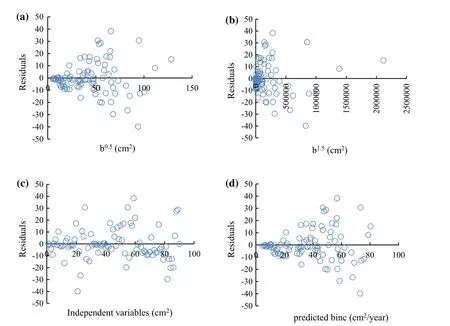
Fig.5 Residuals of basal area increment model(Eq.(5))with respect to basal area 10 years ago(cm2)(a,b)independent variables(b0.5,b1.5)(cm2)(c)and predicted bincvalues(cm2/year)(d)
Discussion
The purpose of this study was to develop basal area growth models for uneven-aged Caspian forests that would allow for the development and evaluation of growth functions to improve forest management planning.The results indicate that basal area of competing trees and basal area 10 years ago have positive effects on growth.The positive effect of bc(the basal area of smaller and larger competing trees divided by 2)on growth is unexpected.When competing trees are not considered,basal area increases,then decreases,and finally basal area’increment reaches zero(Fig.2).The developed model between bincindices and independent variables performed well(R2=0.92)so the predicted bincclosely resembles the observed binc.This indicates that the model can be applied in practice.
The result that increment is higher with more competing neighbouring trees is possibly because plots with higher volume per hectare and more competition most likely have higher site index values,or better soil,or better productivity conditions than plots with lower volumes per hectare.
The result that increment is higher with more competing neighbouring trees indicates that the forest productivity conditions are better in plot 1 than in plot 2 and even better than in plot 3.It may be difficult to determine the production conditions of the different plots with objective empirical methods(Fig.7).
In the function used in this new analysis,only competition from trees at distances of 10 m or closer is considered.The motivation for the new function is that competition for light,water and nutrients,is obviously stronger from neighbouring trees than from trees further away.Smaller trees also use some of the available light,water and nutrients(Lohmander 2016).
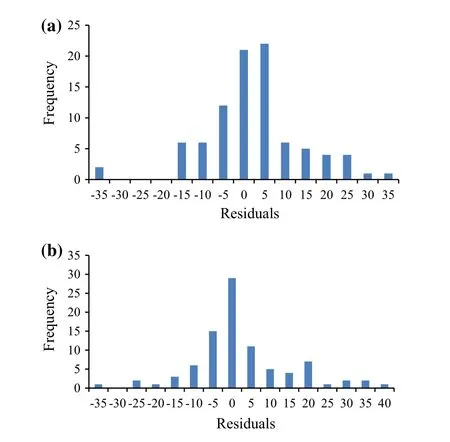
Fig.7 Histogram of the residuals of the basal area increment model including competition effects(a)and without competition effects(b)
Mölder and Leuschner(2009)analyzed tree ring chronologies of 152 beech(Fagus sylvaticaL.)trees from neighbourhoods varying in species composition and diversity in the broad-leaved forests of Hainich National Park,Germany.They examined the hypothesis that the species identity of the neighbouring trees and their functional traits can significantly influence radial stem increment and environmental sensitivity to growth of the target species while the species diversity of the neighbourhood is of little significance.The mean annual increment of beech did not decrease with an increase in Hegyi’s competition index(the relative diameter and distance between the subject and competitor tree reflects their competitive interaction)which measures crowding by trees in the neighbourhood.They found evidence for a significant influence of neighbouring species on beech growth:positive effects on mean increment and reduced ring series sensitivity were found for lime,ash and maple but not for oak.They concluded that the neighbourhood of a tree can significantly influence its mean stem increment and growth sensitivity to environmental fluctuations with the effect partially depending on the species of the neighbours.The results of their study were similar to the results of this study.The species of neighbouring trees is important.The flora of the Caspian forests is considered to be more diverse than that of much of Europe and is considered a hot spot of plant biodiversity(Marvi Mohadjer 2005).In fact,the growth of forest species is affected by environmental and internal factors.The most important internal factors are physiology,the nature of the species,age,genetic properties,and quality of maternal trees.The prominent environmental or external factors that affect the growth of trees are weather conditions,ground slope,geographical direction,soil types,absorbable elements of soil moisture,light,distance between trees,growth of neighbouring trees,position of tree,and habitat index(Marvi Mohadjer 2005).It seems that the other effective factors on growth compared to the competition of neighbouring trees were more important in this research.The Caspian forests of northern Iran are temperate deciduous forests.Growth in these forests is widely affected by global climate changes(Oladi and Pourtahmasi 2012)and environmental factors such as soil fertility,proportionate precipitation,and high humidity(Hosseini 2010).Yang et al.(2005)estimated the effects of site factors and climate change on forest growth in the Taihang Mountains,northern China,and the factors influencing growth assessed using inventory data from 712 sample plots.The results showed that temperature and precipitation are major factors influencing forest growth.On the other hand,according to a study by Cannell et al.(1984),competition amongst trees can be one-sided or two sided.In one-sided competition,larger trees are at a competitive advantage over smaller trees but do not affect the growth of larger trees.Light,rather than other environmental resources,is the limiting resource and competition for light is expressed as the primary cause of size inequality and self-thinning in crowded populations.
The basal area of larger trees is a useful predictor and is commonly used to capture one-sided competition in modeling tree growth(Wykoff 1990).It seems that simultaneous increase in growth and increase in competition represents a one-sided relationship between trees in the region.After conducting the survey,it was found that the majority of neighbouring trees were in lower diameter classes compared to the study tree.Coomes and Allen(2007)explored the factors regulating diameter growth of 3334 trees of mountain beech(Nothofagus solandrivar.cliffortioides)growing in natural single-species stands in New Zealand.Maximum-likelihood modelling was used to quantify the influence of tree size,altitude,basal area of taller neighbours and basal area of all neighbours on growth.They used neighbourhood modelling to explore the ways in which competition for light and nutrients varied with tree size.The basal areas of larger neighbours is often regarded as defining the effect of competition for light because only taller neighbours are able to intercept light before it reaches the focal tree.The basal area of neighbours described the effect of below-ground competition because nutrient-uptake by a plant depends upon the extent to which the fine roots of neighbouring plants have depleted the pool of available nutrients,and the roots of all neighbours compete for resources,not just the taller neighbours.
The results showed that growth of mountain beech trees was significantly correlated with tree size.The regression analyses suggested that competition for both light and nutrients suppressed the growth of trees in mountain beech forests.Tall trees have few taller neighbours.The results of this study were in line with the results of our study.Regarding growth,the examination of the basal area of neighbouring trees is not decisive on its own.Furthermore,Stadt et al.(2007)estimated the growth model using basal area of competing trees,the competitor number,species,number,plot area,crown radius of the competitor,distance from the competitor to the subject tree,height,and crown length in natural boreal mixed forests.The results showed that the flexible,distance-dependent crowding index was superior to other indices,but that a simple index such as competitor basal area was also quite effective.Basal area provided similar fits to many other distance-dependent and independent indices using size ratios or more derived values such as overtopping crown cover.
Conclusion
Estimations of the growth of individual trees in the Caspian forests of Iran considering competition have not been done before.The growth of an individual tree is affected by several internal and external factors.Hence,in future studies,we recommend that such factors be used when growth models are estimated.The estimated growth equations will be even more reliable as components in forest management optimization applications.For example,site index is an important factor that influences growth.Unfortunately,there are presently no site index studies for the Iranian Caspian forest.If such site index information had been available,we could have used this to get more exact results.We hope to estimate such site index-based growth models in the future.The results of this research can be used in forest management to examine silvicultural and harvesting options,to determine optimal stocking under different management strategies,and to calculate the net present value of wood and other forest services like carbon sequestration.The growth model also has a broader role in regional forest management and in the formulation of forest policy.
 Journal of Forestry Research2018年5期
- Journal of Forestry Research的其它文章
- Environmental load of solid wood floor production from larch grown at different planting densities based on a life cycle assessment
- An overview of proven Climate Change Vulnerability Assessment tools for forests and forest-dependent communities across the globe:a literature analysis
- Assessing the vulnerability of a forest ecosystem to climate change and variability in the western Mediterranean sub-region of Turkey:future evaluation
- Effects of management regimes on carbon sequestration under the Natural Forest Protection Program in northeast China
- Mixed-effects modeling for tree height prediction models of Oriental beech in the Hyrcanian forests
- Comparable water use of two contrasting riparian forests in the lower Heihe River basin,Northwest China
