Modeling and optimization of industrial Fischer-Tropsch synthesis with the slurry bubble column reactor and iron-based catalyst☆
Chufu Li
National Institute of Clean-and-Low-Carbon Energy,Shenhua Group Co.Ltd.,Beijing 102211,China
1.Introduction
Fischer-Tropsch(FT)synthetic fuels have very beneficial properties,such as low sulfur content and near-zero aromatics,which make them good candidates as alternative and/or complementary sources of fuel.FT synthetic fuels can be produced from coal or natural gas.Two types of catalysts are commercially used in FT synthesis,namely iron-based(Fe)and cobalt-based(Co)catalysts.Iron catalyst is cheaper and has a higher water gas shift(WGS)activity,and therefore it is best suited for CO rich syngas produced from coal gasification.Three types of FT reactors are in commercial use at present time:they are fixed bed reactor, fluidized bed reactor and slurry phase reactor[1].Slurry bubble column reactor(SBCR)possesses many advantages such as better heat&mass transfer,lower manufacture costand higher yield of single set.Therefore,it is an active research area for a lot of researchers in modeling,scale-up and optimization of the SBCR for FT synthesis.
Industrial scale SBCR(diameter 5-10 m,height 30-50 m)was simulated and investigated using the SBCR model by the researchers[2-10].Recent work on the intensification of the Sasol SPD(Slurry Phase Distillate)reactor presented by Sasol[9]shows that the scope exists to potentially double the volumetric conversion of Sasol's existing G1 commercial slurry phase reactors through the relative increases in gas velocity and catalyst concentration.Sehabiague[10]used the double bubble SBCR model to assess the performance of an industrial SBCR for FT synthesis,and predicted and optimized the performance of an industrial scale(ID-5.8 m SBCR)operating with iron-based catalyst for FT synthesis,with emphasis on catalyst deactivation.
In previous works,most researchers investigated and optimized the SBCR performance using their reactor models at a fixed inlet gas composition to the SBCR.However,in the industrial FT synthesis process,due to the single pass conversion not too high,a lot of tail gas will be returned to the SBCR.It will change the inlet gas composition when the reaction performance changes.Therefore,the optimal results obtained at fixed inlet gas composition to the SBCR may not be reasonable.To solve this problem,a process model integrated with a SBCR model for FT synthesis should be used.This work developed a comprehensive process model for FT synthesis that includes a detailed SBCR model,gas liquid separation model,simplified CO2removal model and tail gas cycle model,and used the model to investigate and optimize the performances of an industrial FT synthesis process with the SBCR and iron-based catalyst.
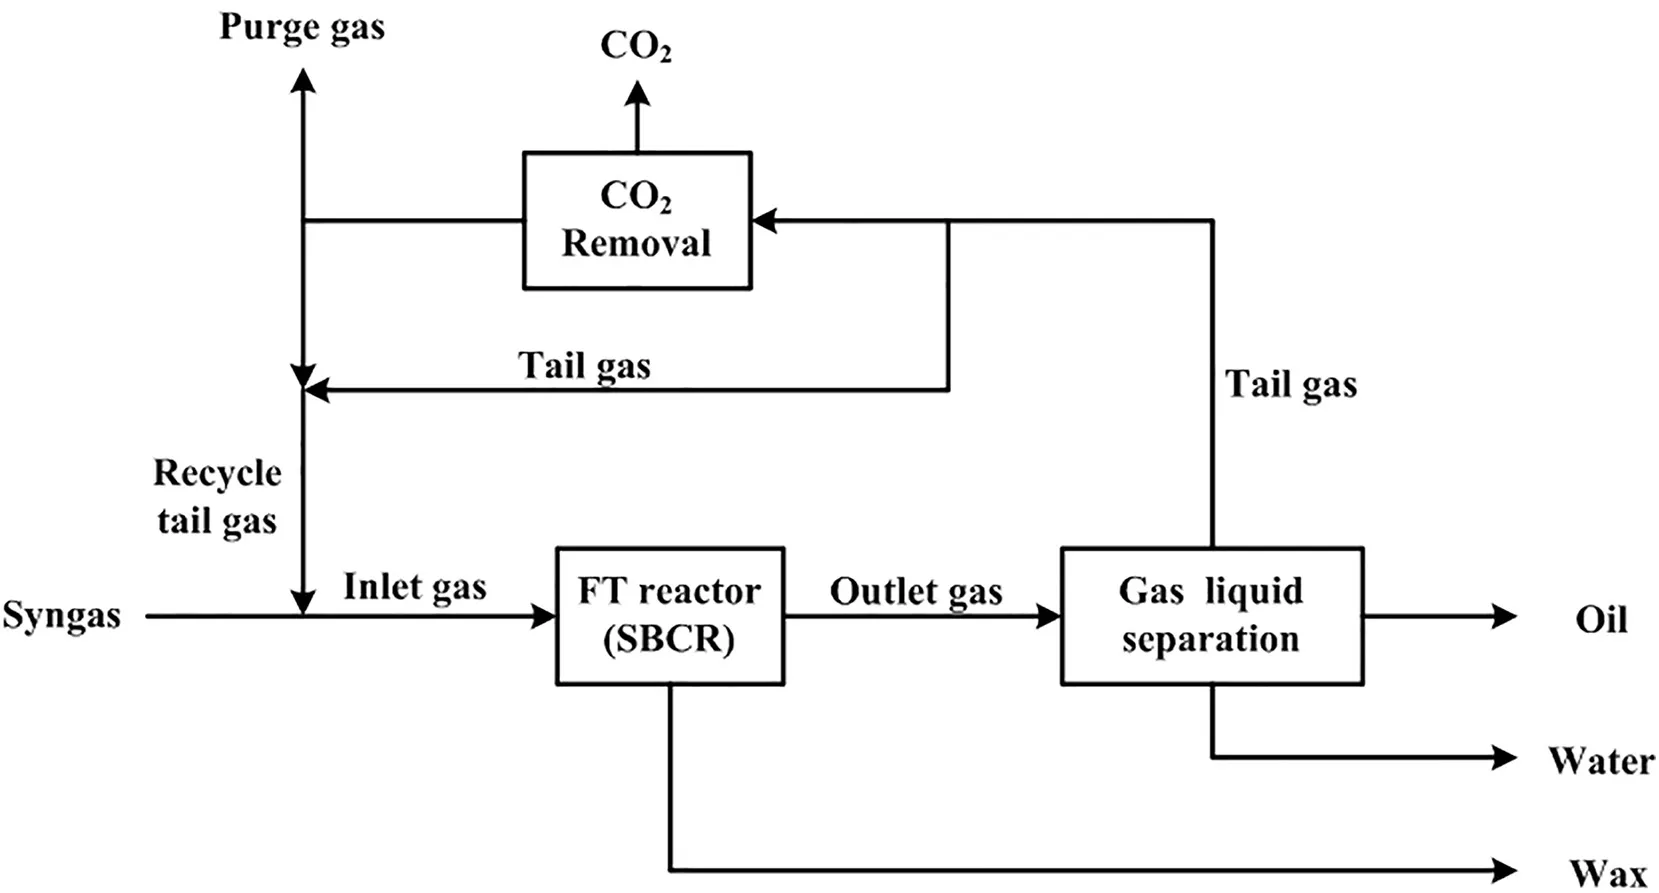
Fig.1.Schematic graph for the FT synthesis process with the SBCR and iron-based catalyst.
2.Process Description of FT synthesis
A typical FT synthesis with the iron-based catalyst includes FT synthesis reaction,gas liquid separation,CO2removal and tail gas cycle,as shown in Fig.1.Syngas(CO+H2)is mixed with the recycled tail gas to feed into the FT reactor(SBCR).Under the reaction conditions(230-280°C,2-4 MPa)and with the presence of the iron-based catalysts,most CO is converted into hydrocarbon,and small amount of CO is converted into CO2.The reaction tail gas is then cooled and fed into the gas liquid separator,and oil and water are separated from the tail gas.Because the single pass conversion in the FT reactor is not too high,a lot of tail gas(about 1-3 times of syngas flowrate)will be recycled into the FT reactor.To control the CO2content of the inlet gas to the reactor,part of the tail gas(about 10%-30%of total tail gas)needs to remove CO2before recycling into the FT reactor,and the rest of the tail gas is directly recycled into the FT reactor.In addition,some tail gas is released to control the reaction pressure.
3.Mathematical Model for FT Synthesis Process
The comprehensive mathematical model for FT synthesis process mainly includes:a detailed SBCR model,a gas liquid separation model,a simplified CO2removal model and a tail gas cycle model.
3.1.SBCR model
Modeling research work on the SBCR for FT synthesis began from 1950s[11].According to bubble characters,the models were divided into homogeneous state consisting of single bubble and heterogeneous state consisting of two-class or multi-class bubbles[12],and the most models are zero dimension and one dimension.Zero dimension models,which do not consider axial and radial direction,can only predict the varied trend of the parameters[13-16]and the typical physical phenomena such as jump change of gas holdup[17,18].Typical one dimension model includes single bubble model[19-21],double bubble model[2,4,5,22-25]and multi-stage series CSTR model[26,27].Deckweret al.[19],Sternet al.[20],and Saxenaet al.[21]proposed the single bubble model and Van der Laanet al.[2],Marettoet al.[22],De Swartet al.[23],Radoset al.[24],Sehabiagueet al.[4],and Wanget al.[5]proposed and improved the double bubble model.These models above were used for the design of the large scale SBCR.Ghasemi and Sohrabi[25]compared the single bubble model with the double bubble model,and the results show that increasing reactor diameter and decreasing solid concentration both lead to major impact,while bubble breakup and coalescence minimize their difference.
The objective of this work is to develop a process model for industrial FT synthesis with the SBCR and optimize its performance,and one dimension SBCR model is adopted here,which includes material balance equations,hydrodynamic and mass transfer correlations,FT and WGS reaction kinetic equations and hydrocarbon distribution model.
3.1.1.Material balance equations
The SBCR model is essentially based on the axial dispersion model in conjunction with the two-class of gas bubble model[4,10].The catalyst particle suspension was modeled using the Sedimentation-Dispersion model.The following key assumptions were considered:(1)the mass transfer resistances in the gas-film and in the liquid-solid film are negligible and(2)the slurry temperature is constant.According to these assumptions and model features,the mass balances of each component in the different phases over a differential element of the reactor can be derived as shown in Table 1;and the boundary conditions for solving these equations are given in Table 2.

Table 1 Material balance equations[10]
3.1.2.Hydrodynamic and mass transfer coefficient correlations
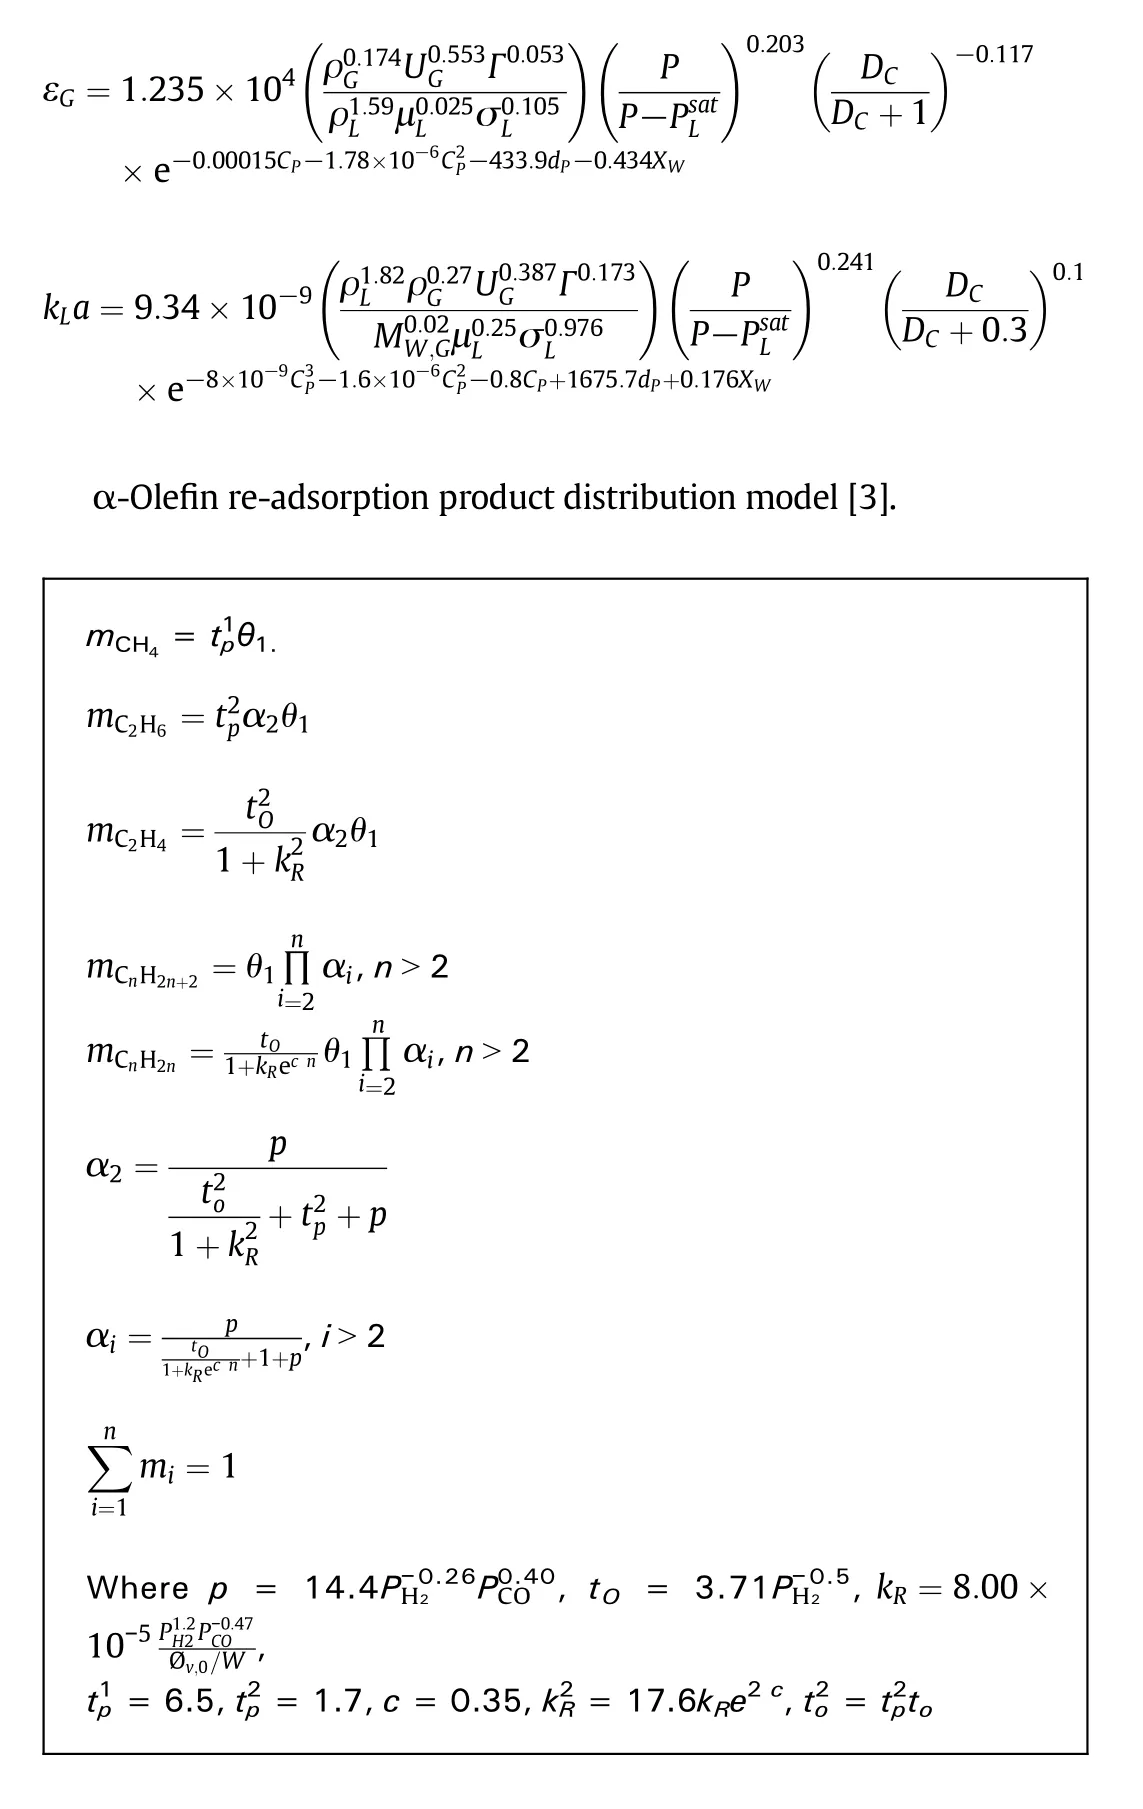
The hydrodynamic parameters are quite important for scale-up and optimization on the SBCR.Sehabiague and Morsi[10,13,14]have done lots of works on this area at actual FT synthesis conditions.Thehydrodynamic and mass transfer coefficient correlations in the latest literature published by Sehabiague[10]were adopted in this work(Appendix),which have the best prediction accuracy for gas the holdup and mass transfer coefficient.

Table 2 Boundary conditions[10]
3.1.3.Reaction kinetic equations
The reaction kinetic equations were developed specially for the iron-based catalyst used in the industrial demonstration reactor,shown as in Table 3.

Table 3 FT iron-based catalyst kinetic used in the model
3.1.4.Hydrocarbon distribution model
In the FT synthesis,the product yield decreases exponentially with increasing chain length.The so-called Anderson-Schulz-Flory(ASF)distribution describes the entire product range by a single parameter α,the probability of the addition of a carbon intermediate to a chain[28,29].However,significant deviations from the ASF distribution were reported in literature.The usual deviations of the distribution of α-olefins and paraffins are a relatively high yield of methane[30-32]and a relatively low yield of ethene[30,31,33]in comparison to the ASF distribution.Some authors described the total hydrocarbon yield with two different catalytic sites with different chain growth probabilities,since the total hydrocarbon distribution could be fitted by addition of two individual ASF distributions[34,35].However,such doublemodels cannot explain the decrease of the olefin to paraffin ratio.The hydrocarbon product distribution is calculated by the α-olefin readsorption model proposed by Van der Laan[3].Some parameters of the α-olefin re-adsorption product distribution model were revised according to the industrial demonstration run data,shown as in Table 4.

Table 4 Parameters value for α-olefin re-adsorption product distribution model
3.1.5.Physical properties andflash calculations
The physical properties(density,viscosity,surface tension and saturated vapor pressure)of the wax produced from the industrial demonstration reactor were measured with experiments close to the actual reaction temperature[10],and the physical properties of the wax at 528 K are:density 693 kg m-3,viscosity 0.0015 Pa s,surface tension 0.017 N m-1and saturated vapor pressure 5685 Pa.
Henry constants for CO,CO2,H2,H2O,N2and light hydrocarbons(C1-C3)were obtained from Marano-and Holder[36].The multicomponent VLE model of Marano and Holder[36]was applied.However,ideal gas behavior of the gas phase is assumed because under the reaction conditions applied,the fugacity coefficients(up to C30)as calculated with the Peng-Robinson equation of state are between 0.95 and 1.01[3].The equilibrium constants between vapor and liquid for nonhydrocarbons and C1-3hydrocarbons were calculated from:

For the other hydrocarbons,theK-value is given by:

A flash calculation using theseK-values gives the final composition of the liquid and gas phase outlet of the SBCR:

3.2.Gas-liquid separation model
In the gas liquid separation unit,the reaction tail gas is cooled to about 35°C,and almost all C5+and water are condensed.Then the gas liquid mixture is fed into a separator to separate oil and water from the tail gas.The equilibrium constants between vapor and liquid oil for non-hydrocarbons and hydrocarbons were calculated from Eqs.(3)and(4),and the equilibrium constants between vapor and liquid water for non-hydrocarbons and light hydrocarbons can be calculated by the Henry coefficients in the water.A flash calculation using theseK-values gives the final composition of the liquid and gas phase outlet of the separator:

3.3.CO2 removal model
In the industrial FT synthesis process with the iron-based catalyst,the hot potassium carbonate method is preferred to remove CO2.Hot potassium carbonate solution(about 80°C,20 wt%-35 wt%)is fed into the top of the scrubber,and counters current contact with the tail gas and absorbs CO2.A simplified model was used for CO2removal unit.CO2concentration in the tail gas is controlled to a constant value from the CO2removal unit,and the loss of other components(CO,H2,N2,C1-4)were estimated by the Henry coefficients in water.

3.4.Tail gas cycle model
The recycle tail gas is usually given a proportion of the syngas flowrate,shown as follows.

3.5.Algorithm for the model
The presented mathematical model is complex due to the tail gas cycle.An effective iteration algorithm was proposed to solve this model,as shown in Fig.2.
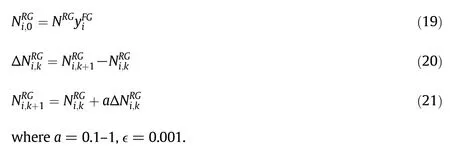
In the iteration process,the initial value and step are shown as Eqs.(19)-(21).
4.Industrial Demonstration Experiment and Simulation Results
The model and algorithm were verified by the experiment data from Shenhua FT industrial demonstration unit in Erdos(SBCR with 5.8 m diameter and 30 m height).
4.1.Process description of the industrial demonstration unit
The schematic process flow sheet diagraph of the industrial demonstration unit is shown as Fig.3.Syngas(CO+H2)is mixed with the recycled tail gas to feed into the FT reactor(SBCR with 5.8 m diameter and 30 m height),and occurs FT synthesis reaction at 255°C and 2.8 MPa.The reaction tail gas exchanges heat with the recycled tail gas,and then it is cooled to about35°C and fed into gas liquid separator.In the gas liquid separator,the liquid(oil and water)are separated from the tail gas.Some reaction tail gas is directly recycled into the FT reactor,and other tail gas needs to remove CO2before recycling into the reactor to control the CO2content of the cycled tail gas.In the CO2removal unit,hot potassium carbonate solution(about 80°C,30 wt%)is used to absorb CO2from the tail gas,and CO2mole content of the tail gas is controlled to about 2%from this unit.In addition,some tail gas is released to control the reaction pressure.

Fig.2.Algorithm for the process model for FT synthesis.
4.2.Experiment and simulation results
For the industrial demonstration unit,the syngas produced by Shell gasifier is used,and the composition of the syngas is shown as Table 5 and main operation conditions are listed in Table 6.
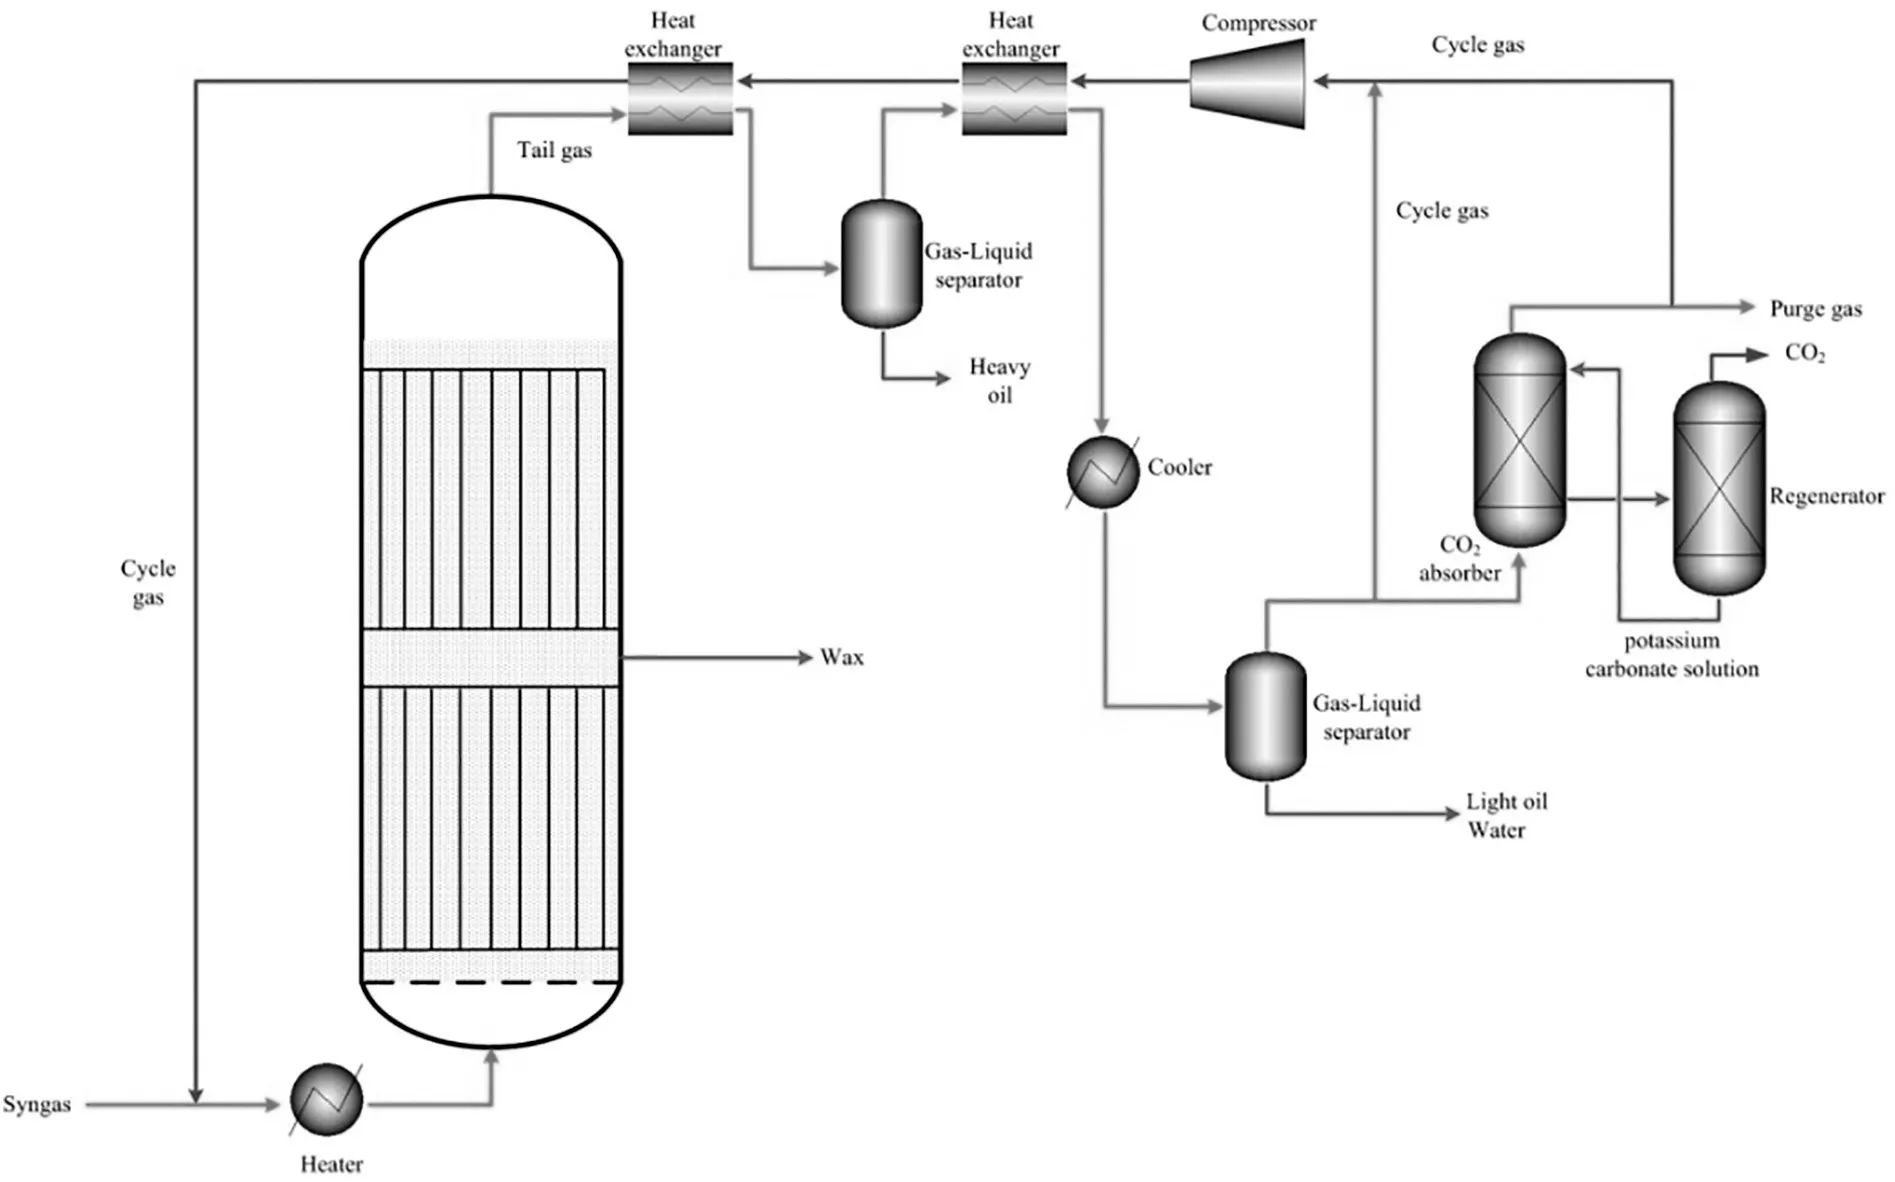
Fig.3.Schematic graph for Shenhua FT industrial demonstration unit.

Table 5 Composition of syngas

Table 6 Operation conditions for the industrial demonstration unit
The experiment and simulation results for the performance of the industrial demonstration unit are shown as Table 7 and Table 8.The maximum relative error of predicting CO total conversion,CO single pass conversion,CO2selectivity,CH4selectivity and C5+yield is<10%.The experiment and simulation results for mole fraction of inlet gas to FT reactor are listed in Table 8,with a maximum relative error<10%for main components.In the inlet gas to reactor,the inert gas(N2)content exceeds 20%due to tail gas cycle,which limits the reactor performance.The original parameter values for α-olefin re-adsorption product distribution model were also used to compare the simulation results with the revised parameter values in this work.The simulation results with the original parameter values for α-olefin re-adsorption product distribution model show the larger relative errors for the CH4selectivity(218.8%)and C5+yield(-37.9%)(seeing Table 7).
4.3.Algorithm investigation
To investigate the performance of the algorithm to the model,different values of step parameter(a)were selected to solve the model,and the iteration numbers required are presented in Fig.4.The results show that iteration number will decrease as the step parameter increases,especially whena<0.5.However,the larger the step parameter,the lower the stability of the algorithm;a larger step parameter easily makes the algorithm not convergent.Thus,a=0.5 is preferred in the algorithm.

Table 7 SBCR performances in the industrial demonstration unit

Table 8 Experiment and simulation results for mole fraction of the inlet gas to the SBCR

Fig.4.Iteration number changes as the step parameter of iteration algorithm(ϵ=0.001).
5.Optimization Results on the SBCR Performance
For the industrial demonstration unit,syngas flowrate(120,000 Nm3·h-1),recycle ratio(1.75),reaction temperature(255°C)and reaction pressure(2.8 MPa)are almost constant due to the designed coal gasifier,cycle gas compressor and SBCR.However,the H2/CO of syngas and catalyst loading could be adjusted and optimized to obtain maximum productivity for the SBCR.
The effect of catalyst loading on the SBCR performances was investigated at different H2/CO value of syngas.Fig.5 shows that C5+yield increases as catalyst loading increases within 10-70 ton and syngas H2/CO value decreases within 1.3-1.6.However,it is noted that the C5+yield doesn't increase obviously as catalyst loading increases when the catalyst loading exceeds 45 ton(about15 wt%concentration).Although higher catalyst loading will increase C5+yield,it will result in higher difficulty forwax/catalyst separation and higher catalystcost.Therefore,the catalyst loading(45 ton)is recommended for the industrial demonstration unit operation at syngas H2/CO=1.3,and C5+yield is about 402 t/d for the case,which has an about 16%increase than the industrial demonstration run results.
6.Conclusions
This work developed a comprehensive process model for FT synthesis that includes a detailed SBCR model,gas liquid separation model,simplified CO2removal model and tail gas cycle model.The SBCR model is a one dimension double bubble model that consists of mass balance equations of multi-components in the large bubble,small bubble and liquid,FT and WGS kinetic equations,α-olefin re-adsorption product distribution model and hydrodynamic correlations.Subsequently,an effective iteration algorithm was proposed to solve this process model.The model was validated by the industrial demonstration experiments(SBCR with 5.8 m diameter and 30 m height)data,and the maximum relative error of predicting CO total conversion,CO single pass conversion,CH4selectivity,CO2selectivity,space time yield and main component contents is less than 10%.
Finally,the proposed model was adopted to optimize the performance of the industrial demonstration SBCR simultaneously considering process and reactor parameters variations.The results show that C5+yield increases as catalyst loading increases within 10-70 ton and syngas H2/CO value decreases within 1.3-1.6,but the C5+yield doesn't increase obviously as catalyst loading increases when the catalyst loading exceeds 45 ton(about 15 wt%concentration).Although higher catalyst loading will increase C5+yield,it will result in higher difficulty for wax/catalyst separation and higher catalyst cost.Therefore,the catalyst loading(45 ton)is recommended for the industrial demonstration unit operation at syngas H2/CO=1.3,and the C5+yield is about 402 t·d-1,which has an about 16%increase than the industrial demonstration run results.
For a new FT synthesis unit in design,the model developed in this work could be used better for simultaneously optimizing SCBR parameters and process parameters(i.e.reactor diameter and height,syngas flowrate and H2/CO value,recycle ratio,catalyst loading)to obtain maximum productivity.
Nomenclature
AReactor area,m2
CConcentration,mol·m-3
CPSolid concentration in slurry phase,kg m-3
CWSolid mass concentration,wt%
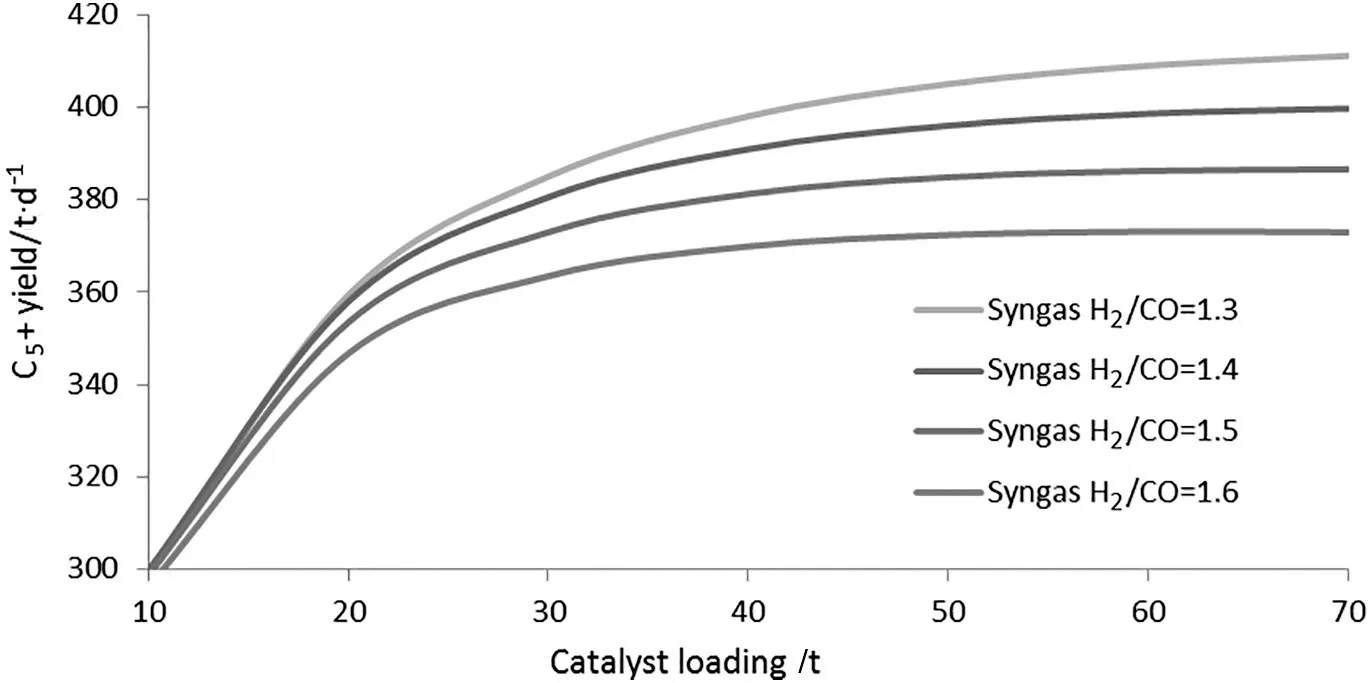
Fig.5.Effect of catalyst loading on the SBCR productivity at different H2/CO value of syngas(Syngas flowrate 120,000 Nm3·h-1,recycle ratio 1.75,reaction temperature 255 °C,reaction pressure 2.8 MPa).
DDiffusion coefficient,m2·s-1
DRDiameter of reactor,m
HReactor height,m
H∞Henry constant at infinite dilution
KGas liquid equilibrium constants
KTPseudo kinetic constant
KPReaction equilibrium constant
kLaVolumetric mass transfer coefficient,s-1
kLLiquid mass transfer coefficient,s-1·m-2
mMolar selectivity
MWMolar weight,kg·kmol-1
NMolar flowrate,mol·s-1
PPressure,MPa
PsatSaturated vapor pressure,MPa
rReaction rate,mol·(kgcat)-1·s-1
RGas constant,8.31 J·mol-1·K-1
TTemperature,K
USuperficial velocity,m·s-1
VRReactor volume,m3
WCatalyst weight,kg
XWweight fraction of the primary liquid in the mixture(0.5≤XW≤1.0)(w/w)
xMolar fraction in liquid phase
yMolar fraction in gas phase
β Proportion of tail gas to CO2removal unit
δ Loss ratio in the CO2removal unit
ρ Density,kg·m-3
μ Viscosity,10-3Pa·s
σ Surface tension,N·m-1
ϵTolerance of relative error
ε Volumetric fraction
ε Average volumetric fraction
ν Stoichiometric coefficient
λ Recycle ratio
γ∞Activity coefficient at infinite dilution
ξ Opening ratio of sparger,%
ØPoynting factor
Øv,0Flow rate at normal conditions,m3·h-1
Γ Gas distributor parameter
Superscripts
SBSmall bubble
LBLarge bubble
oil Liquid oil
water Liquid water
IN Inlet gas to reactor
OUT Outlet gas from reactor
TGTail gas from gas liquid separator
RGRecycle tail gas to reactor
FGFeed syngas
RTGTail gas after CO2removal
DTGDirectly recycle tail gas
PGPurge gas
Subscripts
GGas phase
iSpecies
jReaction
LLiquid phase
pParticle
SSolid phase
SLSlurry phase
Appendix A
Hydrodynamic and mass transfer coefficient correlations[10]
[1]A.Steynberg,M.Dry,Fischer-Tropsch technology,Stud.Surf.Sci.Catal.152(2004).
[2]G.P.Van der Laan,A.A.C.M.Beenackers,R.Krishna,Multicomponent reaction engineering model for Fe-catalyzed Fischer-Tropsch synthesis in commercial scale slurry bubble column reactors,Chem.Eng.Sci.54(21)(1999)5013-5019.
[3]G.P.Van der Laan,Kinetics,Selectivity and Scale Up of the Fischer-Tropsch Synthesis,University of Groningen,Netherlands,1999.
[4]L.Sehabiague,R.Lemoine,A.Behkish,Y.J.Heintz,M.Sanoja,R.Oukaci,B.Morsi,Modeling and optimization of a large-scale slurry bubble column reactor for producing 10,000 bbl/day of Fischer-Tropsch liquid hydrocarbons,J.Chin.Inst.Chem.Eng.39(2)(2008)169-179.
[5]Y.Wang,W.Fan,Y.Liu,Z.Zeng,X.Hao,M.Chang,C.Zhang,Y.Xu,H.Xiang,Y.Li,Modeling of the Fischer-Tropsch synthesis in slurry bubble column reactors,Chem.Eng.Process.Process Intensif.47(2)(2008)222-228.
[6]G.L.Blanco,J.W.Thybaut,K.Surla,et al.,Simulation of a slurry-bubble column reactor for Fischer-Tropsch synthesis using single-event microkinetics,AICHE J.55(8)(2009)2159-2170.
[7]L.Sehabiague,Modeling,“scale up and optimization of slurry bubble column reactors for Fischer-Tropsch synthesis”,Ph D Thesis,University of Pittsburgh,Pittsburgh,2012.
[8]L.Sehabiague,B.Morsi,Modeling and simulation of a Fischer-Tropsch slurry bubble column reactor using different kinetic rate expressions for iron and cobalt catalysts,Int.J.Chem.React.Eng.11(2)(2013)2-30.
[9]A.P.Vogel,H.G.Nel,J.A.Stadler,et al.,Intensifcation of the Sasol SPD reactor-realizing potential,Ind.Eng.Chem.Res.53(2014)1768-1774.
[10]L.Sehabiague,O.M.Basha,Y.Hong,B.Morsi,et al.,Assessing the performance of an industrial SBCR for Fischer-Tropsch synthesis:experimental and modeling,AICHE J.61(11)(2015)3838-3857.
[11]Y.Cheng,F.Wei,Y.Jin,Multiphase reactor engineering for clean and low-carbon energy application,John Wiley&Sons,Inc.,2017 219-270.
[12]S.Hans,Short history and present trends of Fischer-Tropsch synthesis,Appl.Catal.A Gen.186(1-2)(1999)3-12.
[13]A.Behkish,R.Lemoine,R.Oukaci,B.I.Morsi,Novel correlations for gas holdup in large-scale slurry bubble column reactors operating under elevated pressures and temperatures,Chem.Eng.J.115(3)(2006)157-171.
[14]R.Lemoine,A.Behkish,L.Sehabiague,Y.J.Heintz,R.Oukaci,B.I.Morsi,An algorithm for predicting the hydrodynamic and mass transfer parameters in bubble column and slurry bubble column reactors,Fuel Process.Technol.89(4)(2008)322-343.
[15]M.Liu,J.Li,M.Kwauk,Application of the energy-minimization multi-scale method to gas-liquid-solid fluidized beds,Chem.Eng.Sci.56(24)(2001)6805-6812.
[16]G.Jin,Multi-scale modeling of gas-liquid-solid three-phase fluidized beds using the EMMS method,Chem.Eng.J.117(1)(2006)1-11.
[17]N.Yang,J.Chen,H.Zhao,W.Ge,J.Li,Explorations on the multi-scale flow structure and stability condition in bubble columns,Chem.Eng.Sci.62(24)(2007)6978-6991.
[18]J.Chen,N.Yang,W.Ge,J.Li,Modeling of regime transition in bubble columns with stability condition,Ind.Eng.Chem.Res.48(1)(2008)290-301.
[19]W.D.Deckwer,Y.Serpemen,M.Ralek,B.Schmidt,Modeling the Fischer-Tropsch synthesis in the slurry phase,nd.Eng.Chem.Process Des.Dev.21(2)(1982)231-241.
[20]D.Stern,A.T.Bell,H.Heinemann,Effects of mass transfer on the performance of slurry reactors used for Fischer-Tropsch synthesis,Chem.Eng.Sci.38(4)(1983)597-605.
[21]S.C.Saxena,M.Rosen,D.N.Smith,J.A.Ruether,Mathematical modeling of Fischer-Tropsch slurry bubble column reactors,Chem.Eng.Commun.40(1-6)(1986)97-151.
[22]C.Maretto,R.Krishna,Modelling of a bubble column slurry reactor for Fischer-Tropsch synthesis,Catal.Today52(2-3)(1999)279-289.
[23]J.W.A.De Swart,R.Krishna,Simulation of the transientand steady state behaviour of a bubble column slurry reactor for Fischer-Tropsch synthesis,Chem.Eng.Process.Process Intensif.41(1)(2002)35-47.
[24]N.Rados,M.H.Al-Dahhan,M.P.Dudukovic,Modeling of the Fischer-Tropsch synthesis in slurry bubble column reactors,Catal.Today79-80(0)(2003)211-218.
[25]S.Ghasemi,M.Sohrabi,M.Rahmani,A comparison between two kinds of hydrodynamic models in bubble column slurry reactor during Fischer-Tropsch synthesis:single-bubble class and two-bubble class,Chem.Eng.Res.Des.87(12)(2009)1582-1588.
[26]G.Wang,Y.-N.Wang,J.Yang,Y.-Y.Xu,L.Bai,H.-W.Xiang,Y.-W.Li,Modeling analysis of the Fischer-Tropsch synthesis in a stirred-tank slurry reactor,Ind.Eng.Chem.Res.43(10)(2004)2330-2336.
[27]C.Maretto,R.Krishna,Design and optimisation of a multi-stage bubble column slurry reactor for Fischer-Tropsch synthesis,Catal.Today66(2-4)(2001)241-248.
[28]R.B.Anderson,Catalysts for the Fischer-Tropsch Synthesis,vol.4,Van Nostrand Reinhold,New York,1956.
[29]L.S.Glebov,G.A.Kliger,The molecular weight distribution of the products of the Fischer-Tropsch synthesis,Russ.Chem.Rev.63(1994)185-194.
[30]B.W.Wojciechowski,The kinetics of the Fischer Tropsch synthesis,Catal.Rev.Sci.Eng.30(1988)629-702.
[31]T.Komaya,A.T.Bell,Estimates of rate coefficients for elementary processes occurring during Fischer-Tropsch synthesis over Ru/TiO2,J.Catal.146(1994)237-248.
[32]E.W.Kuipers,C.Scheper,J.H.Wilson,H.Oosterbeek,Non-ASF product distributions due to secondary reactions during Fischer-Tropsch synthesis,J.Catal.158(1996)288-300.
[33]S.Novak,R.J.Madon,H.Suhl,Models of hydrocarbon product distributions in Fischer-Tropsch synthesis,J.Chem.Phys.74(1981)6083-6091.
[34]T.J.Donnelly,I.C.Yates,C.N.Satter field,Analysis and prediction of product distributions of the Fischer-Tropsch synthesis,Energy Fuel2(1988)734-739.
[35]T.J.Donnelly,C.N.Satter field,Product distributions of the Fischer-Tropsch synthesis on precipitated iron catalysts,Appl.Catal.A52(1989)93-114.
[36]J.J.Marano,G.D.Holder,Characterization of Fischer-Tropsch liquids for vapor-liquid equilibria calculations,Fluid Phase Equilib.138(1997)1-21.
 Chinese Journal of Chemical Engineering2018年5期
- Chinese Journal of Chemical Engineering的其它文章
- Bioregeneration of spent activated carbon:Review of key factors and recent mathematical models of kinetics
- CFD simulations of quenching process for partial oxidation of methane:Comparison of jet-in-cross- flow and impinging flow configurations☆
- Quantifying growth and breakage of agglomerates in fluid-particle flow using discrete particle method☆
- Coupling simulation of fluid structure interaction in the stirred vessel with a pitched blade turbine☆
- An integrated model for predicting the flame propagation in crimped ribbon flame arresters☆
- Assessment of k-ε models using tetrahedral grids to describe the turbulent flow field of a PBT impeller and validation through the PIV technique
