Assessment of k-ε models using tetrahedral grids to describe the turbulent flow field of a PBT impeller and validation through the PIV technique
Víctor X.Mendoza-Escamilla ,Alejandro Alonzo-García ,Helvio R.Mollinedo ,Israel González-Neria ,J.Antonio Yáñez-Varela ,Sergio A.Martinez-Delgadillo ,*
1 Depto.Electrónica,Universidad Autónoma Metropolitana Azcapotzalco,Av.San Pablo 180,Azcapotzalco CP 07740,México D.F.,Mexico
2 CONACyT-Centro de Ingeniería y Desarrollo Industrial,Av.Playa Pie de la Cuesta 702,Desarrollo San Pablo,76125 Querétaro,Qro.,Mexico
3 UPIITA,Instituto Politécnico Nacional,Av.IPN 2580,G.A.Madero CP 07340,México D.F.,Mexico
4 Depto.Ciencias Básicas,Universidad Autónoma Metropolitana Azcapotzalco,Av.San Pablo 180,Azcapotzalco CP 07740,México D.F.,Mexico
1.Introduction
Mixing in stirred tank reactors(STR)is one of the most important topics of chemical process engineering.Good mixing assures higher reaction efficiency and shorter process time,reducing process costs[1,2].Mixing in a STR relies on several geometrical parameters,configurations and operational conditions,but undoubtedly,impeller performance is the most influential factor of them all[3-5].Therefore,careful analysis of the fluid flow driven by the impeller along the whole vessel is necessary to evaluate reactor performance.A large variety of impeller geometries have been developed to solve all sorts of industrial problems[6-8].For its enhancement capabilities blending/mixing and heat transfer,one of the most studied impellers is the pitched blade turbine(PBT).Since the micro-mixing and macro-mixing rely on the flow velocities and turbulent components,suitable analytical,experimental and numerical tools are required to depict the overall flow patterns.In this sense,the solutions obtained using computational fluid dynamics(CFD)require a turbulence model capable of reproducing fairly the fluid behavior with a minimum computational effort.Reynolds-Averaged Navier-Stokes(RANS)models of thek-ε family represent a practical balance of the aforementioned constraints,since most powerful techniques as LES and DNS need an important amount of grid elements and simulation time,and thus,they are not suitable for practical engineering applications[9].Several works have been devoted to analyze the flow inside a STR using different grid resolutions,spatial discretization,coupling scheme and turbulence model,either for PBT or Rushton turbines,using the Multiple Reference Frame(MRF)approach[10-12]or Sliding Mesh(SM)[6,13,14].In such works,it is stated that the numerical models deliver fair predictions for mean velocities,but under-predicted values for the turbulent quantities(turbulent kinetic energy “k”,and dissipation rate “ε”),compared with the LDV or 2D PIV measurements.For example,Jaworski and Zakrzewska[15],performed a comparison of the Standard,RNG,Realizable and other models in a STR for a non-structured grid composed of 112,000 hexahedral elements,and subpredicted values were found fork.Murthy and Joshi[16],evaluated different turbulence models and impeller designs in domains composed of about 575,000 elements.According to their results,the Standard model performed weakly in the prediction of the turbulent production and dissipation profiles,specially near the blade regions where the flow is anisotropic.However,it is not clear if the zero thickness wall assumption adopted by the authors affected their predictions,as it is known that blade thickness influences the flow parameters[17].Further,the Standard model was taken as the representative case for thek-ε family.Joshiet al.[18,19],analyzed velocities and turbulent profiles induced by Rushton and PBT impellers using different turbulence models.The authors reported important deviations between the RNG and Standard model predictions for velocities,turbulent kinetic energy production and dissipation rates,and suggested that the Standard model performs well in unidirectional flow regions with weak recirculation.From the numerical point of view,at that time,the computational resources were limited in comparison to actual capabilities,and the grids solved were commonly of about half million cells or less,and were composed of hexahedral elements[11,14,20,21].Since grid refinement and cell number are important to capture the main flow gradients,especially for the turbulent parameters[22],it is desirable to assess those quantities using larger grids.Also,because the actual STRs contain accessories or their geometry is complex enough to be mapped by hexahedral grids,tetrahedral cells become an alternative,and its assessment becomes an interesting issue to address.Although thiskind of cells has been proven with success in the CFD modeling of a STR agitated by impellers in complex geometries[23-25],there is no information about the performance of the different models under the same comparative basis.It must be taken into account that the different closure models Standard,RNG or Realizable obey to deep physic assumptions and care must be taken regarding generalizing the results of the Standard model as unique and representative for all closure scenarios.The importance of achieving good quality results from RANS simulations relies not only on the necessity of fair average quality predictions of mean flow velocity and turbulent parameters,but also,in the necessity of good starting solutions for unsteady approaches,to decrease the time required to reach the desired statistic convergence.Furthermore,the engineering modeling of multiphase flows,combustion,and thermally affected boundary layers still needs an adequate choice of ak-ε model to account for turbulence,as more sophisticated models(DNS,LES)demand a significant amount of computational resources.Based on the above discussion,the objective of this work is to assess the prediction capabilities of the Standard[26],RNG[27]and Realizable[28]k-ε models of the flow features in a STR with four baffles,driven by a 4 blade PBT impeller atRe≈52,000,using unstructured grids.The validation is accomplishedviaestimation of the dissipation rate from torque measurements,and by 2D-PIV measurements of the flow field velocities and turbulent quantities near the impeller,when the full blade coincides with the measurement plane at 0°.This region was selected as it is the zone where the mean and turbulent energy are produced and transported,defining the subsequent flow patterns.Also,the performance of the Sliding Mesh(SM)method was assessed for the three turbulence models.The importance of this work,relies on the understanding of the models behavior in non-structured tetrahedral grids especially useful to represent complex geometries,which are the natural evolution of second generation STR devices.
2.Materials and Methods
2.1.Tank geometry and operational conditions
In Fig.1a,the STR geometrical description is illustrated.For the purposes of the measuring technique,the vessel was built using a 2 mm thick acrylic sheet,withT=H=0.25 m.Four baffles were used in order to break flow symmetry.The width of each baffle isT/10 with a thickness of 3.5 mm.The PBT was composed of 4 rotated blades at 45°,with diameterD=0.0795 m,blade vertical projection of 14.3 mm and thickness of 1.5 mm.The bottom clearance of the tank was fixed atT/3,in order to obtain a simple recirculation loop[4].Also,to correct the curvature effect in the measurements,the tank was immersed in a cubic tank filled with water at the same level.The length of each side of the cube was of 0.36 m with 2 mm of thickness.To control the angular velocity(N)to 8.33 s-1(500 r·min-1),a velocity driver was connected to the PBT shaft,in which the diameter was of 6.3 mm.At such conditions,fully turbulent flow was achieved(Re= ρND2/μ ≈ 52,000).Water density(ρ)of 998.2 kg·m-3and a dynamic viscosity(μ)of 0.001003 Pa·s were taken in the calculation of all flow variables.
2.2.Experimental PIV arrangement and torque measurements

Fig.1.Geometrical description of the STR.a)experimental variables,b)suction and discharge lines used to plot the velocities and turbulent profiles.
Velocity measurements inside the STR were recorded with a 2D-PIV system(TSI Incorporated).The equipment includes a Nd:YAG pulsed laser that generates,through frequency doubling,two precisely overlapped beams of 75 mJ at 532 nm.The optical array creates a laser sheet of approximately 1 mm thick that is used to illuminate the area of interest depicted in the blue shaded region in Fig.1a.Hollow glass spheres coated with silver were used as tracer particles.They have a diameter of 8 μm to 12 μm on average with their densities varying from 1015 kg·m-3to 1050 kg·m-3.The camera has a pixel resolution of 2360 px×1776 px,a minimum frame straddling time of 195 ns and a capture rate of 14 frames·s-1.The camera-laser arrangement allowed capturing the midplane between baffles as shown in Fig.2.
To assure that all images were taken in the same impeller position(full blade presence in the measured plane at 0°),a shaft encoder was adapted in order to produce a trigger signal in the camera.Image pairs were taken with a time difference of100μs.Inspection zone was located in the centralx-yplane located between baffles,covering an area of approximately 0.156 m×0.118 m.The spatial resolution of this configuration is≈66 μm·px-1,using interrogation windows of 32 px × 32 px with 50%of overlap.All interrogation windows contained 25 particles in average,giving a vector displacement of≈1.06 mm.For analysis purposes,the measured plane was reduced to a band of 2.0 cm around the impeller as depicted in Fig.1a.A total of 800 images were sequentially analyzed with the Insight 4G software using the Nyquist recursive grid algorithm in order to calculate the mean flow field,resulting in 400 instantaneous velocity maps.The statistical reliability of the velocity maps was tested by comparing the differences in mean and RMS velocities between 300 and 400 image pairs,being less than 3.5%.For illustration purposes,several instantaneous axial velocity maps are shown in Fig.3.The torque was measured on the shaft with a torque meter with a maximum capacity of 1.41 N·m-1and compensated temperature(20 °C to 75 °C).The torque used for calculations was the mean value of 900 measurements obtained at regular intervals of 0.02 s.
2.3.Estimation of the turbulent kinetic energy
Due to the lack of information about the third velocity component in 2D PIV measurements,the turbulent kinetic energy(TKE)is approximated under pseudo-isotropic assumptions by Eq.(1),as function of the square of the fluctuatingxandyvelocities,denoted byu′andv′.


Fig.2.CCD and Laser array configuration(sheet fully synchronized with blade presence at 0°with the laser sheet at the mid x-y baffle plane).
The particular validity of this simplification was addressed by Khanet al.[29],and non-significant deviations were found when the 2D and 3D PIV maps were compared,even in the high gradient regions close to the PBT discharge.Accordingly,in this work,Eq.(1)is used to estimate the TKE.
2.4.Estimation of the production of the turbulent dissipation rate
The estimation of the magnitude and distribution of turbulence dissipation rate “ε”involves the measurement of the three fluctuating velocity components and the corresponding calculation of their three spatial derivatives(12 terms).Since the 2D PIV only allows the measurement of two velocity components,only 5 derivative terms could be determined,and it is necessary to consider simplifying assumptions.Commonly,the turbulence is considered non-homogeneous but statistically isotropic,and ε is estimated according to Eq.(2)[30].This procedure is usually known as direct evaluation DE.

One shortcoming of the DE method is related to PIV spatial resolution.To calculate adequately the true dissipation rate,the measurement needs to be performed at scales down to the Kolmogorov dissipative length scaleotherwise,the content will be underestimated.Saarenrinne and Piirto[31]reported that with a spatial resolution of 9λK,only the 65%of the true dissipation rate could be captured.From the power dissipated by the shaft-impeller in the vessel fluid,λK≈ 46 μm,and the spatial resolution derived from PIV is 43λK.Therefore,underestimated results are expected using the DE method and for that reason,they are shown just for illustrative purposes.By its formulation,the Large Eddy approach is an improved alternative that compensates ε when spatial resolution issues in PIV are present[32].According to this method,it is possible to estimate the contribution of the non-measured scales smaller than the interrogation window size,by means of a SGS model,similarly to the LES method[33].In Cartesian coordinates,the dissipation rate could be approximated using Eq.(3)[34].

Here,Δ is the spatial resolution of the recorded data,andCsis the Smagorinsky constant.As suggested by Meyers and Sagaut[35],Csmust be adjusted depending on the ratio Δ/λKof the experimental conditions.Following the latter,a value forCs=0.17 was obtained for our PIV measurements,using Δ/λK≈46,which is quite similar toCs=0.173 derived from dimension analysis.Further,considering that a value ofCs=0.11 has proven to be successful in LES simulations[36-38],it was also included in the analysis.It is important to note that for their original formulation derived from the classic Smagorinsky model[39],the model of Shenget al.[32]defined εSGS=-2with the shear stresses τij=-(CsΔ)2and the strain rate defined as function of the instant velocities.The formulation of Khanet al.[34],which has been adopted by various authors[40,41]and in this research,is based in the same equations of the Smagorinsky model,but taking the fluctuating strain rateSij′insteadin all formulations utilized to derive Eq.(3).The use of the fluctuating strain rate is reasonable considering that eddies and swirl motions from turbulence,are directly related to velocity fluctuations,and considering that they could be measured from PIV instead of being calculated by the filtered Navier-Stokes equations.In order to discuss the results,the dissipation rate maps will be normalized with the tank averaged specific dissipation rate as ε*=,with=0.215 W ⋅kg-1,calculated from torque measurements in the shaft.
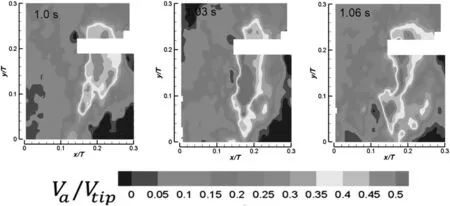
Fig.3.Non-dimensional instantaneous axial velocity maps obtained from PIV.
3.CFD Simulations
3.1.Solution methods and turbulence closure models
A 3D full model of the STR was solved using ANSYS-FLUENT V.13.0 in a segregated manner for both,the MRF and SM approaches,defining a rotational zone near the impeller and a non-rotational zone for the rest of the domain.All evaluated grids were composed of tetrahedral elements,all below the maximum skewness of 0.8,which were below the 0.95 limit listed in the Fluent user's manual[42].The SIMPLE pressure velocity coupling algorithm was implemented in the solution.Second order for pressure and second order upwind scheme discretization for the momentum,kand ε equations were used.For the SM approach,the temporal terms of the Standard,RNG and Realizable models were discretized using a second order implicit scheme.For both approaches,the convergence criterion was fixed below 1×10⁻⁵for the continuity and also foru,vandwflow velocities.Regarding boundary conditions,the non-slip condition(u=v=w=0)with standard log-law functions was imposed to the baffles,impellers and tank walls.In the free surface,the “symmetry”boundary condition was applied(zero shear stress wall).For the SM simulations,a Δt=3.33 × 10⁻⁴s(1°of blade rotation)was chosen,with 20 subiterations for each time step.This value is lower than the Kolmogorov time scaletk=0.002sobtained from the dissipated power measured from torque.Also,statistics for velocities and turbulent parameters were obtained from 20 full blade revolutions.The values of the turbulent constants in the governing equations used to perform the simulations were those of Table 1.As stated before,for comparison purposes,the mean flow characteristics were simulated using the Standard,RNG and Realizable models.Forthe RNG model,(MRF approach)the effect of the swirl factor which accounts for the swirl in the model,was evaluatedviatwo additional runs,using αs=0.07(the default value)and αs=0.25,summarizing three full simulations for this model specifically.The influence of this parameter is commonly disregarded in the CFD of STR[21,43]being also ignored in even more swirl dominated flows as cyclone separators[44,45]and vortex tubes[46].
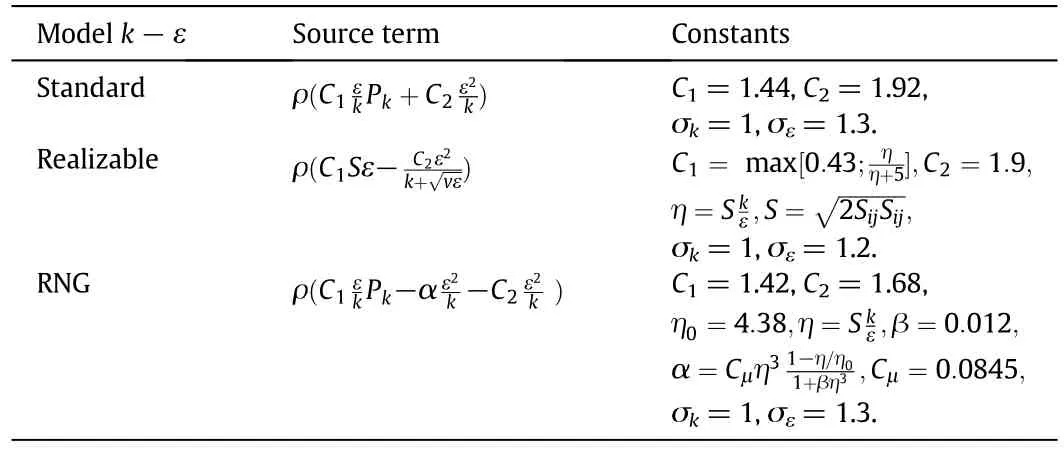
Table 1 Equations for Sεand associated constants
However,in order to assess its benefits,additional runs changing the constant value were included.Thek-ε turbulence models incorporate,on average,the influence of turbulent eddies(Reynolds stresses τij)through turbulent viscosity(μT),which is related to the fluid rate of strain according to Eq.(4).

Turbulent viscosity μTdepends on the predicted turbulent kinetic energykand its dissipation rate ε,according to Eq.(5).

Eqs.(6)and(7)represent the turbulent eddy influence,and they are added to the Navier-Stokes equations in order to obtain an average map of the turbulence distribution,considering μeff= μ + μTandveff= μeff/ρ

In Eq.(6),Pkrepresents the turbulent kinetic energy production as function of turbulent kinematic viscosity υT= μT/ρ,according to Eq.(8).

The source termSεin Eq.(7),acts as the coupling for additional equations,it is semi-empirically adjusted using several experimental and analytical considerations.Table 1 showsSεequations and the values of the constants used in this work.It is worth mentioning that the effects of compressibility,buoyancy and other non-hydrodynamic source terms are negligible,and therefore,they are not included in modeldescription.Regarding the validation analysis,PIV allows for global velocity field measurement,its inherent spatial correlation enables the observation of coherent flow structures and the detection and correction of outliers[47].For that reason,PIV results of averaged velocity are spatially robust.Also,ensemble averaging was performed for almost identical spatial-temporal conditions because PIV samples are obtained under similar dynamical conditions,i.e.synchronic with the passing of impeller at 0°.Based on the foregoing,PIV results are considered well suited to evaluate RANS model performance.Since PIV does not allow the measurement of the tangential velocity component(w component),in order to extend our validation,the CFD results were compared with the angle resolved LDV data from Chappleet al.[13].

Table 2 Characteristics of the meshes used to evaluate the independence
3.2.Grid independence analysis
Generally,depending on the domain complexity,grids could be mapped in a structured or unstructured form.Usually,for 3D domains,structured grids are composed mostly of hexahedral elements,allowing obtaining reliable solutions using less memory compared to unstructured grids[9].However,for complex domains,as those composed of sloped and curved walls or accessories,the structured grid creation is a very tedious task which involves a considerable time consumption.In this sense,the use of unstructured grid domains is an alternative which although involves the increase of the memory usage,is a suitable tool to map complex domains[9].As mentioned in the Introduction section,this paper further than compare the different RANS models,addresses the capacities of unstructured domains composed of tetrahedral elements to reproduce the velocities and turbulent parameters existent in a STR driven by a pitched blade turbine,as it is expected that second generation agitation devices would be composed of complex accessories or curved geometries.A tridimensional domain was built using unstructured tetrahedral grids,considering their potential to reproduce complex geometries.Also,near-wall refinements were implemented to capture the flow gradients in wall vicinity.To assess the influence of grid resolution,5 grids ranging from 0.57 to 2.3 million cells(see Table 2)were simulated with the Realizable model,under the MRF approach.
System memory and processor time,increase as the cell number increases.Therefore,it is important to select a mesh refinement which delivers good results and alleviates the necessity of large amount of computational resources.The flow driven by a PBT in a STR is characterized in terms of velocities and turbulence parameters.As the axial velocity is expected to contain most of the flow kinetic energy,and the dissipation rate is related to chemical reactions and mixing in the micro-scales,both parameters were chosen to perform the grid independence analysis.Their profiles were plotted along an axial line of 0.12 m,located 0.04 m from the rotating axis,and 0.025 m away from the blade mid-plane normal direction,as show in Fig.4.This line passes through the impeller suction and pumping region,where most of the momentum is transferred and turbulence is dissipated.From Fig.5a,it is noticeable that the axial velocity is high down the impeller,and it shows a region bounded by a sharp positive gradient of maximum velocity at abouty=0.08 m from the bottom,where impeller is pumping down the fluid.
Above this region,velocity decays,as it reached the suction region.The changes in the turbulent dissipation rate,shown in Fig.5b,were negligible for all positions,excepting values betweeny=0.8 m and 0.9 m position,where a slight dependence of cell number was present.Considering that both responses were similar qualitatively and very low discrepancies were present in magnitudes,results of the EMF,F and MF grids were not considered function of grid sizes,and so,they are considered just dependent of the turbulence model and coupling schemes.It is important to point out that longest computing time corresponds to the MF discretization.The power and pumping numbersNqandNp,defined by Eqs.(9)and(10),are two important non-dimensional quantities considered in the design of a STR as they are related to the pumping efficiency and dissipation of power in the entire vessel.Experimentally,theNqwas calculated as 0.81,and it was obtained from the approximation of the mass flow“Q”from Eq.(11),resulting from the integration of the axial profile obtained from PIV,at a line located 3 mm below the impeller.
This value resulted in fair agreement with the experimental value of 0.79 reported by Weetman and Oldshue[48].

The experimental power number wasNp=1.26,and as the specific total average dissipation rate,it was calculated from the power resulting of torque measurements,usingP=2πNT.This value resulted to be in fair agreement with the 1.27 reported by Chappleet al.[13].Regarding theNpobtained by CFD means,two methods could be applied for its calculation.One of them from the shaft numerical torque,and the other derived from the total dissipated power“ε”predicted in the whole domain as defined by Eq.(12).In order to examine the influence of grid refinement in this parameter,both were analyzed.

Fig.4.Axial line location for the grid independence study.
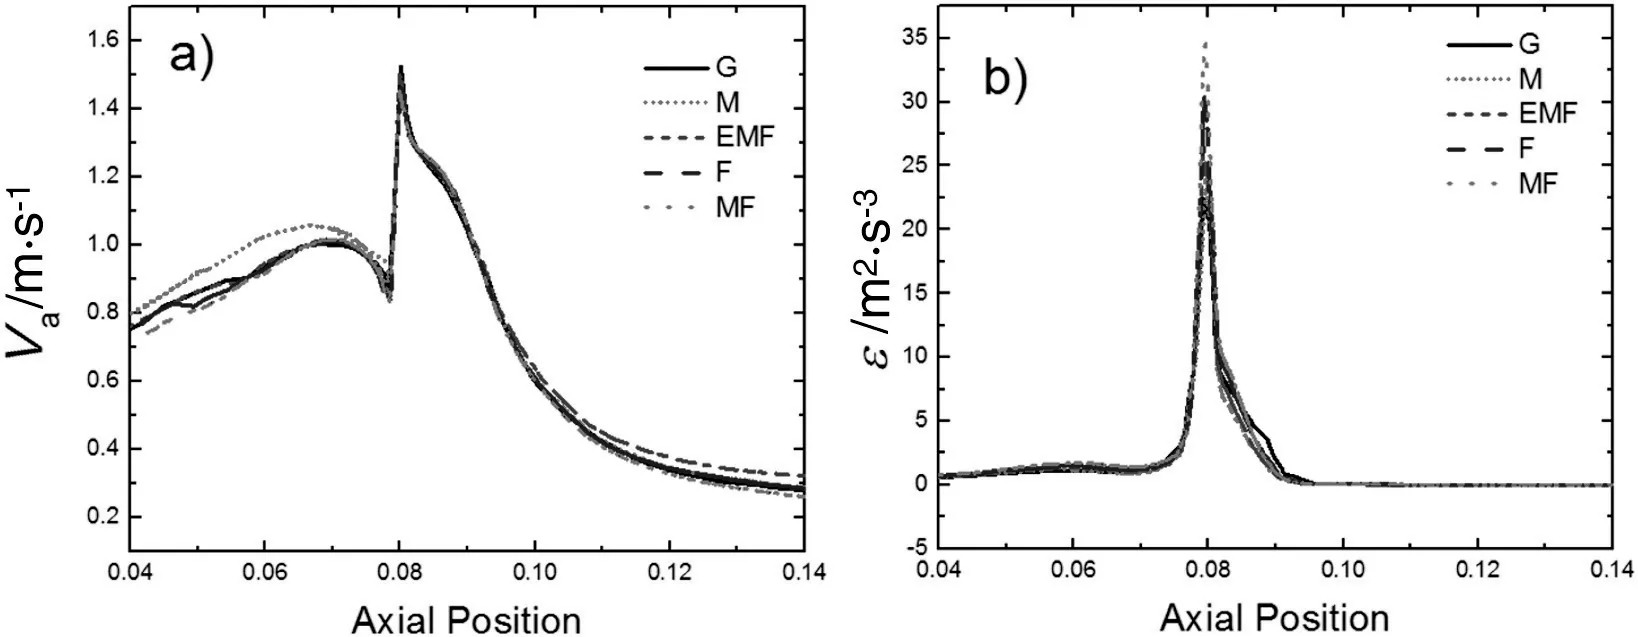
Fig.5.Grid independence analysis:a)axial velocity,b)turbulent dissipation rate“ε”.

Fig.6,shows theNpandNqobtained for the 5 evaluated grids.They were in good agreement with the corresponding experimental values.The reasonable predictions ofNpfrom torque with the different grids,indicate that the wall refinement of the PBT is adequate(nodal spacing of about 0.3 mm).Conversely,theNp-εcalculated from the volume integral of ε was sub-predicted for all cases,but a dependence on the cell number was found;higher power number at higher number of elements of the gridi.e.,with the G grid,theNp-εwas 0.6(50%of deviation from the experimental value)while with the MF grid,it was 0.93(26%of deviation).
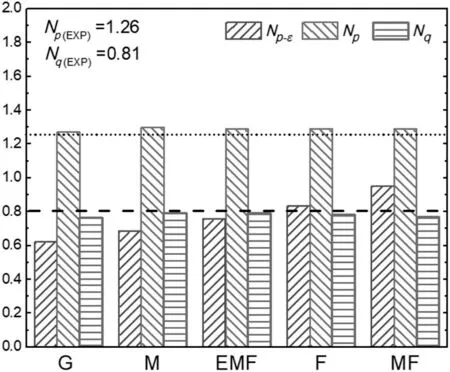
Fig.6.Pumping and power number as function of grid refinement(horizontallines refer to experimental values).
To analyze further the influence of grid refinement in the total quantities,Fig.7 shows the integral predictions forkand ε in the whole tank,as function on cell number.In this case,the integral value fork,defined asK,was obtained fromρkdrdzdθ.For the integral dissipation rate,Ewas obtained fromρεdrdzdθ.As the cell number is increased,bothKandEincrease,nearly in parallel form.Thus,the cell number affects the predictions of both total quantities and no mesh was capable of reproducing the integral content of ε derived from all domain.This could be related to both,the lack of the temporal term in the model and the fully developed turbulence assumptions.Although for different levels of grid refinement(less than 500,000 cells),this issue was also pointed out by Joshiet al.[18],and a similar trend was reported by Coroneoet al.,for a Rushton turbine[11].
There was no information that explains in a conclusive way this dependence for RANS models,but it could be related to numerical diffusivity issues.As the overall depiction of the flow patterns derived from CFD relies more on validated predictions of velocities and turbulent profiles(or maps),rather than in the integral parameters,this peculiarity was not considered an impediment to continue with the methodology of the whole work.As summary,from the EMF grid,the profile variations of axial velocity and dissipation are negligible,as it is shown in Fig.5a and b and theNqandNpderived from torque calculated numerically were adequately reproduced.Based on the above,the EMF grid illustrated in Fig.8 was chosen to evaluate all models due to its acceptable time consumption and fair agreement with most of the variables which describe the STR turbulent flow.In this grid,four nodes were equally disposed along the blade thickness,representing nodal separations of 0.25 mm and around 70 nodal elements were disposed along the blade length.The grid was densified in the rotating region in order to follow the flow features induced by the impeller motion,that is,36%of the cells were clustered in the rotating frame.
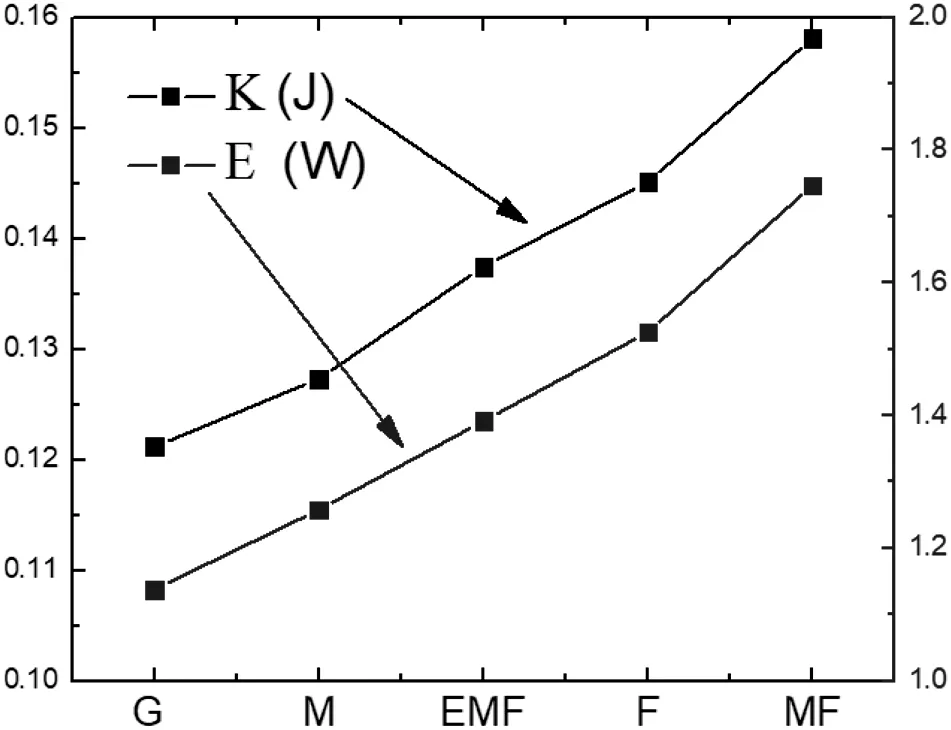
Fig.7.Total produced turbulent kinetic energy and dissipated power in the STR.
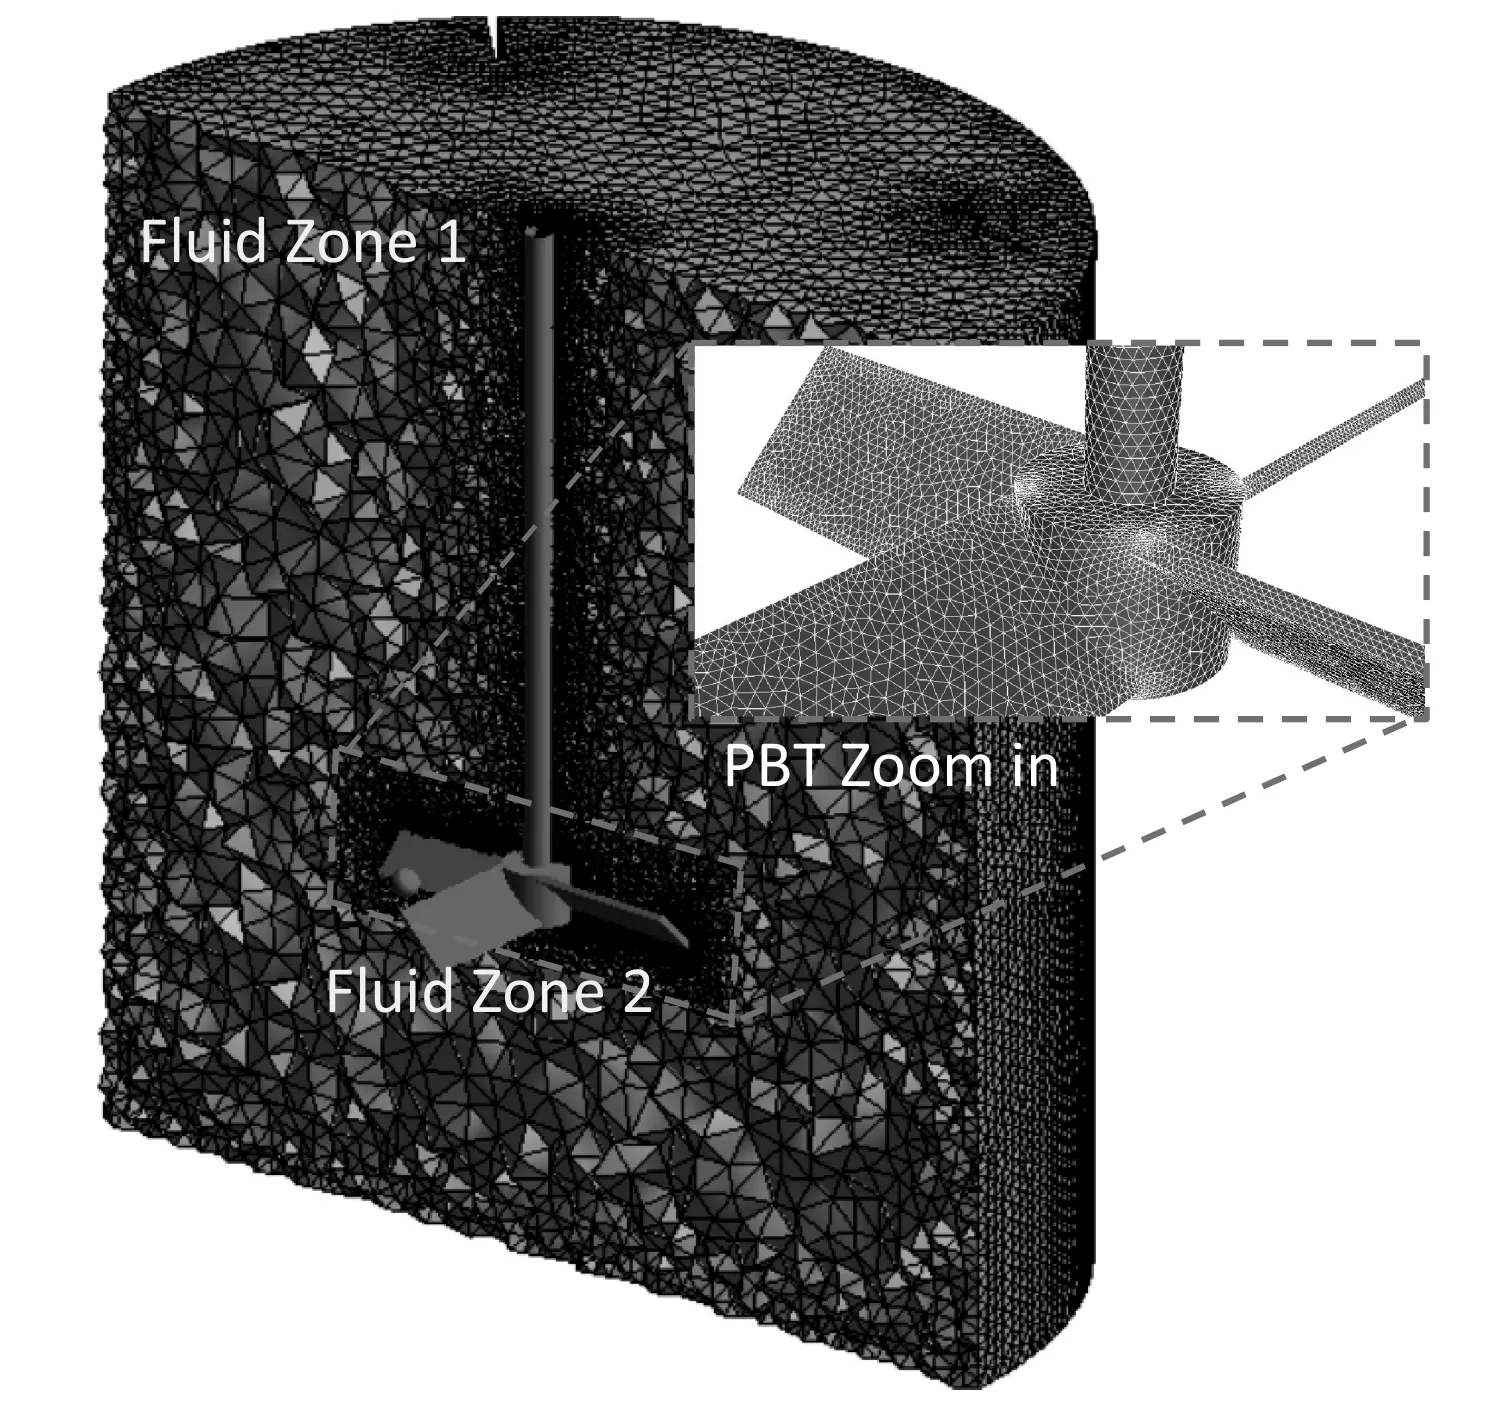
Fig.8.Nodal distribution of the EMF grid.
4.Results
4.1.Total production and dissipation rates
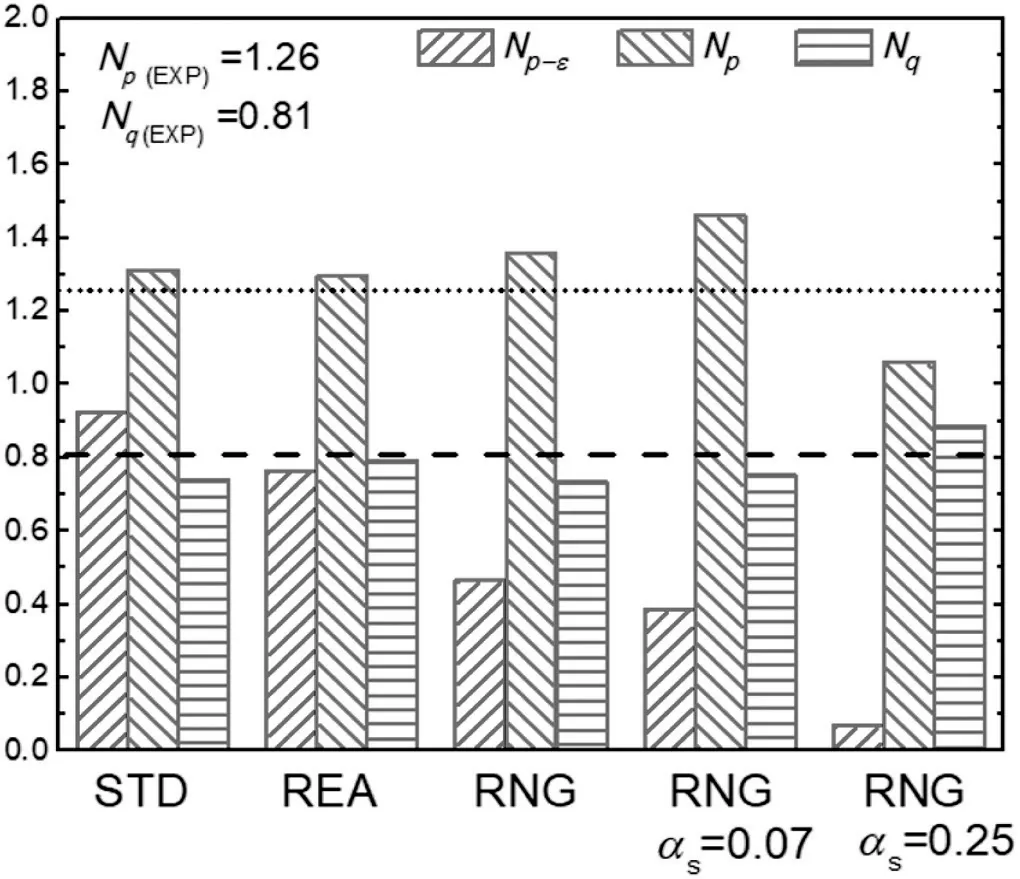
Fig.9.Power number,dissipated power and pumping number predicted by the different turbulence models(dashed horizontal lines refer to the experimental values).
Fig.9 shows the power number from torque,the power number from dissipated power and the pumping number predicted from the three turbulence models.Again,theNqandNpwere adequately predicted for the Standard,RNG and Realizable models.For the RNG case,the influence of the swirl account“αs”did not improved the predictions,as theNpwas overestimated about 20%for αs=0.07,and subpredicted almost equally for αs=0.25.Also,all models subpredicted theNp-εby more than 26%of the measured value.The best prediction was delivered by the Realizable model,and the worst,by the RNG.
4.2.Axial and radial velocity contours and profiles

Fig.10.Comparison of the simulated and experimental profiles of the dimensionless mean axial velocity(a,c and e),and radial velocity(b,d and f),at line ls(a and b),ld1(c and d)and lr(e and f).
The CFD plots of the axial and radial dimensionless velocity profiles at the linesls,ld1andlr versusthe PIV experimental measurements are plotted in Fig.10.As depicted in Fig.1b,these lines are located 3 mm away from the impeller,enveloping it,being coincident to the full blade presence over thex-yplane.The axial velocity in the suction linelsshown in Fig.10a,presented a classic parabolic shape,indicating a strong suction effect.Departing from the symmetry axis,the profile presented a positive gradient,which leads to a maximum of 0.4Vtipat almost midway along the paddle length at 2r/D≈0.65.For higher non-dimensional distance(2r/D),the flow is decelerated.These value and location are in good agreement with the LDV measurements of Kresta and Wood[49].The Realizable and RNG models presented fair agreement with PIV,and slight sub-predicted values were obtained by the Standard model.The CFD angle resolved velocitiesversusthe LDV from Chappleet al.[13]showed as well good concordance.In this case,since they are angle averaged,a decrease in magnitude with respect to the PIV is present.For the radial velocity component,showed in Fig.10b,the three models were able to predict the trend of the experimental data which presents a recirculation region centered at 2r/D=0.6,with negative components for low non-dimensional distance values and positive components for the rest of the paddle length.The transition region where the velocity changes from positive to negative is almost coincident with the location of maximum axial velocity.As flow moves far from the location of maximum axial velocity,radial components become important,indicating the existence of a recirculation region with high budget of kinetic energy.In the discharge region represented byld1in Fig.10c,the down pumping axial acceleration of the flow is evident in both experimental and simulated profiles,and the velocities were increased.The most accurate numerical simulation was achieved using the Realizable model.The Standard and RNG models presented slight under-predicted velocities,especially for the interval 0<2r/D<0.7.As mentioned before,for the RNG model two additional runs were performed using αs=0.07 and αs=0.25.For the latter two cases,axial and radial velocities were not significantly different between them,and for simplicity reasons,just the axial velocity is plotted.It is noteworthy to point out that convergence issues appeared,especially for αs=0.25 in thekand ε closure equations.For the radial component plotted atld1in Fig.10d,the Standard and RNG models were noticeably deviated from the PIV results.Once more,the Realizable model performs better than the RNG and Standard models.Velocity profiles along the linelrparallel to the tip of the paddle,are presented in Fig.10e(axial)and f(radial).PIV data show only positive axial components while the radial component presents a counter flow zone,with inward flow(entering the paddle)having greater values than outward flow.Simulation results from the Realizable model are in fair agreement with the flow attributes experimentally observed.Nevertheless,values were generally not as accurate as in lineslsandld1,especially for the radial component.
The non-dimensional axial velocity maps obtained by PIV and those corresponding to the turbulence models are shown in Fig.11.
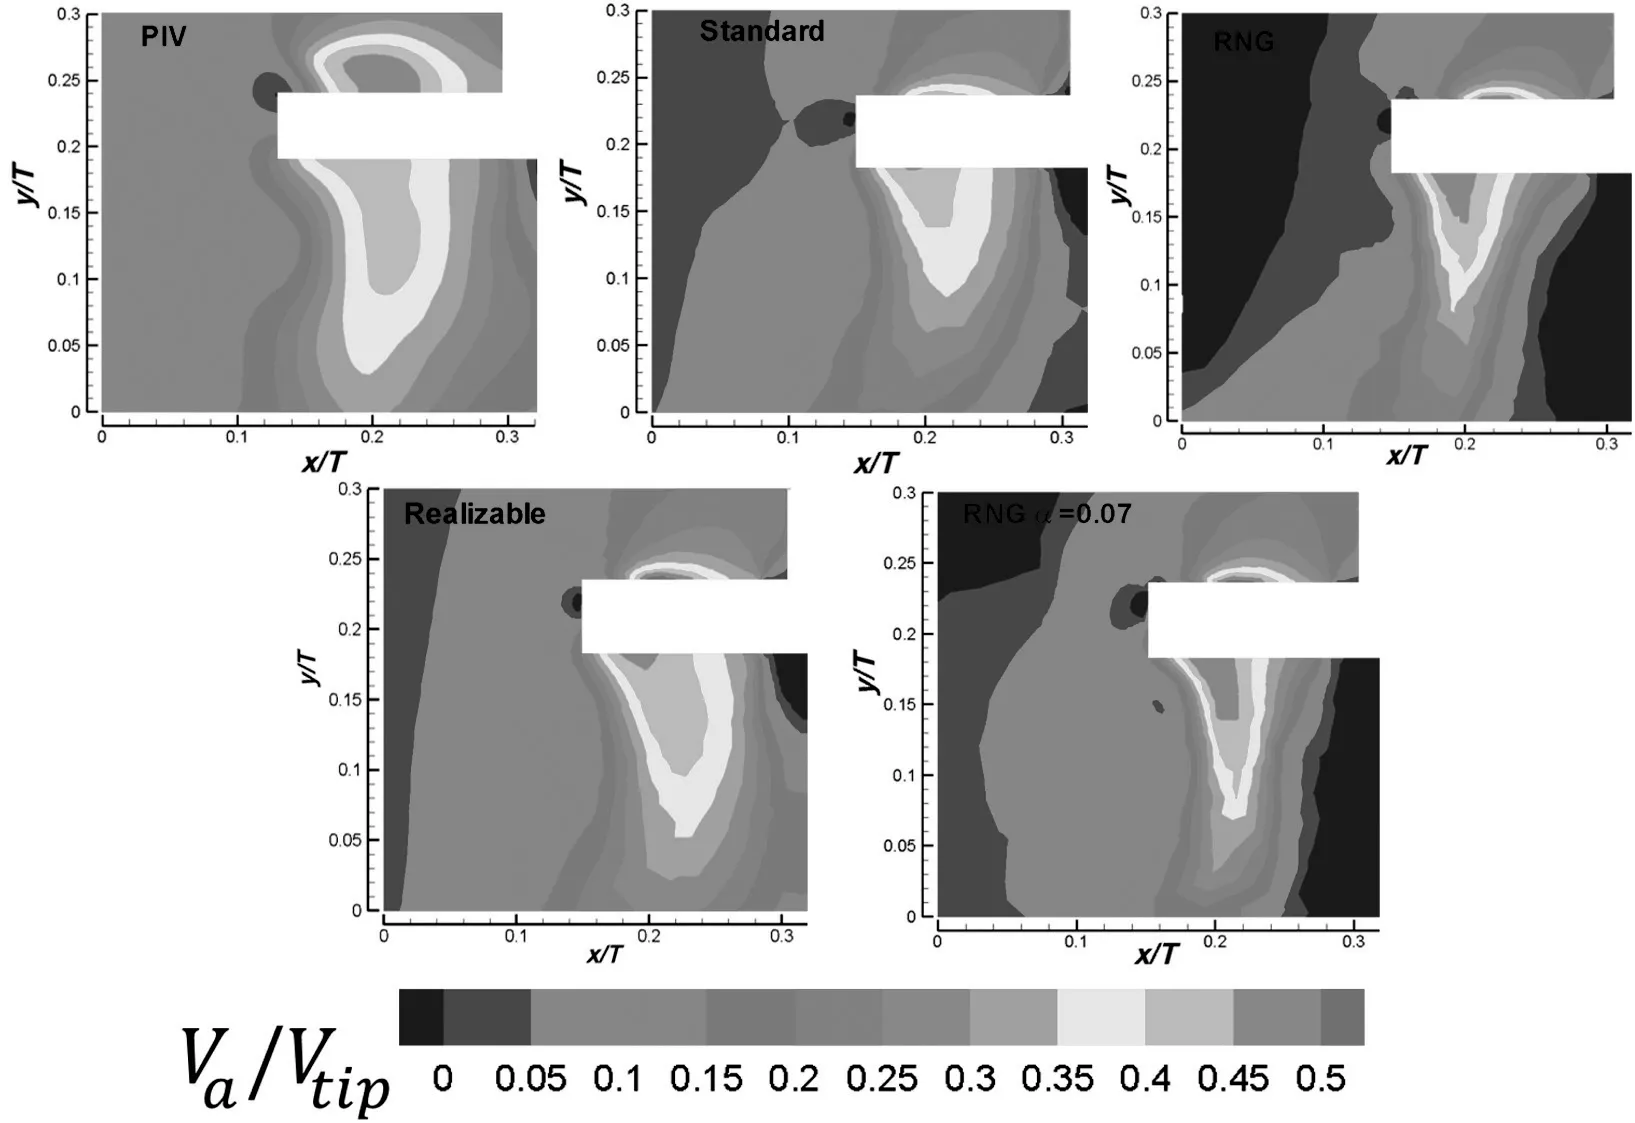
Fig.11.Non-dimensional axial velocity contours obtained from PIV versus the assessed models.
The high gradient region of axial velocity existing in the upper and lower blade regions,which are formed due to high momentum transfer induced by blade rotation,is evident.Although the extent and shape of this region presented slight variations between models,all of them were capable of reproducing adequately the experimental features.These good capabilities regarding the axial velocity predictions are reflected on theNqpredictions of Fig.9,as this parameter depends mainly in the axial velocity profiles.The differences between the CFD results from the RNG and Standard models and PIV,are attributed to limitations of both models to reproduce mean flow from those flow volumes with high deformations,such as those induced by the impeller blade,especially near tips,and zones in high radial velocity gradients.Even though the RNG model offers important improvements with respect to the Standard model,its analytical formulation requires additional adjustments according to the type of turbulent flow(i.e.a jet,external flow,pipe flow,etc.),which represents a limitation that could affect the mean velocity predictions in high anisotropic turbulence regions[29,30].On the other hand,the advantageous capabilities of the Realizable model to capture velocities in highly deformed flow regions(i.e.the impeller tips),are related to improvements of eddy dissipation and turbulent viscosity terms,which improve local strain rate and fluid rotation predictions[28].
4.3.Experimental dissipation rate analysis
As the turbulent dissipation rate is related to microscale chemical reactions,mixing and heat transfer,it is important to assess the differences that could be present when different methods of calculation are used.Fig.12 shows the normalized dissipation rate ε∗obtained from the PIV experiments for the DE and SGS methods.
The three maps,shown almost the same distribution,and a zone of high gradients is present near the tip blade,which is enlarged in the axial direction and spreads out through the PBT axis.However,important changes in magnitudes were found,as the SGS withCs=0.11 represented approximately 10 times(one order of magnitude)the dissipation rate estimated by the D.E.method,and the SGS withCs=0.17,almost 20 times.Comparing the SGS methods between them,there is a high dependence of ε*to the constant value,and results fromCs=0.17 almost doubled those fromCs=0.11.These shifts in magnitudes between methods are also visible in the profile obtained along the discharge line of Fig.13b.Far from the impeller region,no important differences were found between both methods.There is not a common agreement about theCschoice,and different studies using different values are present in the literature.For example,Sharp and Adrian[30]used 0.21 for the dissipation of a Rushton turbine,Shenget al.[32]used 0.173 for a PBT,and Gabrieleet al.[40]suggestedCs=0.11.However,considering that the calculations with the SGS withCs=0.17 were achieved using a constant derived from our experimental PIV resolution,it is considered valid,and it was used in the rest of the work for comparison purposes.

Fig.12.Contours of ε∗:a)D.E.method,b)SGS with Cs=0.11 and c)SGS with Cs=0.17.
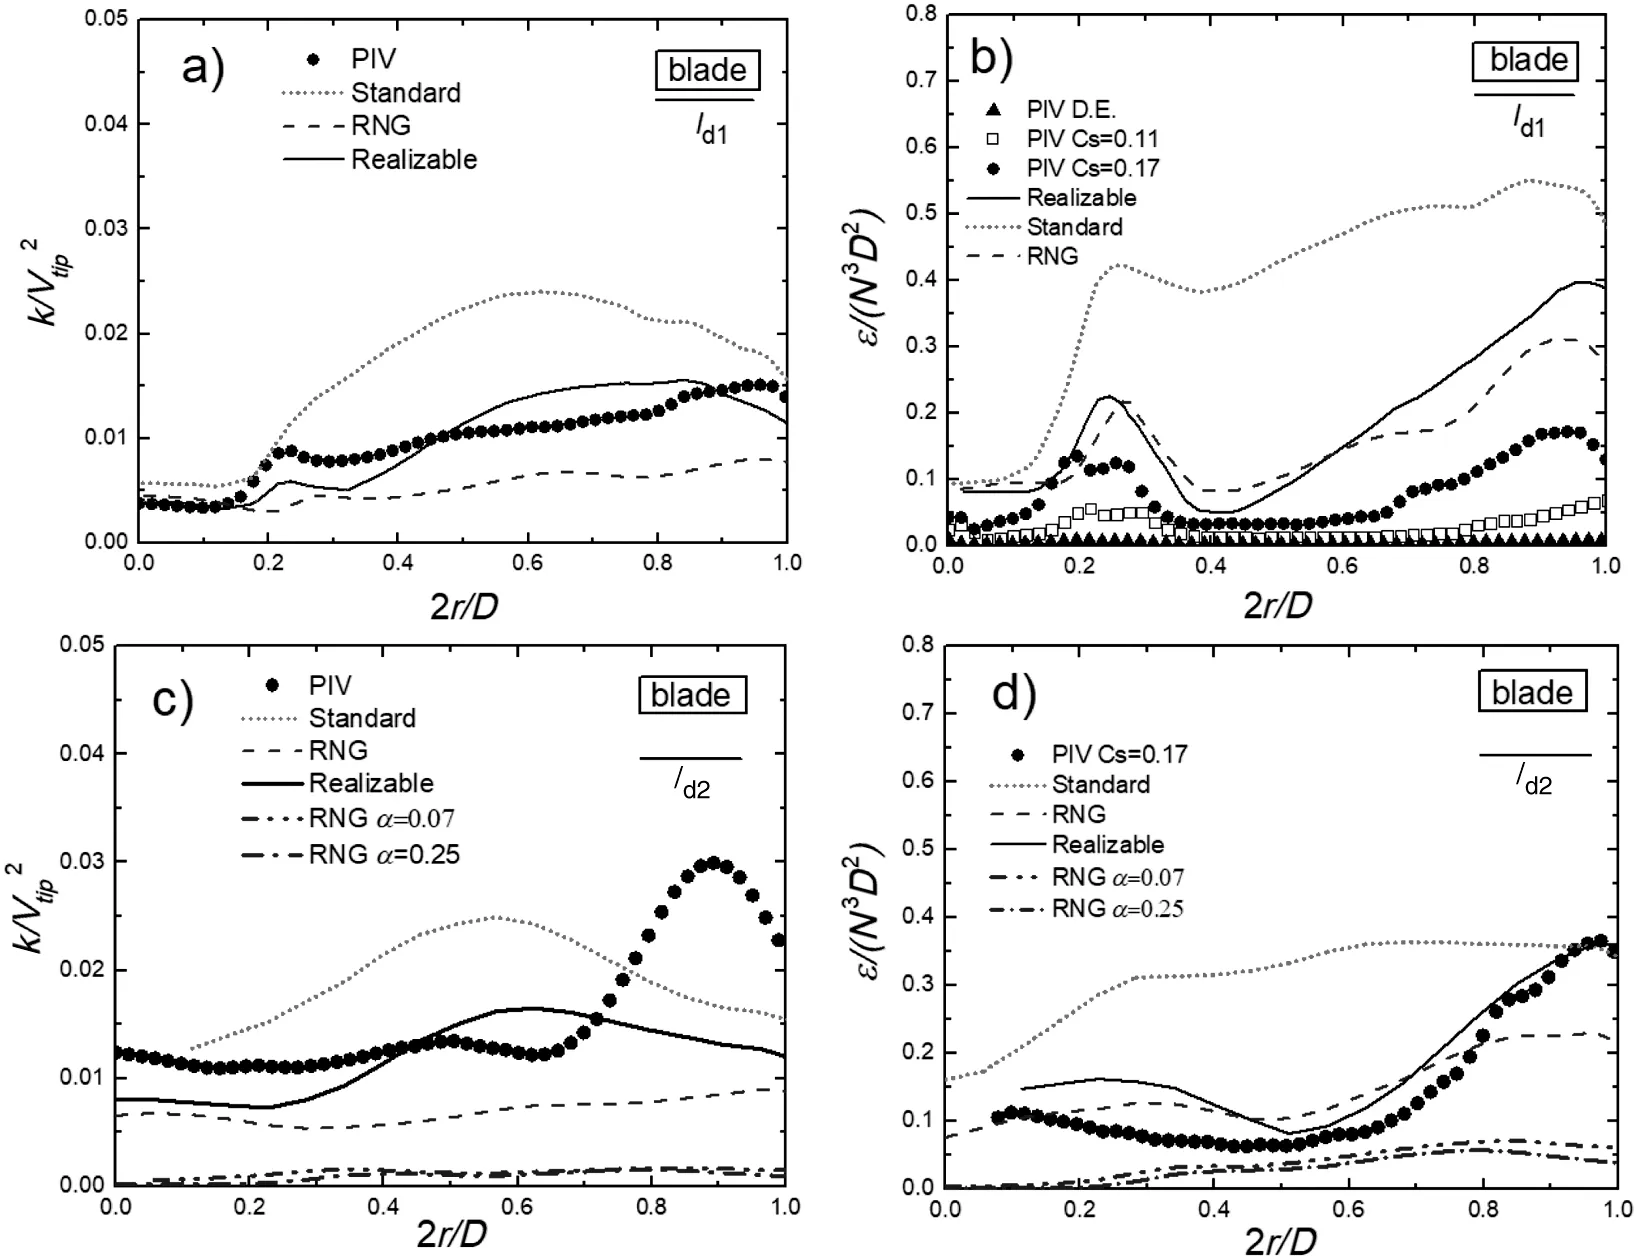
Fig.13.Non-dimensional k and ε profiles predicted along the discharge lines ld1 and ld2.
4.4.TKE andε,experimental vs CFD models
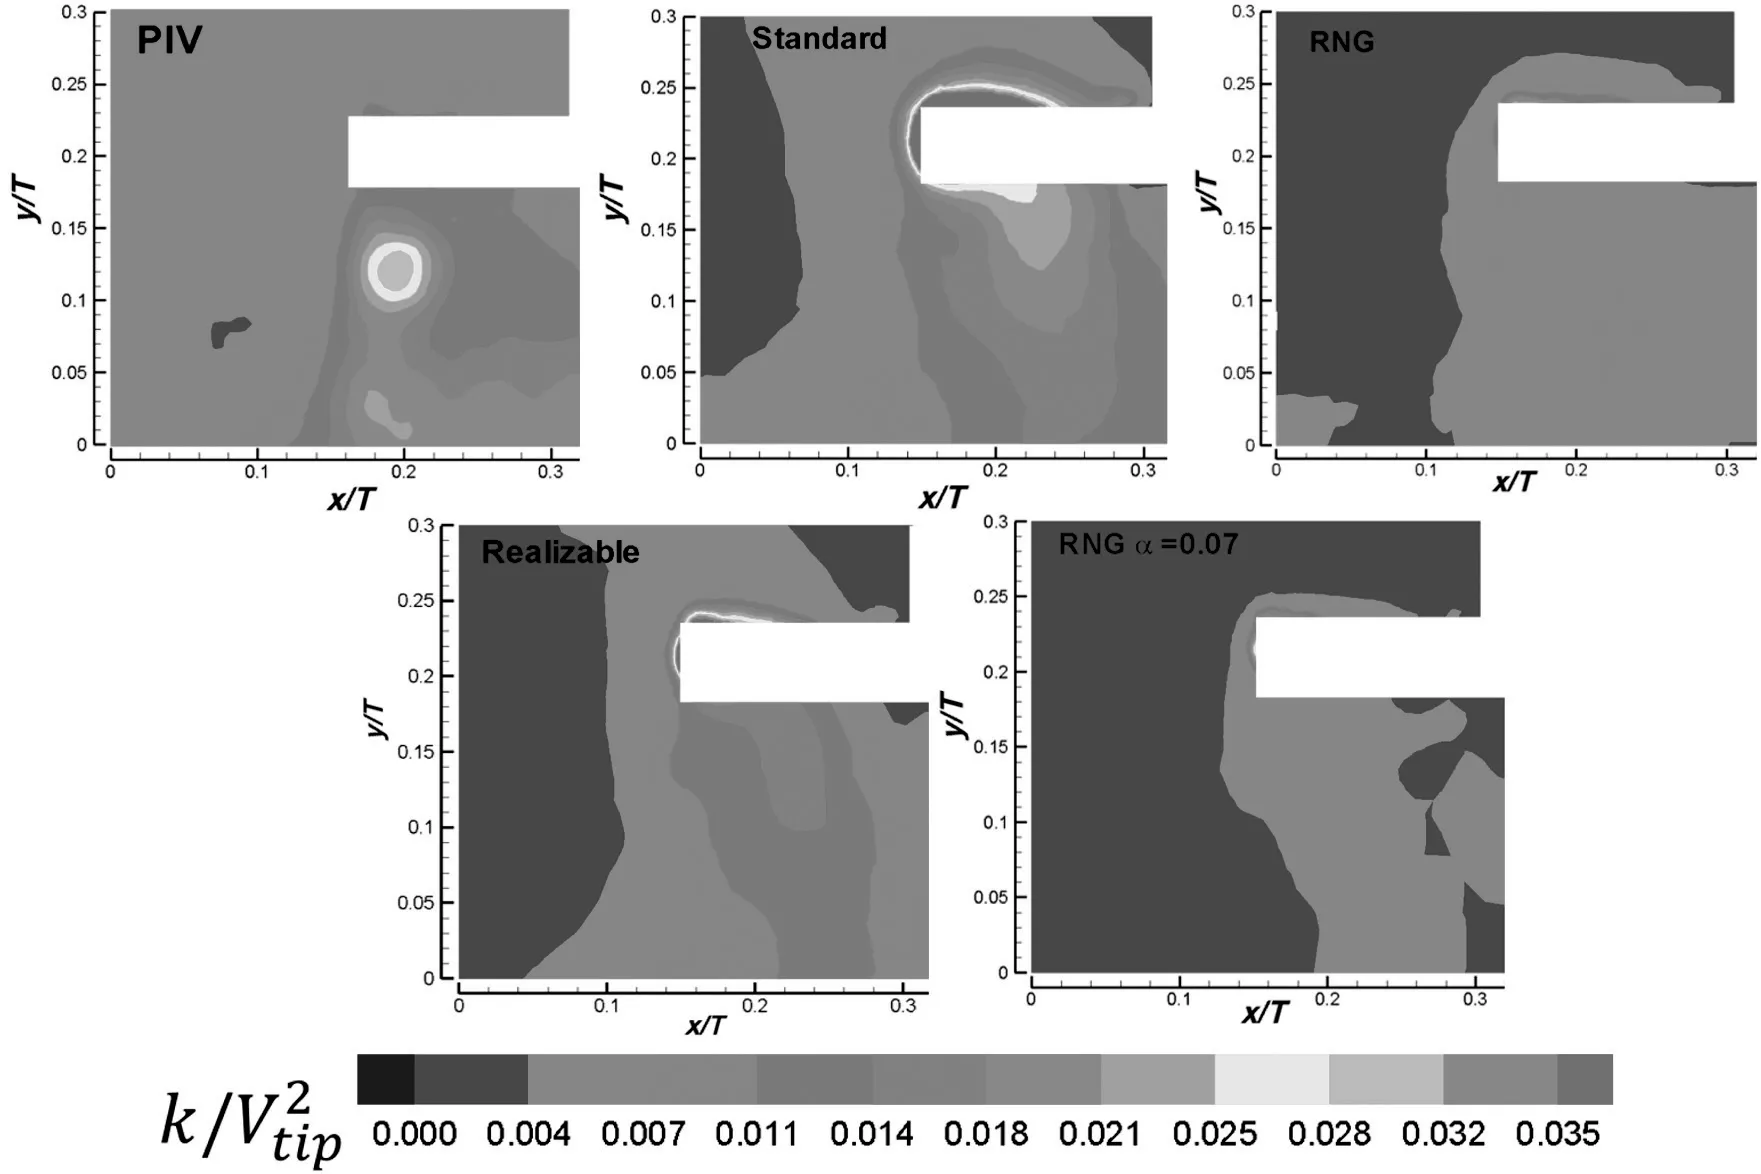
Fig.14.Non-dimensional turbulent kinetic energy production for the three turbulence models and PIV.
Fig.13a-d shows the profiles of non-dimensionalkand ε for the different CFD models and PIV along the two radial linesld1andld2.The lineld1was located 3 mm below the impeller,andld2was located 1 cm belowld1.These locations were selected in order to assess the model predictions in two regions of strong axial down-pumping gradients.The TKE profiles for both lines presented subpredicted values by RNG and overpredicted values for the Standard model.Although the Realizable model presented a reasonable agreement,differences were found regarding the shape of the curves.Specifically for the lineld2,as shown in Fig.13c,no model was capable of reproducing fairly the bell shaped behavior of the PIV profile in the zone 0.6<2r/D<1.As it is shown in Fig.14,this particular shape is the result of the high gradients of TKE below the blade tip.Comparing the ε measured alongld1,although the RNG and Realizable models followed the curve tendency,in general all models presented overestimated values.For the lineld2both,the RNG and Realizable models deliver better predictions.No visible difference was found regarding variations of the αsconstant for both,TKE and ε profiles.For that reason,in the following discussion,just the default value αs=0.07 is shown.As differences in profiles are related to redistributions,Figs.14 and 15 show the contour maps of normalized TKE and ε∗of the CFD modelsvsPIV.For the TKE measured by PIV,there is a circular zone below the PBT tip,where high gradients are present,which is related to the bell shape profile ofld2.Although both,Standard and Realizable,predicted fairly the extent of this region,high gradient locations zones were deviated from experimental results,as the ones located near of the mid-blade.The RNG model presented sub-estimated values,and again,no benefit was found regarding the influence of αs.
As it is shown in Fig.15,the predicted dissipation rate was severely over predicted by the Standard model.The RNG and Realizable models show better agreement with experiments.The Realizable model was capable of locating fairly the high gradient region,although the values were higher than those from the PIV.The RNG model although failed in locating the high dissipation region,showed the better agreement of all,in terms of magnitudes.
In summary,all models were capable of reproducing the axial velocity profiles in both,suction and discharge regions.This was evident in the contour maps of Fig.11.For radial velocities,the Realizable model presented the best performance.In the case of TKE,the Standard and Realizable models presented the better agreement in relation to the PIV results,while the RNG model subpredicted them.Although the RNG and Realizable models predicted fairly well the extent ofthe dissipation rate,its location was deviated.Finally,the best performance was obtained by the Realizable model,as both,velocity and turbulence parameters were reasonably predicted.The relocations and overpredictions in turbulence parameters could be explained as consequence of the use of tetrahedral cells,as it is known that they are dissipative in nature.Also,since the time derivatives could play a key role in the distribution predictions,the Sliding Mesh(SM)approach was further analyzed comparing the response of the three models.

Table 3 Time averaged pumping and power numbers from the SM simulations
4.5.Sliding mesh results
The main time averaged integral values obtained for the SM simulations and their differences associated with the experimental measure ofNpandNqare shown in Table 3.All the three models presented good agreement with theNpderived from torque,being the differences below 6%for all cases.The pumping number was also well predicted by the RNG and Realizable models.The Standard slightly over-predicts this parameter and the Realizable and RNG presented the better agreement,with 11.1%and 4.94%of deviation,respectively.The power number derived from the dissipation content was under-predicted by the RNG and Realizable models and over-predicted by Standard.This suggests that the inclusion of the temporal term in the simulations does not improve the prediction capabilities of the models,although the more sophisticated models presented more realistic scenarios(RNG and Realizable models).
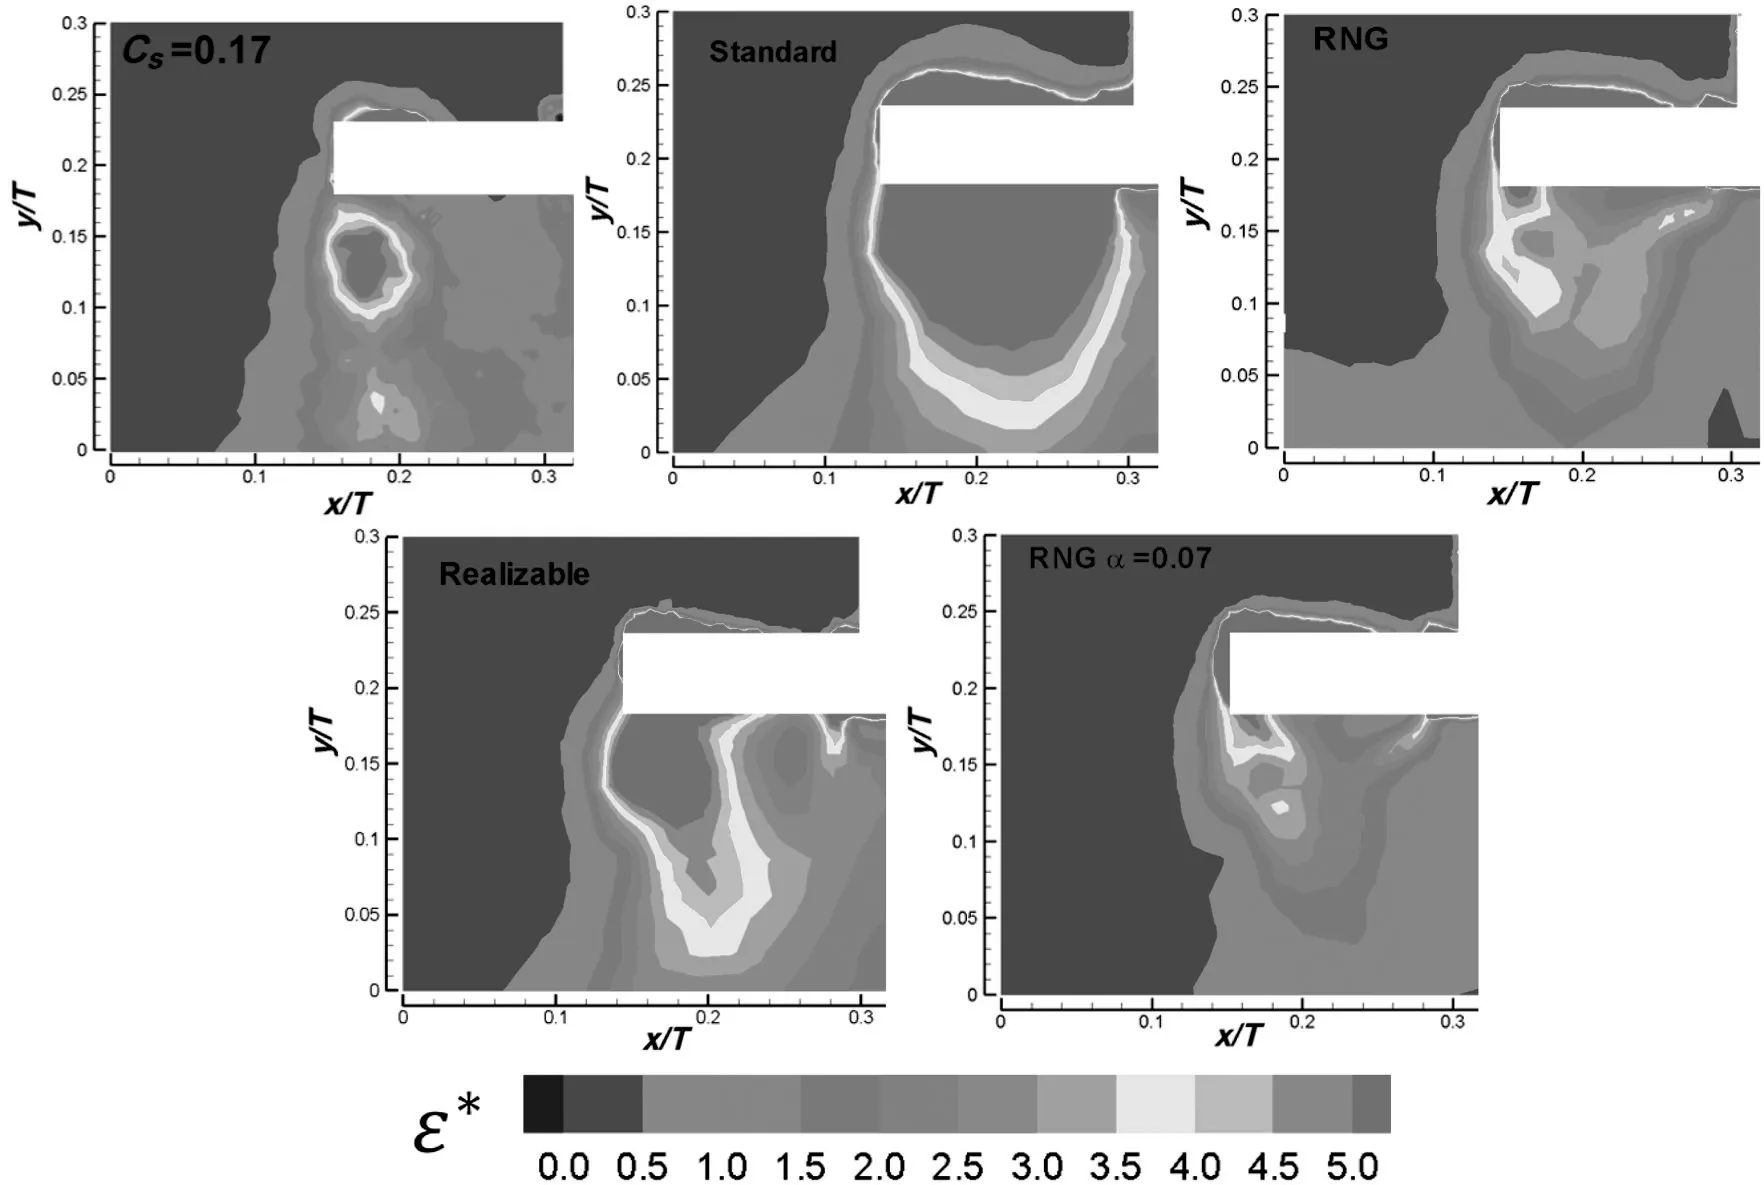
Fig.15.Normalized dissipation rate for the evaluated models and PIV(SGS with Cs=0.17).
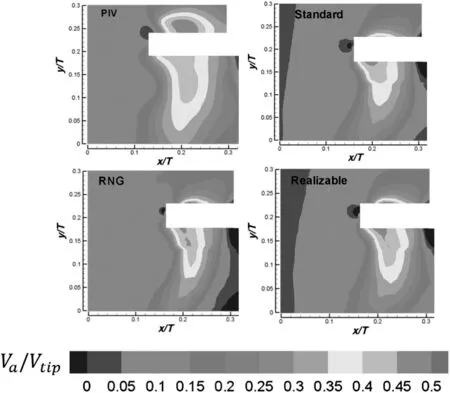
Fig.16.Mean axial velocity from PIV and the Sliding Mesh simulations.
Regarding the velocities derived from the SM simulations shown in Fig.16,it is evident that no important changes were present between models,as the three of them depicted well the physics of the PBT axial pumping.After all,the main differences between formulations are present in the production and dissipation rate terms of their particular closure equations.In order to verify this,Fig.17a and b,shows the profiles of non-dimensionalkand ε∗plotted along the lineld2located in the down pumping region.As for the MRF case,the Standard model overpredicted the values ofk,the RNG model subpredicted them,but the Realizable model presented the best agreement with PIV data.Again,no model was capable of reproducing the PIV measurements below the tip impeller.For the dissipation rate shown in Fig.17b,the RNG model presents the best agreement with PIV results,although all three models overpredicted the ε values.As stated before,difference in profile shape is related to redistribution of parameters.In order to evaluate this feature,Fig.18a and b shows the time averaged contour maps ofkand ε for the three turbulent models.In agreement with the MRF simulations,thekvalues of the Realizable and Standard models from the SM approaches presented better agreement with PIV results than the RNG model,which under predicted the values.For the dissipation rate contours,shown in Fig.18b,both the Realizable and RNG models,presented fair agreement with PIV data.Although the magnitudes of the Standard model were improved,no high gradient regions were present in the pumping zone,and important differences regarding the other models were found.

Fig.17.Non-dimensional profiles of k and ε for the Sliding Mesh CFD.
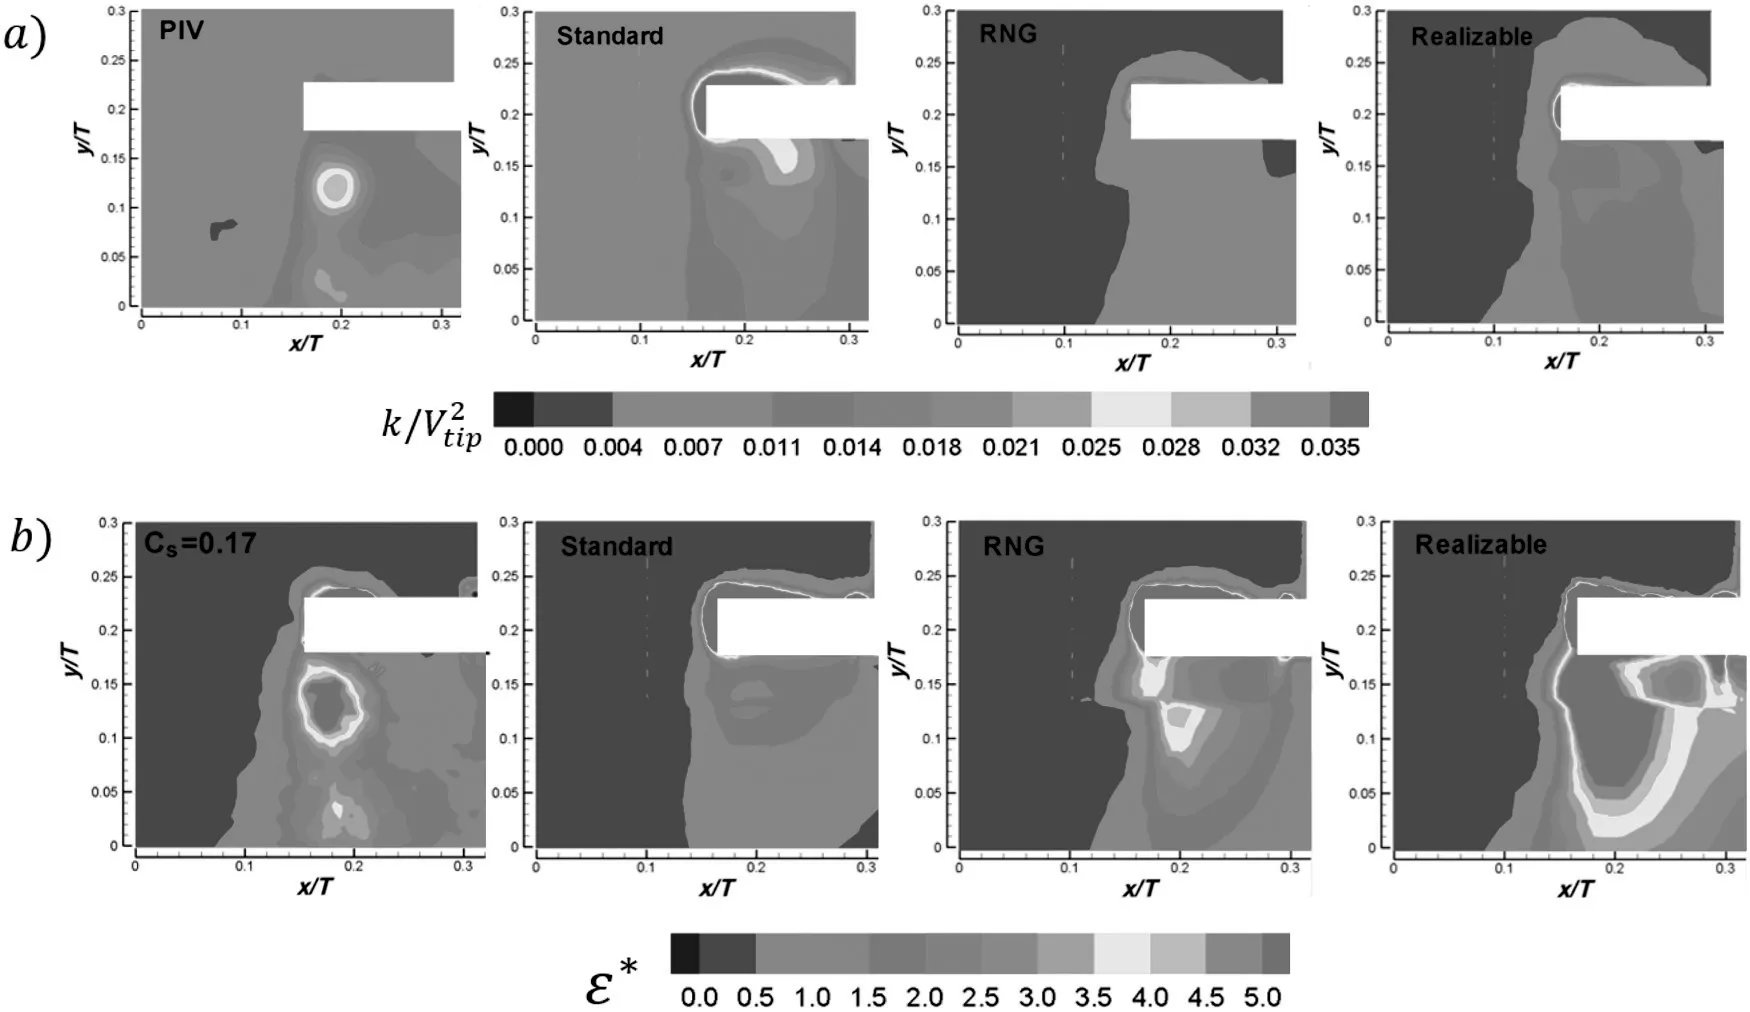
Fig.18.TKE and dissipation rate maps,PIV versus SM simulations:a)k and b)ε*.
As for the MRF approach,the overall predictions of the Realizable model were superior in comparison with the Standard and RNG models.In order to get insight about the benefits of URANS simulations,the prediction ofkand normalized ε for the MRF and SM approach is shown in Fig.19a and b.For the sake of simplicity,just those of the Realizable model are shown,as the RNG and Standard models presented the same tendency.For the production of turbulence kinetic energykshown in Fig.18a,contours revealed almost negligible differences,and both approaches predicted fairly the PIV maps.Although for ε*such differences were not negligible especially for the boundary between the rotational and no-rotational zones,the whole shape of the high gradient region was similar.

Fig.19.Comparison between TKE and dissipation for the MRF and SM simulations for the Realizable model.First column refers to PIV.
The differences could be related to numerical issues in the interface,which hardly can be avoided for rotational grids.Thus,the latter clearly suggests that the SM approach which demands more computational time resources,is not justified when the interest of a simulation relies on mean values of both velocity and turbulent parameters,at least for tetrahedral mesh schemes.Although the MRF Realizable model was capable of providing good quality information of the mean velocities differences were found between the CFD and PIV regarding the distribution of turbulent quantities.
Due the isotropic assumptions of the RANS models,these deviations are expected,especially below the blade tip and discharge regions,where the flow is highly anisotropic.Moreover,numerical issues could be involved when tetrahedral elements are implemented as they are dissipative in nature due to the additional algorithms to balance cell fluxes.
5.Conclusions
The operation of a PBT impeller inside a STR under fully turbulent conditions was simulated with tetrahedral grids,using Standard,RNG and Realizable turbulence models under the MRF and SM approaches.For validation purposes,axial and radial velocities,turbulence productionkand dissipation rate ε were obtained from 2D PIV measurements.For the MRF approach all models delivered goodNqvalues because of the adequately predicted mean axial velocity.Although theNpderived from torque was in good agreement with the measured value,the dissipated power on the whole tank was subpredicted for all models.Further,dependence of the dissipation rate with the cell number was found.The Realizable model presented a better performance in comparison to the Standard and RNG models for turbulent quantities.However all models presented different distributions especially for the dissipation rate.This is probably caused by the fully isotropic assumptions of the models,which is expected to fail in highly deformed regions as those of near tip blades.Finally,no advantage was found regarding the implementation of the SM for velocities and turbulent mean values.
Acknowledgments
The authors wish to express their acknowledgement to the National Council of Science and Technology,Mexico CONACyT for the support provided for this research,through the Basic Science project CB-2011/169786.Thanks are also due to the Engineering Center and Industrial Development from Mexico for the facilities provided during the accomplishment of this work.
[1]H.Bashiri,E.Alizadeh,F.Bertrand,J.Chaouki,Investigation of turbulent fluid flows in stirred tanks using a non-intrusive particle tracking technique,Chem.Eng.Sci.140(2016)233-251.
[2]A.W.Nienow,Stirring and stirred-tank reactors,Chem.Ing.Tech.86(2014)2063-2074.
[3]J.Aubin,P.Mavros,D.F.Fletcher,J.Bertrand,C.Xuereb,Effect of axial agitator configuration(up-pumping,down-pumping,reverse rotation)on flow patterns generated in stirred vessels,Trans.IChemE79(2001)845-856.
[4]D.Mao,L.Feng,K.A.I.Wang,Y.Li,The mean flow field generated by a pitched blade turbine:Changes in the circulation pattern due to impeller geometry,Can.J.Chem.Eng.75(1997)307-316.
[5]T.Jirout,F.Rieger,Impeller design for mixing of suspensions,Chem.Eng.Res.Des.89(2011)1144-1151.
[6]T.Kumaresan,J.B.Joshi,Effect of impeller design on the flow pattern and mixing in stirred tanks,Chem.Eng.J.115(2006)173-193.
[7]C.Y.Ge,J.J.Wang,X.P.Gu,L.F.Feng,CFD simulation and PIV measurement of the flow field generated by modified pitched blade turbine impellers,Chem.Eng.Res.Des.92(2014)1027-1036.
[8]C.Meng,J.Huang,C.Ye,W.Cheng,J.Chen,Y.Li,Comparing the performances of circular ponds with different impellers by CFD simulation and microalgae culture experiments,Bioprocess Biosyst.Eng.38(2015)1347-1363.
[9]B.Andersson,R.Andersson,L.Hakansson,M.Mortensen,R.Sudiyo,B.van Wachem,Computational Fluid Dynamics for Engineers,Cambridge University Press,UK,2012.
[10]W.Bujalski,Z.Jaworski,A.W.Nienow,CFD study of homogenization with dual Rushton turbines—Comparison with experimental results part II:The multiple reference frame,Trans.IChemE80(2002)97-104.
[11]M.Coroneo,G.Montante,A.Paglianti,F.Magelli,CFD prediction of fluid flow and mixing in stirred tanks:Numerical issues about the RANS simulations,Comput.Chem.Eng.35(2011)1959-1968.
[12]M.Taghavi,R.Zadghaffari,J.Moghaddas,Y.Moghaddas,Experimental and CFD investigation of power consumption in a dual Rushton turbine stirred tank,Chem.Eng.Res.Des.89(2011)280-290.
[13]D.Chapple,S.M.Kresta,A.Wall,A.Afacan,The effect of impeller and tank geometry on power number for a pitched blade turbine,Trans.IChemE80(2002)364-372.
[14]S.L.Yeoh,G.Papadakis,M.Yianneskis,Numerical simulation of turbulent flow characteristics in a stirred vessel using the LES and RANS approaches with the sliding/deforming mesh methodology,Trans.IChemE82(2004)834-848.
[15]Z.Jaworski,B.Zakrzewska,Modelling of the turbulent wall jet generated by a pitched blade turbine impeller,Chem.Eng.Res.Des.80(2002)846-854.
[16]B.N.Murthy,J.B.Joshi,Assessment of standardk-ε,RSM and LES turbulence models in a baffled stirred vessel agitated by various impeller designs,Chem.Eng.Sci.63(2008)5468-5495.
[17]K.Rutherford,S.Mahmoudi,K.Lee,M.Yianneskis,The influence of Rushton impeller blade and disk thickness on the mixing characteristics of stirred vessels,Chem.Eng.Res.Des.74(1996)369-378.
[18]J.B.Joshi,N.K.Nere,C.V.Rane,B.N.Murthy,C.S.Mathpati,A.W.Patwardhan,V.V.Ranade,CFD simulation of stirred tanks:Comparison of turbulence models.Part I:Radial flow impellers,Can.J.Chem.Eng.89(2011)23-82.
[19]J.B.Joshi,N.K.Nere,C.V.Rane,B.N.Murthy,C.S.Mathpati,A.W.Patwardhan,V.V.Ranade,CFD simulation of stirred tanks:Comparison of turbulence models(Part II:Axial flow impellers,multiple impellers and multiphase dispersions),Can.J.Chem.Eng.89(2011)754-816.
[20]G.Montante,G.Micale,F.Magelli,A.Brucato,Experiments and CFD predictions of solid particle distribution in a vessel agitated with four pitched blade turbines,Trans.IChemE79(2001)1005-1010.
[21]J.Aubin,D.F.Fletcher,C.Xuereb,Modeling turbulent flow in stirred tanks with CFD:The influence of the modeling approach,turbulence model and numerical scheme,Exp.Thermal Fluid Sci.28(2004)431-445.
[22]D.A.Deglon,C.J.Meyer,CFD modelling of stirred tanks:Numerical considerations,Miner.Eng.19(2006)1059-1068.
[23]H.C.Oliver,R.A.Yonatan,V.X.Mendoza-Escamilla,M.Helvio,M.A.Morales-Mora,S.A.Martínez-Delgadillo,The effect of internal impellers on mixing in an electrochemical reactor with rotating rings electrodes,Chem.Eng.Process.Process Intensif.88(2015)37-46.
[24]S.Martinez-Delgadillo,H.Mollinedo-Ponce,V.Mendoza-Escamilla,C.Gutiérrez-Torres,J.Jiménez-Bernal,C.Barrera-Diaz,Performance evaluation of an electrochemical reactor used to reduce Cr(VI)from aqueous media applying CFD simulations,J.Clean.Prod.34(2012)120-124.
[25]C.Devals,M.Heniche,K.Takenaka,P.A.Tanguy,CFD analysis of several design parameters affecting the performance of the Maxblend impeller,Comput.Chem.Eng.32(2008)1831-1841.
[26]W.P.Jones,B.E.Launder,The prediction of laminarization with a two-equation model of turbulence,Int.J.Heat Mass Transf.15(1972)301-314.
[27]V.Yakhot,S.A.Orszag,Renormalization group analysis of turbulence.I.Basic theory,J.Sci.Comput.1(1986)3-51.
[28]T.Shih,W.W.Liou,A.Shabbir,Z.Yang,J.Zhu,A newk-ɛ eddy viscosity model for high Reynolds number turbulent flows,Comput.Fluids24(1995)227-238.
[29]F.R.Khan,C.D.Rielly,D.A.R.Brown,Angle-resolved stereo-PIV measurements close to a down-pumping pitched-blade turbine,Chem.Eng.Sci.61(2006)2799-2806.
[30]K.V.Sharp,R.J.Adrian,PIV study of small-scale flow structure around a Rushton turbine,AICHE J.47(2001)766-778.
[31]P.Saarenrinne,M.Piirto,Turbulent kinetic energy dissipation rate estimation from PIV velocity vector fields,Exp.Fluids29(2000)300-307.
[32]J.Sheng,H.Meng,R.O.Fox,A large PIV method for turbulence dissipation,Chem.Eng.Sci.55(2000)4423-4434.
[33]P.Sagaut,Large Eddy Simulation for Incompressible Flows:An Introduction,Springer-Verlag,2006.
[34]R.Firoz Khan,Investigation of Turbulent Flows and Instabilities in a Stirred Vessel Using Particle Image Velocimetry,Ph D Thesis.Loughborough University,UK,2005.
[35]J.Meyers,P.Sagaut,On the model coefficients for the standard and the variational multi-scale Smagorinsky model,J.Fluid Mech.569(2006)287-319.
[36]Z.Li,Y.Bao,Z.Gao,PIV experiments and large eddy simulations of single-loop flow fields in Rushton turbine stirred tanks,Chem.Eng.Sci.66(2011)1219-1231.
[37]J.Min,Z.Gao,Large eddy simulations of mixing time in a stirred tank,Chin.J.Chem.Eng.14(2006)1-7.
[38]R.Zadghaffari,J.S.Moghaddas,J.Revstedt,Large-eddy simulation of turbulent flow in a stirred tank driven by a Rushton turbine,Comput.Fluids39(2010)1183-1190.
[39]J.Smagorinsky,General circulation experiments with the primitive equations,Mon.Weather Rev.91(1963)99-164.
[40]A.Gabriele,A.W.Nienow,M.J.H.Simmons,Use of angle resolved PIV to estimate local specific energy dissipation rates for up-and down-pumping pitched blade agitators in a stirred tank,Chem.Eng.Sci.64(2009)126-143.
[41]A.Delafosse,M.L.Collignon,M.Crine,D.Toye,Estimation of the turbulentkinetic energy dissipation rate from 2D-PIV measurements in a vessel stirred by an axial Mixel TTP impeller,Chem.Eng.Sci.66(2011)1728-1737.
[42]Ansys,User's Guide(Central Resource Park,10 Cavendish Court,Lebanon,USA)2009.
[43]M.Jenne,M.Reuss,A critical assessment on the use ofk-ɛ turbulence models for simulation of the turbulent liquid flow induced by a Rushton-turbine in baffled stirred-tank reactors,Chem.Eng.Sci.54(1999)3921-3941.
[44]J.A.Delgadillo,R.K.Rajamani,A comparative study of three turbulence-closure models for the hydrocyclone problem,Int.J.Miner.Process.77(2005)217-230.
[45]F.Kaya,I.Karagoz,Performance analysis of numerical schemes in highly swirling turbulent flows in cyclones,Curr.Sci.94(2008)1273-1278.
[46]N.F.Aljuwayhel,G.F.Nellis,S.A.Klein,Parametric and internal study of the vortex tube using a CFD model,Int.J.Refrig.28(2005)442-450.
[47]M.Raffel,Particle Image Velocimetry:A Practical Guide,First,Springer,Berlin,2007.
[48]R.J.Weetman,J.Y.Oldshue,Power, flow and shear characteristics of mixing impellers,Proceeding 6th Eur.Conf.Mix,Italy 1988,pp.43-50.
[49]S.M.Kresta,P.E.Wood,The flow field produced by a pitched blade turbine:Characterization of the turbulence and estimation of the dissipation rate,Chem.Eng.Sci.48(1993)1761-1774.
 Chinese Journal of Chemical Engineering2018年5期
- Chinese Journal of Chemical Engineering的其它文章
- Bioregeneration of spent activated carbon:Review of key factors and recent mathematical models of kinetics
- CFD simulations of quenching process for partial oxidation of methane:Comparison of jet-in-cross- flow and impinging flow configurations☆
- Quantifying growth and breakage of agglomerates in fluid-particle flow using discrete particle method☆
- Coupling simulation of fluid structure interaction in the stirred vessel with a pitched blade turbine☆
- An integrated model for predicting the flame propagation in crimped ribbon flame arresters☆
- Super-hydrophobic and super-lipophilic functionalized graphene oxide/polyurethane sponge applied for oil/water separation☆
