Composition control and temperature inferential control of dividing wall column based on model predictive control and PI strategies☆
Jianxin Wang ,Na Yu ,Mengqi Chen ,Lin Cong ,Lanyi Sun ,*
1 State Key Laboratory of Heavy Oil Processing,College of Chemical Engineering,China University of Petroleum(East China),Qingdao 266580,China
2 College of Information and Control Engineering,China University of Petroleum(East China),Qingdao 266580,China
1.Introduction
Distillation is a wildly used yet energy intensive separation technology in chemical industry.Given the high energy requirement,which accounts for over 50%of plant operating costs[1],a great number of researches have been done to improve the thermodynamic efficiency of distillation process.As is shown in Fig.1,the separation for a ternary mixture has evolved from conventional distillation sequence to Petlyuk configuration and finally developed into the more integrated dividing wall column(DWC).
DWCis considered as a promising process intensification technology due to its potential to significantly reduce both energy requirement and equipment investment as well as an additional benefit of reducing required installation space[2-5].Despite of all the remarkable advantages mentioned above,the highly interactive nature of DWC poses new challenges in terms of operability and controllability[3].DWC has two more manipulated variables compared to the conventional distillation sequence:vapor and liquid split ratios,which need to be adjusted carefully during operation.What's more,the DWC integrates two columns into a single shell and eliminate the use of a reboiler and a condenser,causing the loss of degrees of freedom and strong interactions among variables.PI control is the most wildly used multi-loop control strategy in process industry.It calculates the control actions based on the linear combination of current and past deviations of the controlled variables.For the control of highly coupled nonlinear process like DWC,the PI strategy tends to deliver a relatively poor control quality due to the strong interactions between different control loops.Model predictive control(MPC)is an advanced control strategy.It obtains the control actions by solving an optimization problem based on a predictive model.Receding horizon optimization and feedback correction are also incorporated in the MPC algorithm to make up for the inaccuracy of the predictive model,which assures that MPC can be applied to the nonlinear and time varying process.Besides,it is a multi-input multi-output control scheme.Unlike the PI strategy,MPC takes into account the effect of all the manipulated variables on all the controlled variables simultaneously and therefore handles well the interactions between variables.All the features mentioned above make MPC a good candidate for the control of DWC.
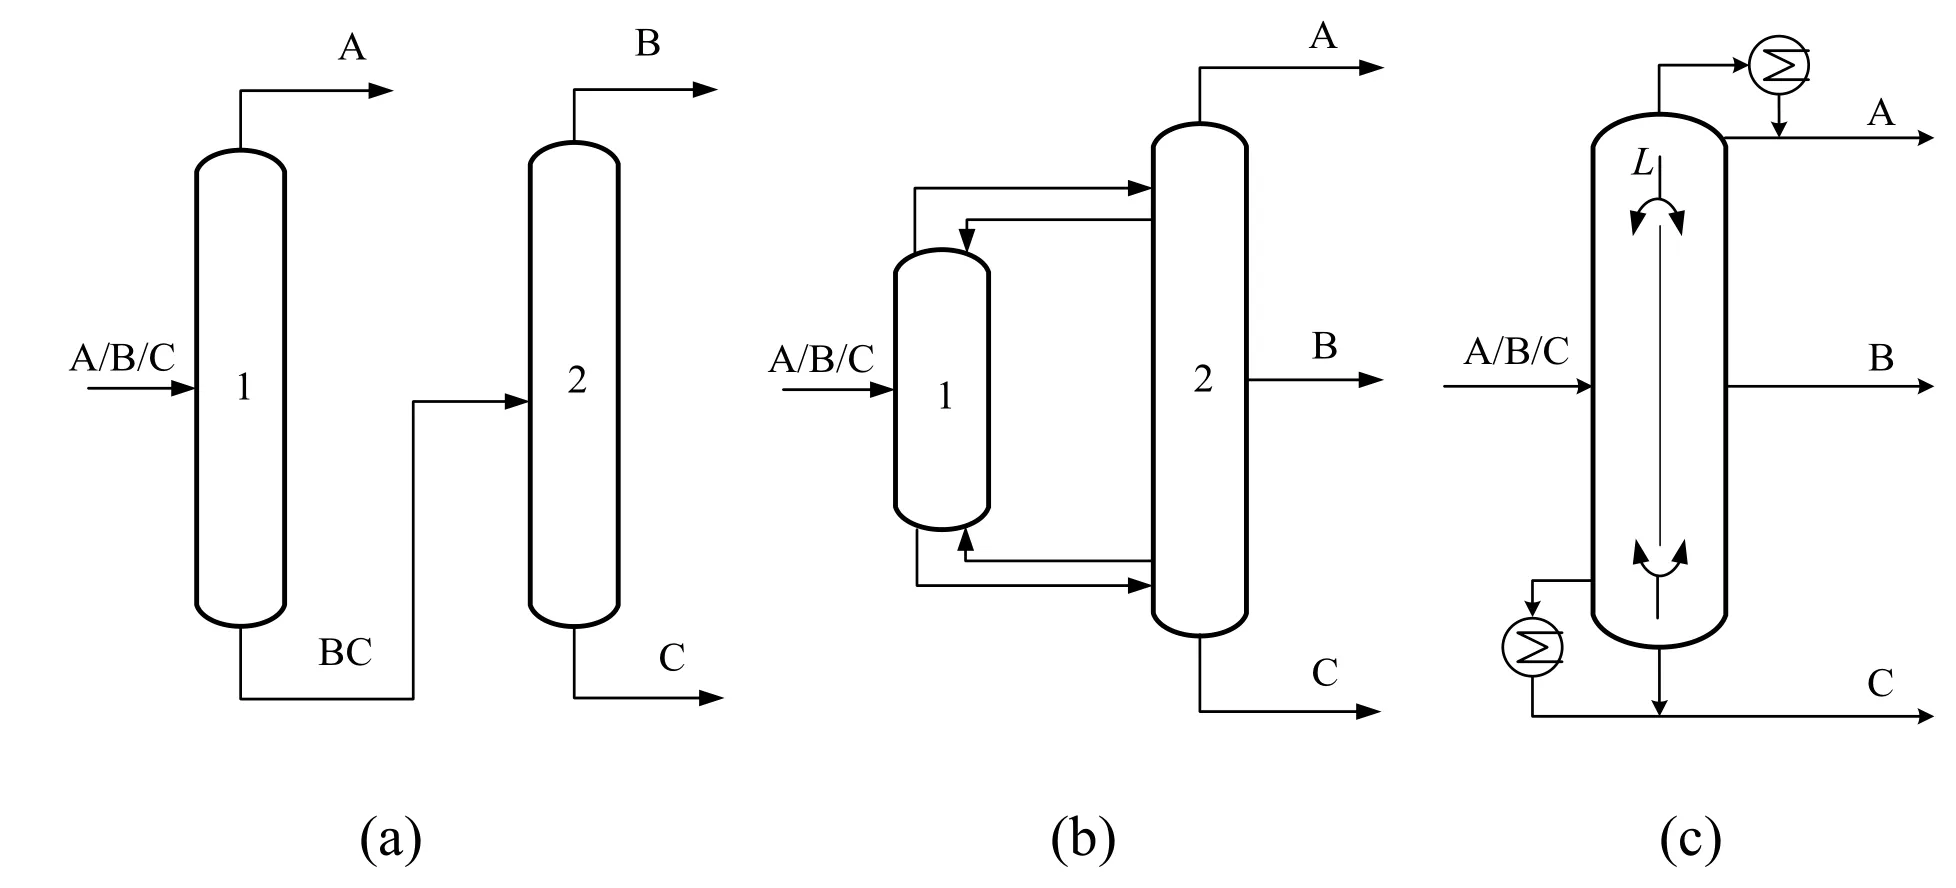
Fig.1.Separation of a ternary mixture via(a)conventional distillation sequence,(b)Petlyuk configuration,(c)dividing wall column.
There have been a large number of literatures addressing the control of DWC.Many of the mare based on the multi-loop PI strategies.Mutalib and Smith[6]established two PI schemes for the control of DWC.Simulation result showed that stable control was achievable by both control schemes.Wang and Wong[7]explored the control of DWC based on PI schemes,demonstrating that there is a trade-off between energy efficiency and controllability.Ling and Luyben[8,9]studied the composition control and temperature control of the DWC for separating benzene/toluene/xylene(BTX)ternary mixture based on PI strategies.Bucket al.[10]applied decentralized PI schemes to a pilot DWC and demonstrated the effectiveness of the schemes.Kiss and Rewagad[11]compared the performance of four PI control structures for the control of DWC.Xiaet al.[12]con firmed the feasibility of using decentralized temperature and differential temperature control structures for the extractive DWC.Sunet al.[13]explored the control of extractive DWC for separating benzene/cyclohexane mixtures based on PI strategies.Qianet al.[14]applied PI schemes to the control of reactive DWC for selective hydrogenation and separation of C3 stream.Liet al.[15]explored the decentralized control of reactive DWC for hydrolysis of methyl acetate.Still there are some literatures investigating the control of DWC using MPC.Adrianet al.[16]investigated the model predictive control of the DWC for separating butanol/pentanol/hexanol system through experimental studies.Bucket al.[17]developed MPC for the operation of a pilot DWC for separating fatty alcoholsn-hexanol,n-octanol,andn-decanol.Rewaged and Kiss[18]considered the separation of BTX in a DWC as a case study,exploring the control performances of conventional PI strategy and MPC scheme.Hernández and Chinea-Herranz[19]applied both PI strategy and MPC to a DWC.The separated ternary mixture consists ofn-pentane,n-hexane,andn-heptane.Dohareet al.[20]chose the DWC for a BTX system as a case study and investigated the control behavior of MPC.Rodríguezet al.[21]applied MPC to the extractive DWC for bioethanol dehydration and the reactive DWC for the hydrolysis of methyl acetate to produce methanol and acetic acid.Another recent study on the application of MPC to reactive DWC is reported by Qianet al.[22].MPC was proposed in their work for the control of the reactive DWC for the selective hydrogenation and separation of the C3 stream in ethylene production.Despite these studies investigate different DWC configurations and various systems,a similar conclusion can be reached that MPC generally performs better than the PI strategy.However,it should be pointed out that most of the above work focuses on composition control.Only a few papers deal with the temperature inferential control of DWC based on MPC.The absence of a comparison between the performances of MPC and PI strategies for the temperature inferential control of a pressure-driven DWC process justifies the work we did here.The aim of this work is to apply MPC to the control of the DWC for separating ethanol,n-propanol,andn-butanol ternary mixture and evaluate its control performance by comparison to its equivalent PI strategy.Both composition control and temperature inferential control are considered.PI control study is implemented in Aspen Dynamics.MPC control study is implemented by a joint simulation between Aspen Dynamics and Simulink in Matlab.The weights of controlled variables(wy)and manipulated variables variations(wΔu)for MPC are obtained by solving a multiobjective optimization problem through genetic algorithm(GA).
2.Process Description
The separation of ethanol(A),n-propanol(B),andn-butanol(C)is carried out in a DWC.As is shown in Fig.2,a two-column model has been built as an equivalent flow sheet of the DWC.The RadFrac model in Aspen Plus is used for simulating the prefractionator(PC)and the main column(MC).Equilibrium stage model is adopted during simulation,which assumes the vapor and liquid phases leaving any stage are in thermodynamic equilibrium with each other.The assumption of no heat transfer across the dividing wall is also maintained.Pumps and valves have been added for a pressure-driven dynamic simulation,which is more in agreement with practical application than a flow driven one.All valves are provided with sufficient pressure drop for effective dynamic controllability.Two fictitious compressors and pumps have been added to compensate the pressure drop.
The fresh feed comprising 20-mol%ethanol,60-mol%n-propanol,and 20-mol%n-butanol is fed into the prefractionator at a flow rate of 100 kmol·h-1.Ethanol is distilled at the top of the main column,andn-propanol is withdrawn as side stream of the main column,whilenbutanol is obtained as bottom product of the main column.Product purities are set to be 98 mol%.NRTL thermodynamic package is selected to account for the nonideal liquid phase behavior[7].The initial values for all the parameters of the DWC are estimated from the conventional distillation sequence to obtain a converged Aspen Plus simulation.Sensitivity analysis is then implemented to find the parameters giving the minimum energy requirement.The flow rates of liquid(L1)and vapor(V2)are varied over a wild range.The reboiler duty which satisfies the specifications on the product purities is calculated accordingly.The simulation result shows that the range ofL1from 30 to 50 andV2from 74 to 82 are in the feasible region for a converged simulation.Fig.3 illustrates the effect ofL1andV2on the reboiler duty.The minimum energy requirement occurs with theL1of 38.82 kmol·h-1andV2of 78.91 kmol·h-1.Split ratio is defined as the ratio of the flow directed to the prefractionator to the flow directed to the main column.The resulting liquid split ratio(βL)and vapor split ratio(βV)are 0.385 and 1.177,respectively.The optimized parameters of the DWC are shown in Table 1.
3.Control of the Dividing Wall Column

Fig.2.Thermodynamically equivalent flow sheet of the DWC.
In this section,dynamic control of the proposed DWC will be explored.Before converting the steady-state simulation to a pressure driven dynamic simulation,it is necessary to specify the size of the equipment.The tray sizing tool in Aspen Plus is used to calculate the column diameters.The re flux drum and the sump of each column are sized to provide 5-min holdup when half full.Most valves are specified to have pressure drops of 300 kPa with the valve half open at the design flow rate.
3.1.PI strategy
The conventional PI strategy comprises different control loops that can be divided into two levels.One is inventory control,which consists of liquid level, flow rate,and pressure control.It is used to guarantee the safety operation of the process since it is closely related to the material balance in the process.The other one is quality control,including composition and temperature control.It is used to maintain the product purity directly or indirectly.

Fig.3.Reboiler duty vs.liquid flow rate for different values of the vapor flow rate.
3.1.1.Composition control based on PI strategy
In this section,a composition control strategy with PI controllers is devised for the DWC.Following the report from Ling and Luyben[8],the liquid split ratio(βL)is used as a manipulated variable to control the composition of the heavy component at the top of the prefractionator(yC).Then,there are totally 9 manipulated variables and 9 controlled variables.The other controlled variables include the top stage pressure of the prefractionator(P1)and main column(P2),the liquid level in the re flux drum of the main column(LD2),the sump level of the prefractionator(LB1)and main column(LB2),the mole fractions of ethanolin distillate(xA),n-propanolin the side stream(xB),andn-butanol in the bottom product(xC).The rest of the manipulated variables include the condenser duty(QC)and reboiler duty(QR)of the main column,the re flux rate of the main column(L),the brake power of the compressor C1(m1),the valve positions that affect the liquid flow rateL2(m2),distillate flow rateD(m3),side stream flow rateS(m4)and bottom flow rateB(m5).The key to an effective controlstructure lies in the variable pairing.There are many possible combinations between manipulated variables and controlled variables.However,only a few of them make sense.
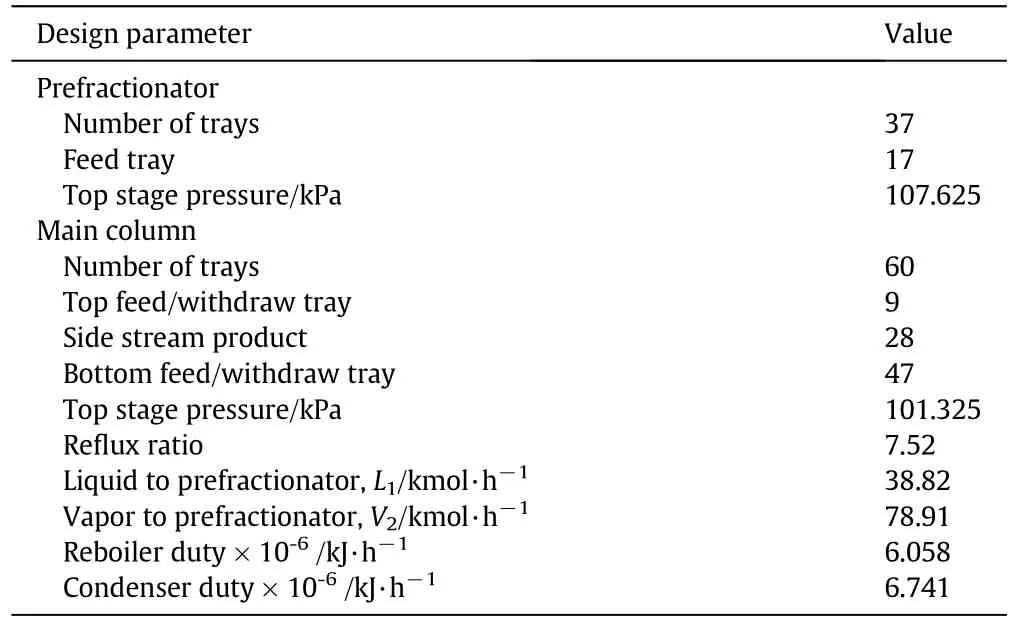
Table 1 Parameters for the DWC
The relative gain array(RGA)has been wildly used for interaction analysis and variable pairing in the open literature[6,7,15].It is defined as the ratio of the open-loop gain for a selected output when all loops on the process are open to its open-loop gain when all the other loops are closed.The pairings of controlled and manipulated variables leading to a positive value of relative gains close to unity are preferred according to the RGA criterion.Table 2 gives the RGA analysis results for some of the controlled variables and manipulated variables.

Table 2 RGA analysis for some of the controlled variables and manipulated variables
According to the RGA analysis,the pairing of(xA-m3,xB-m4,xC-m5,yC-βL,LD2-L,LB2-QR)presents less interaction.However,the variable pairing on the basis of avoiding interaction among variables does not necessarily lead to a good disturbance rejection ability[23].The simulation results also show that controlling the liquid levels in the main column(LD2,LB2)by manipulating the re flux rate(L)and reboiler duty(QR)suffers from an oscillatory response and longer settling times,which is consistent with the report from Kiss and Rewagad[11].Other possible variable pairings including(xA-m3,xB-m4,xC-QR,yC-βL,LD2-L,LB2-m5),(xA-L,xB-m4,xC-m5,yC-βL,LD2-m3,LB2-QR)and(xA-L,xB-m4,xC-QR,yC-βL,LD2-m3,LB2-m5)are therefore considered and tested through simulation.Finally,the variable pairing of(xA-L,xB-m4,xC-QR,yC-βL,LD2-m3,LB2-m5)is adopted,which results in less oscillation and shorter settling times.To reduce the transient deviation in bottoms and distillate purity,two feed-forward ratio schemes(QR/FandL/F)are employed.The proposed control structure is presented in Fig.4.
In the main column,the liquid level in the re flux drum is controlled by manipulatingm3,and the sump level is controlled by manipulatingm5.In the prefractionator,the sump level is controlled by manipulatingm2.The PI controllers are used for liquid level control loops with a proportional gain of 2 and an integral time of 9999 min.The top stage pressure of the prefractionator(P1)is maintained by manipulatingm1.The pressure at the top of the main column(P2)is held constant by adjusting the condenser duty(QC).The PI controller parameters for the pressure control are set toKC=20 and τI=12 min.Fresh feed flow rate is controlled with a PI controller ofKC=0.5 and τI=0.3 min.
Then-butanolpurity in the bottomproduct(xC)is maintained by manipulating the ratio of reboiler duty to the feed flow rate(QR/F).Thenpropanol purity in the side stream(xB)is kept at the set point value by manipulatingm4.The ethanolpurity in the top product(xA)is controlled by manipulating the ratio of the re flux rate to the feed flow rate(L/F).The composition ofn-butanol at the top of the prefractionator(yC)is controlled by manipulating the liquid split ratio(βL).
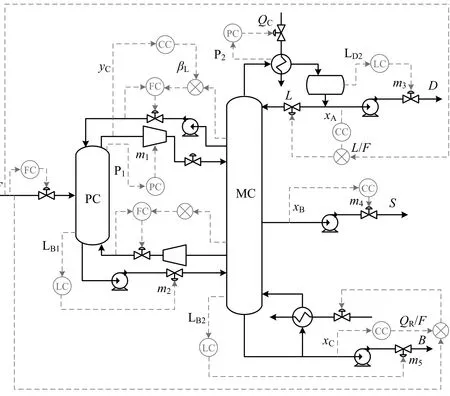
Fig.4.Composition control structure based on PI loops.
Since the composition measurements often suffer from large delays in an industrial environment,a 3-min dead time is inserted into the four composition control loops to improve the realism of the simulation[13].Relay-feedback test is carried out to determine the ultimate gain and period.Tyreus-Luyben tuning rules are used to calculate proportional gain and integral time.Tuning results for the four composition controllers are shown in Table 3.

Table 3 Tuning results for composition controllers
3.1.2.Temperature inferential control based on PI strategy
In this section,temperature inferential control is considered for wider industrial applications.A classic three-point temperature control structure is built.The sensitivity criterion is used to select temperature sensitive trays.It is performed as follows:theL,QRandSare manipulated for the purpose of control.A small change(0.1%)is made inLwithQRandSbeing fixed.Aspen Plus simulation is run,giving a new temperature profile.The temperature change of trayi(ΔTi)is obtained by subtracting the initial temperature from the new one.Dividing(ΔTi)by the change ofLgives the steady-state gain on trayi.Repeating this procedure for the other manipulated variables gives other two gains.The steady-state gains are plotted against tray number in Fig.5.The trays with relatively large gains reflect the appropriate locations to be temperature-controlled.The controlled temperatures are selected at stages 8(T8),36(T36),and 55(T55).As shown in Fig.5,both T8and T55are sensitive toLandQR,but a change in the re flux rateLtakes a longer time to affect the temperature on the 55th tray because of liquid hydraulic lags.The principle of proximity is therefore followed to determine the variables pairing.Fig.6 shows the proposed temperature inferential control structure.
T8in the main column is controlled by manipulating the ratio of the re flux rate to the feed flow rate(L/F).T36and T55in the main column are maintained by manipulatingm4and the ratio of the reboiler duty to the feed flow rate(QR/F),respectively.Comparing with composition control,temperature control brings in shorter drag time.One minute of dead time is inserted into all temperature control loops to fit the practical operation[12].The settings for the inventory control loops including pressure,liquid level and feed flow rate control are the same as those of the composition control structure mentioned earlier.Table 4 lists the tuned parameters of the temperature controllers.
3.2.Theory of model predictive control
Model predictive control is a model-based optimization algorithm.It optimizes overpfuture sampling periods and calculatesmfuture control actions at each sampling instant.The estimated state variables are used as initial conditions at each sampling instant.The optimal control sequence that minimizes the objective function and fulfills the constraints is obtained at each sampling instant by solving a finite horizon open-loop optimal control problem.Only the first control action in the sequence is applied to the plant.The prediction horizonpand control horizonmthen proceed forward by one sampling interval.The model is updated based on the new measurements and current states at each sampling instant,and then the calculations are repeated,yielding a new control sequence.
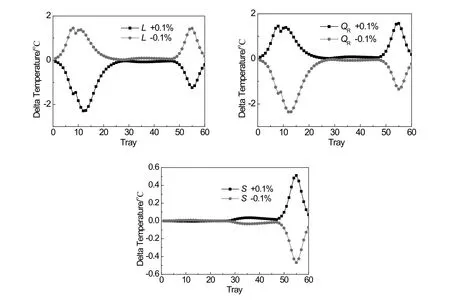
Fig.5.Open-loop sensitivity analysis between manipulated variables and tray temperature changes.
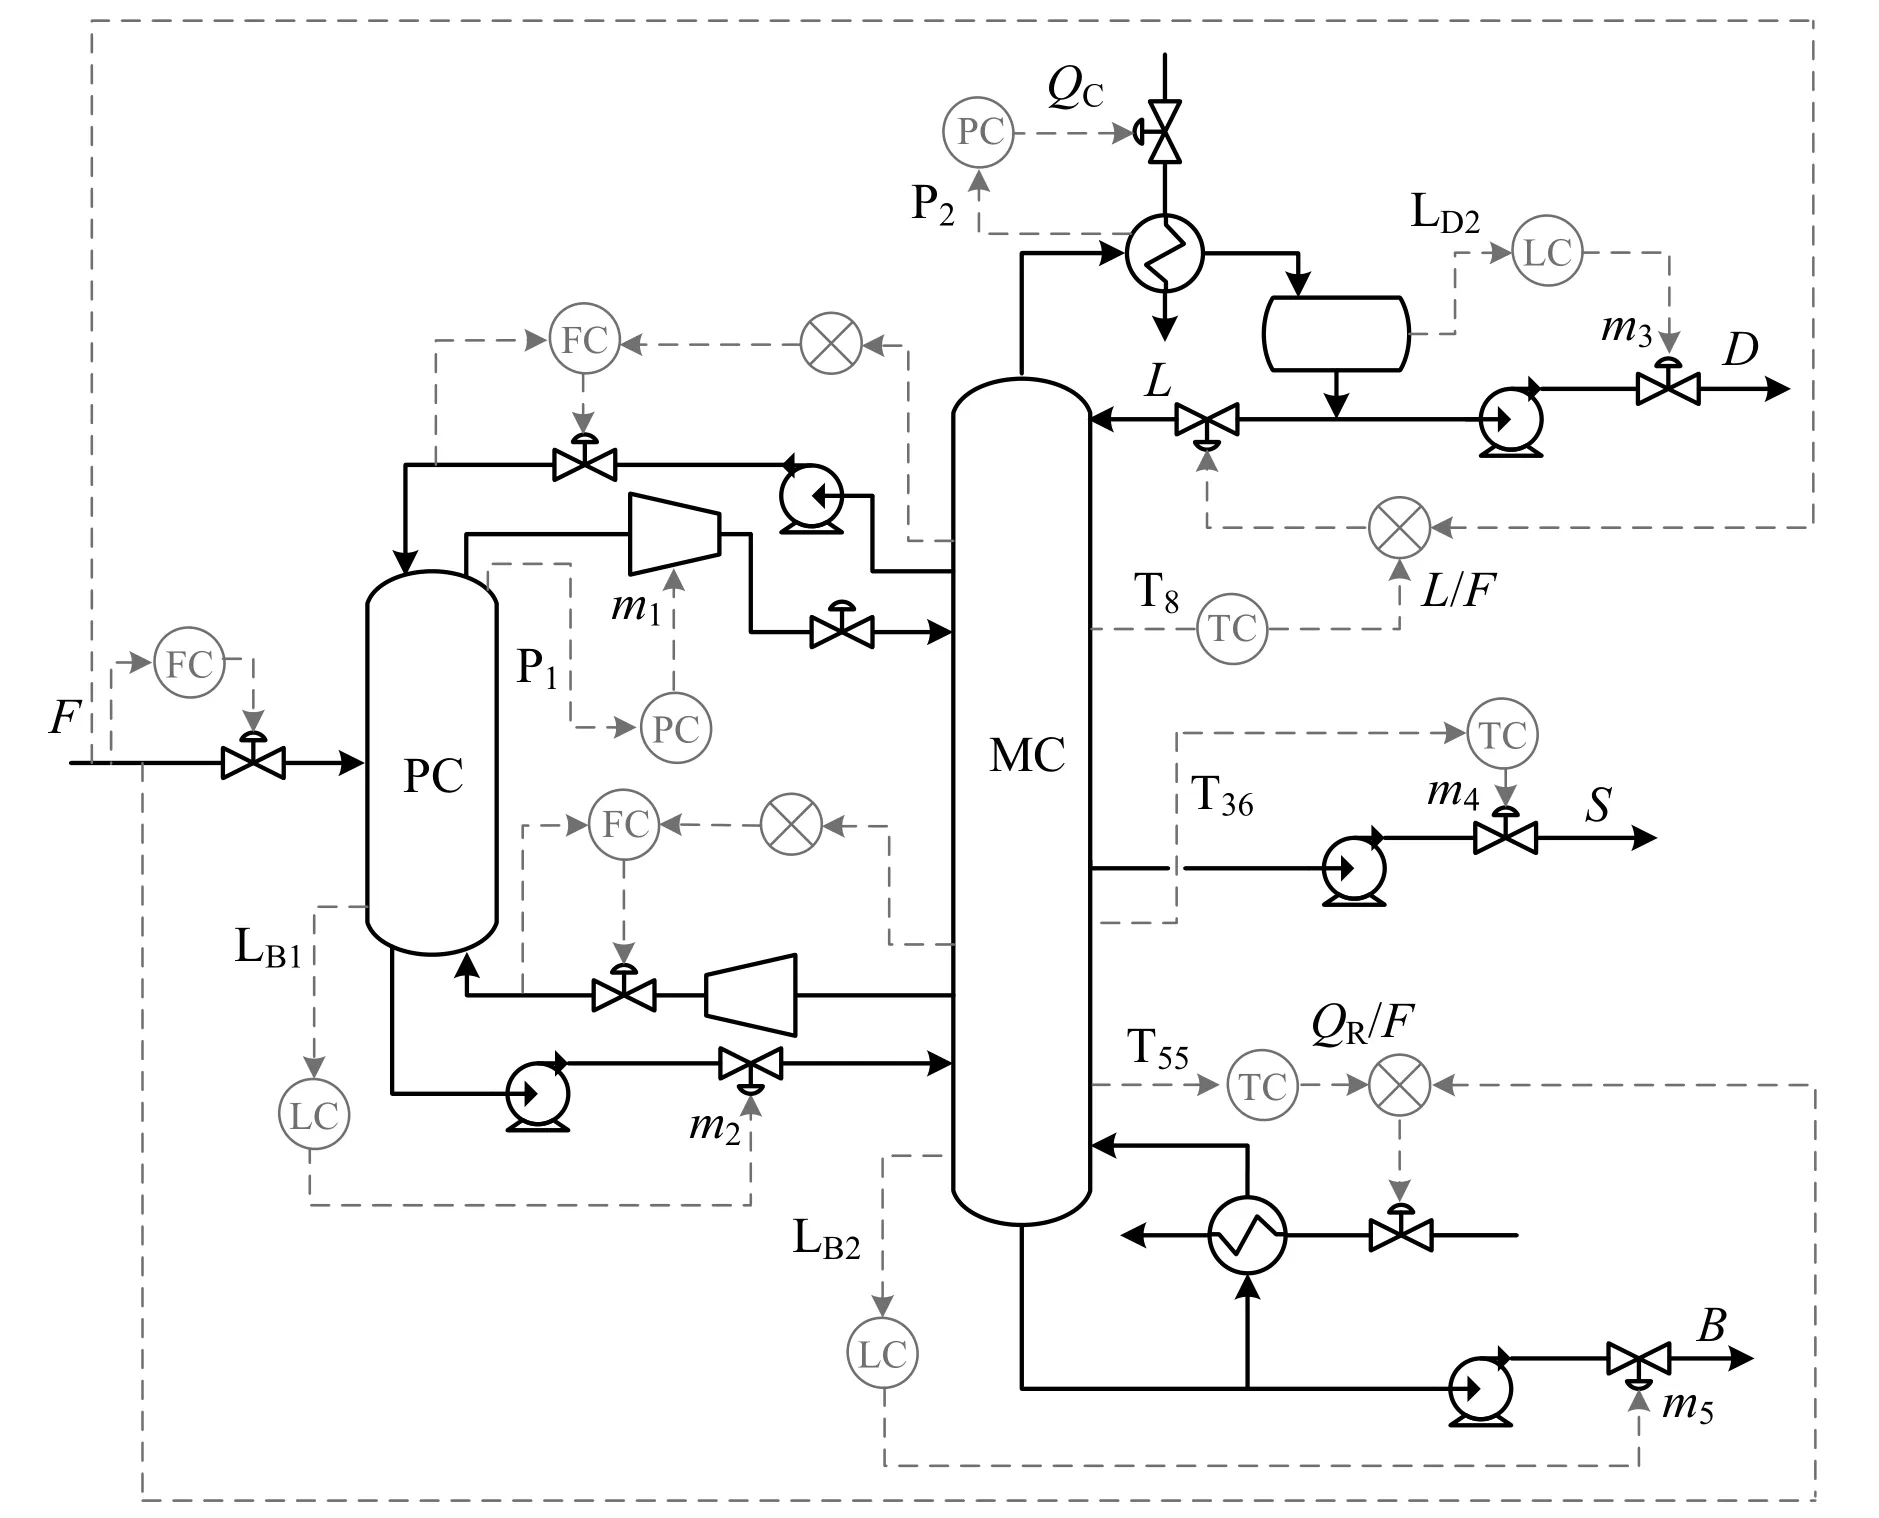
Fig.6.Temperature inferential control structure based on PI loops.
In this study,a state space model,which is compact and convenient for representing multivariable systems,is used to describe the real plant model:

where x(k)represents the vector of state variables;u(k)is the vector of manipulated variables;v(k)denotes the vector of measured disturbances;d(k)is the vector of unmeasured disturbances;ym(k)refers to the vector of measured outputs;yu(k)indicates the vector of unmeasured outputs.The model matrices A,B,C,D are obtained by linearization of the rigorous,nonlinear dynamic model built in Aspen Dynamics through the Control Design Interface(CDI)tool.For the process studied here,the resulting linear model has over 500 state variables,representing the total enthalpy at each tray,molar quantity of each component at each tray,and variables of other blocks such asvalves.To avoid the difficulty of implementing the calculation with such a large number of variables,model reduction is carried out to reduce the number of state variables,which speeds up the calculations with negligible effect on prediction accuracy.

Table 4 Tuning results for temperature controllers
The optimization problem to be solved at each sampling instant is defined as follows:

In the above equation,mis the control horizon over which the manipulated variables are allowed to change.pis the prediction horizon over which the optimization is performed.The subscriptjdenotes thejcomponent of a vector.(k+i|k)denotes the value predicted for timek+ibased on the information available at timek.r(k)is the current sample of the output reference.
In this work,the sampling interval is set to be small enough to reproduce the total dynamic.The prediction horizonpand control horizonm,which are expressed in the form of the number of sampling intervals,are determined to keep the process stable with less oscillation.
The weightswu,wy,andwΔudetermine the relative penalizations for the deviations of manipulated variables,controlled variables from their nominal values,and manipulated variables variations,respectively.In this work,the number of manipulated variables is equal to that of controlled variables.All the manipulated variables are expected to deviate from their nominal value in order to drive all the controlled variables to the set point values when disturbances occur.Therefore,wuare set to 0.wyandwΔuare determined by a trade off between two opposite aspects.In general,large values ofwyand small values ofwΔuallow the controller to react with aggressive control actions,and shorter settling times can be achieved,but the tendencies for oscillation and overshoots increase.Small values ofwyand large values ofwΔuwill force the controller to behave more conservatively,which may reduce oscillation and overshoots but lead to longer settling times.The tuning of the weights can be defined as a multiobjective optimization problem.A discrete set of the Pareto optimum solution can be obtained by solving the problem.The weights corresponding to a control performance that is not too aggressive and additionally not too defensive can be chosen as the final solution.
In this work,the values ofwyandwΔuare tuned by solving the multiobjective optimization problem through “gamultiobj”function in Matlab.“gamultiobj”uses a controlled elitist genetic algorithm which is a variant of NSGA-II.The sum of squared errors of controlled variables and the sum of squared values of manipulated variables variations are defined as two objective functions:


Fig.8.Pareto optimum solution set for composition control.
For the convenience of weight tuning,all the input and output variables have been converted to a uniform dimensionless scale(0-100)with a nominal value of 50.A base value of 0 is selected for the conversion of all the variables.The model matrices B and C have also been scaled in accordance with the scaled variables.
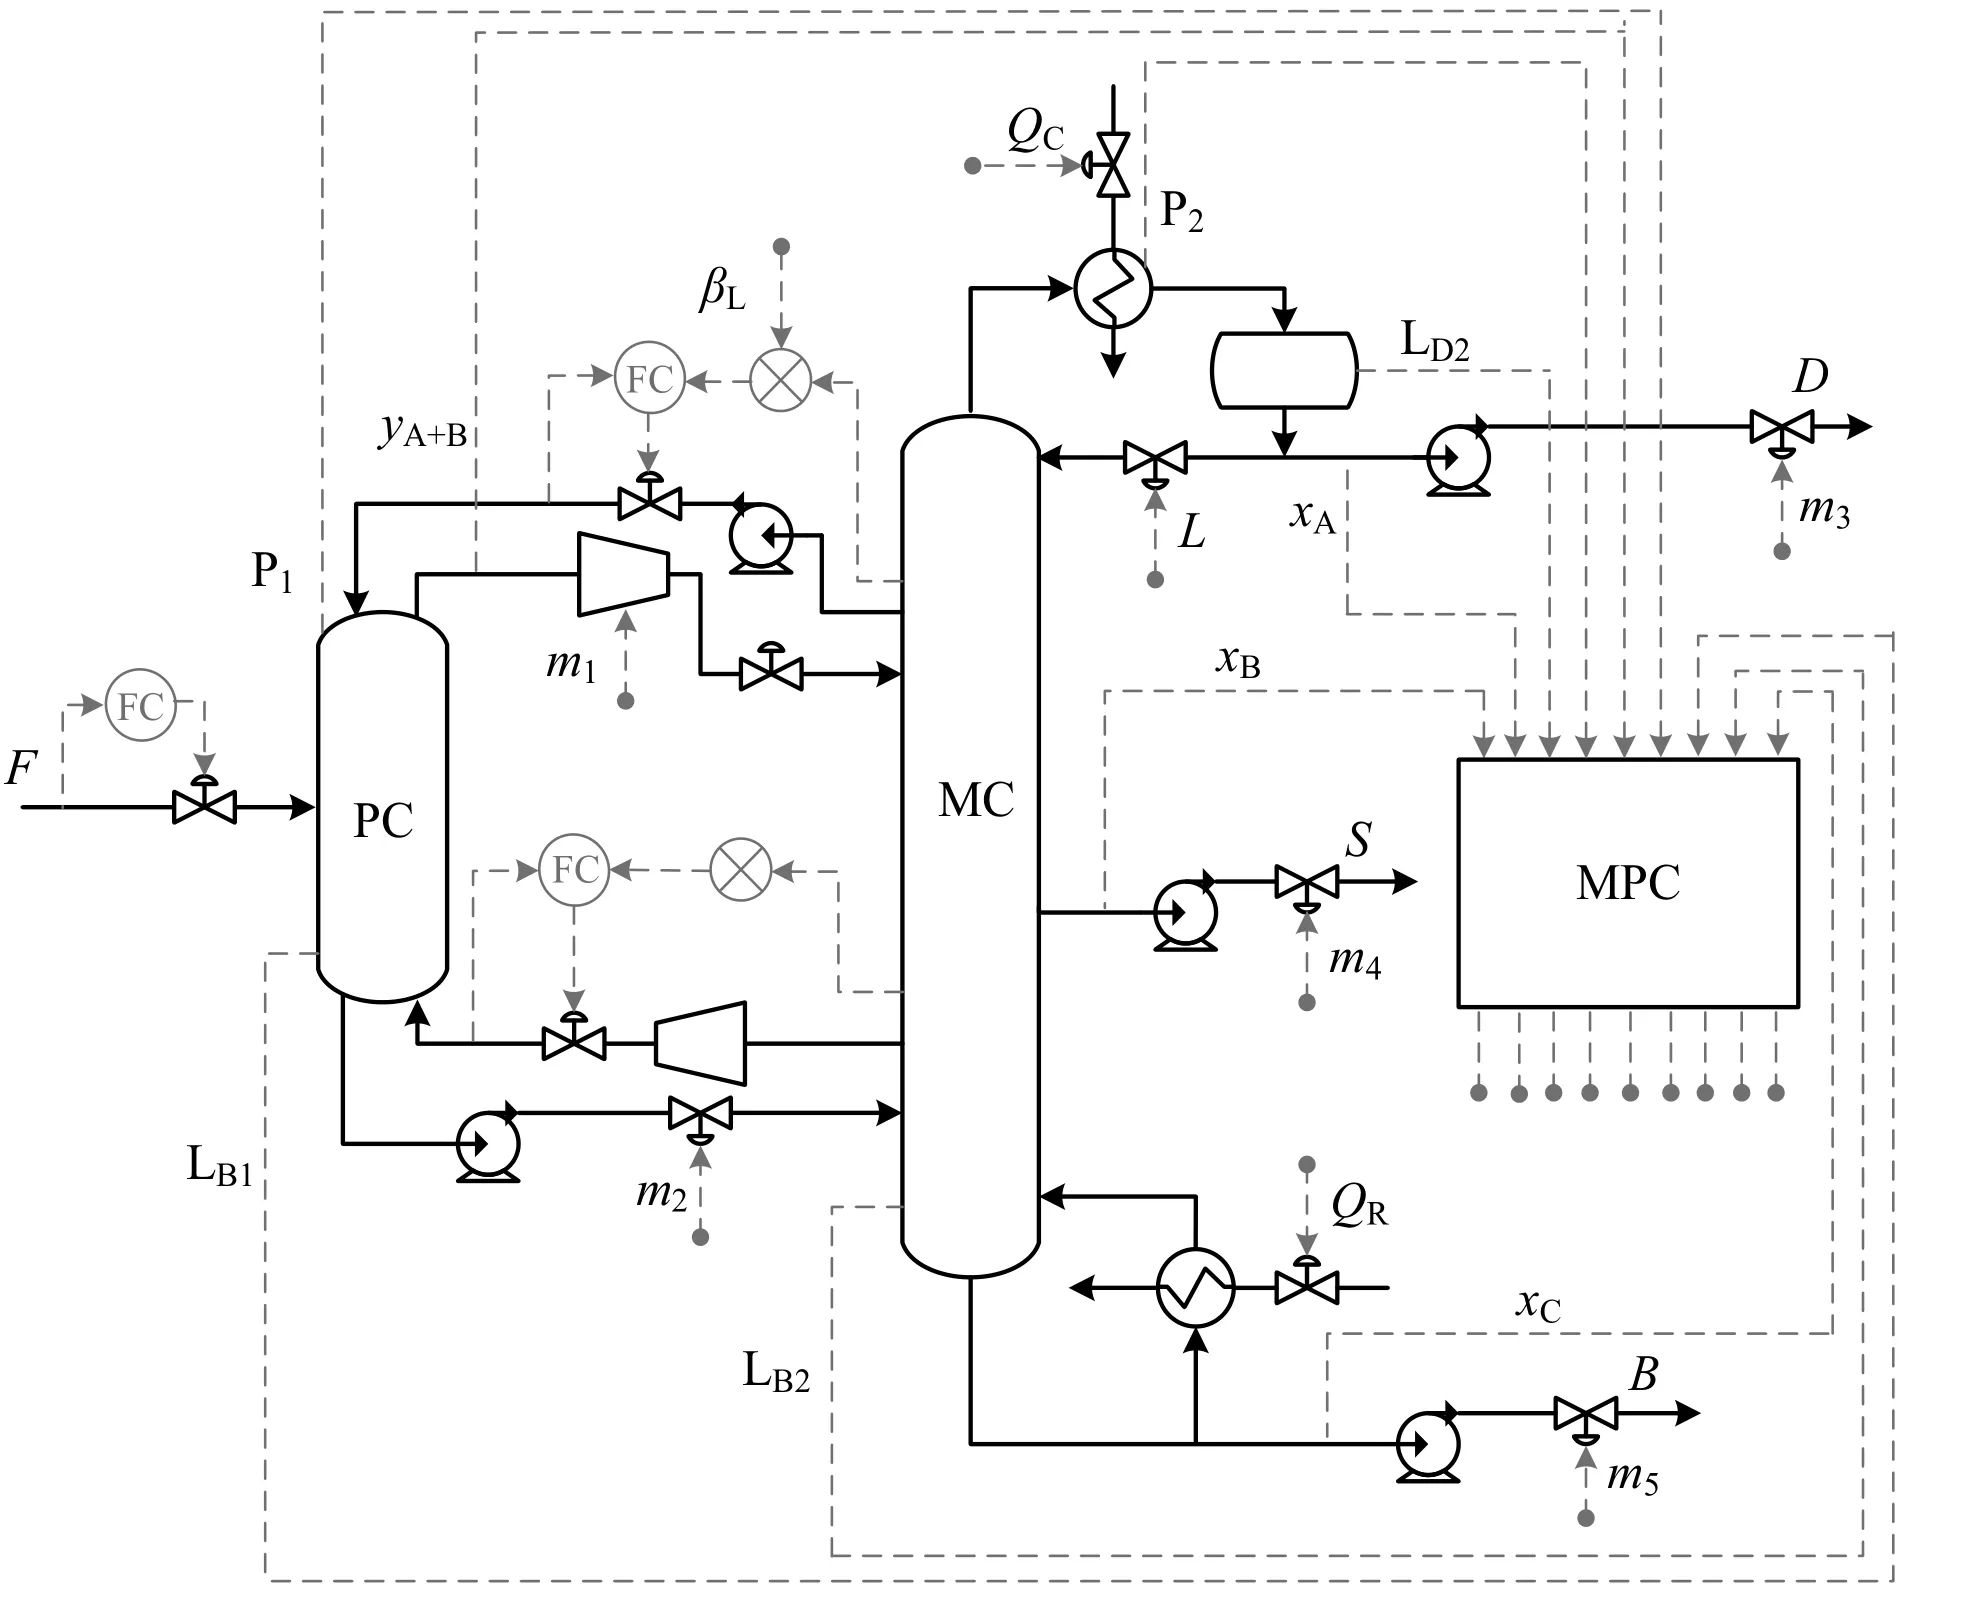
Fig.7.Composition control structure for MPC.

Table 5 Summary of controller parameters for composition control
3.2.1.Composition control based on model predictive control
The composition control structure for MPC is shown in Fig.7.It should be pointed out that the content ofn-butanol at the top of the prefractionator(yC)is at a very low level with a steady state value of 0.0066(mole fraction),and it is sensitive to the disturbances in the process.Relatively large deviation from the steady state value will occur in case of 10%feed disturbances.However,the accuracy of the linear model is usually acceptable around the point where the linearization is carried out.For the case away from the steady-state operating point,the linear model can't approach the complicated nonlinear relationship sufficiently.Since MPC calculates the control sequence based on the linear model and the feedback of the controlled variables,the large variations of the controlled variables combined with the inaccurate linear model may result in an inappropriate control sequence,causing the instability of the process.A solution to the problem is to control the summation of the content of ethanol andn-propanol at the top of the prefractionator(yA+B).Fig.8 shows the resultant Pareto optimum solution set for composition control.The value of obj 1 reflects the control performance of MPC.The value of obj 2 is an indicator of the change rates of manipulated variables.Considering the relative importance of the two objective functions,more emphasis is put on the minimization of obj1 to improve the control performance of MPC.The point corresponding to an obj 1 value of 0.28 and an obj 2 value of 31.24 is chosen as the final solution.The tuning parameters of MPC are listed in Table 5.
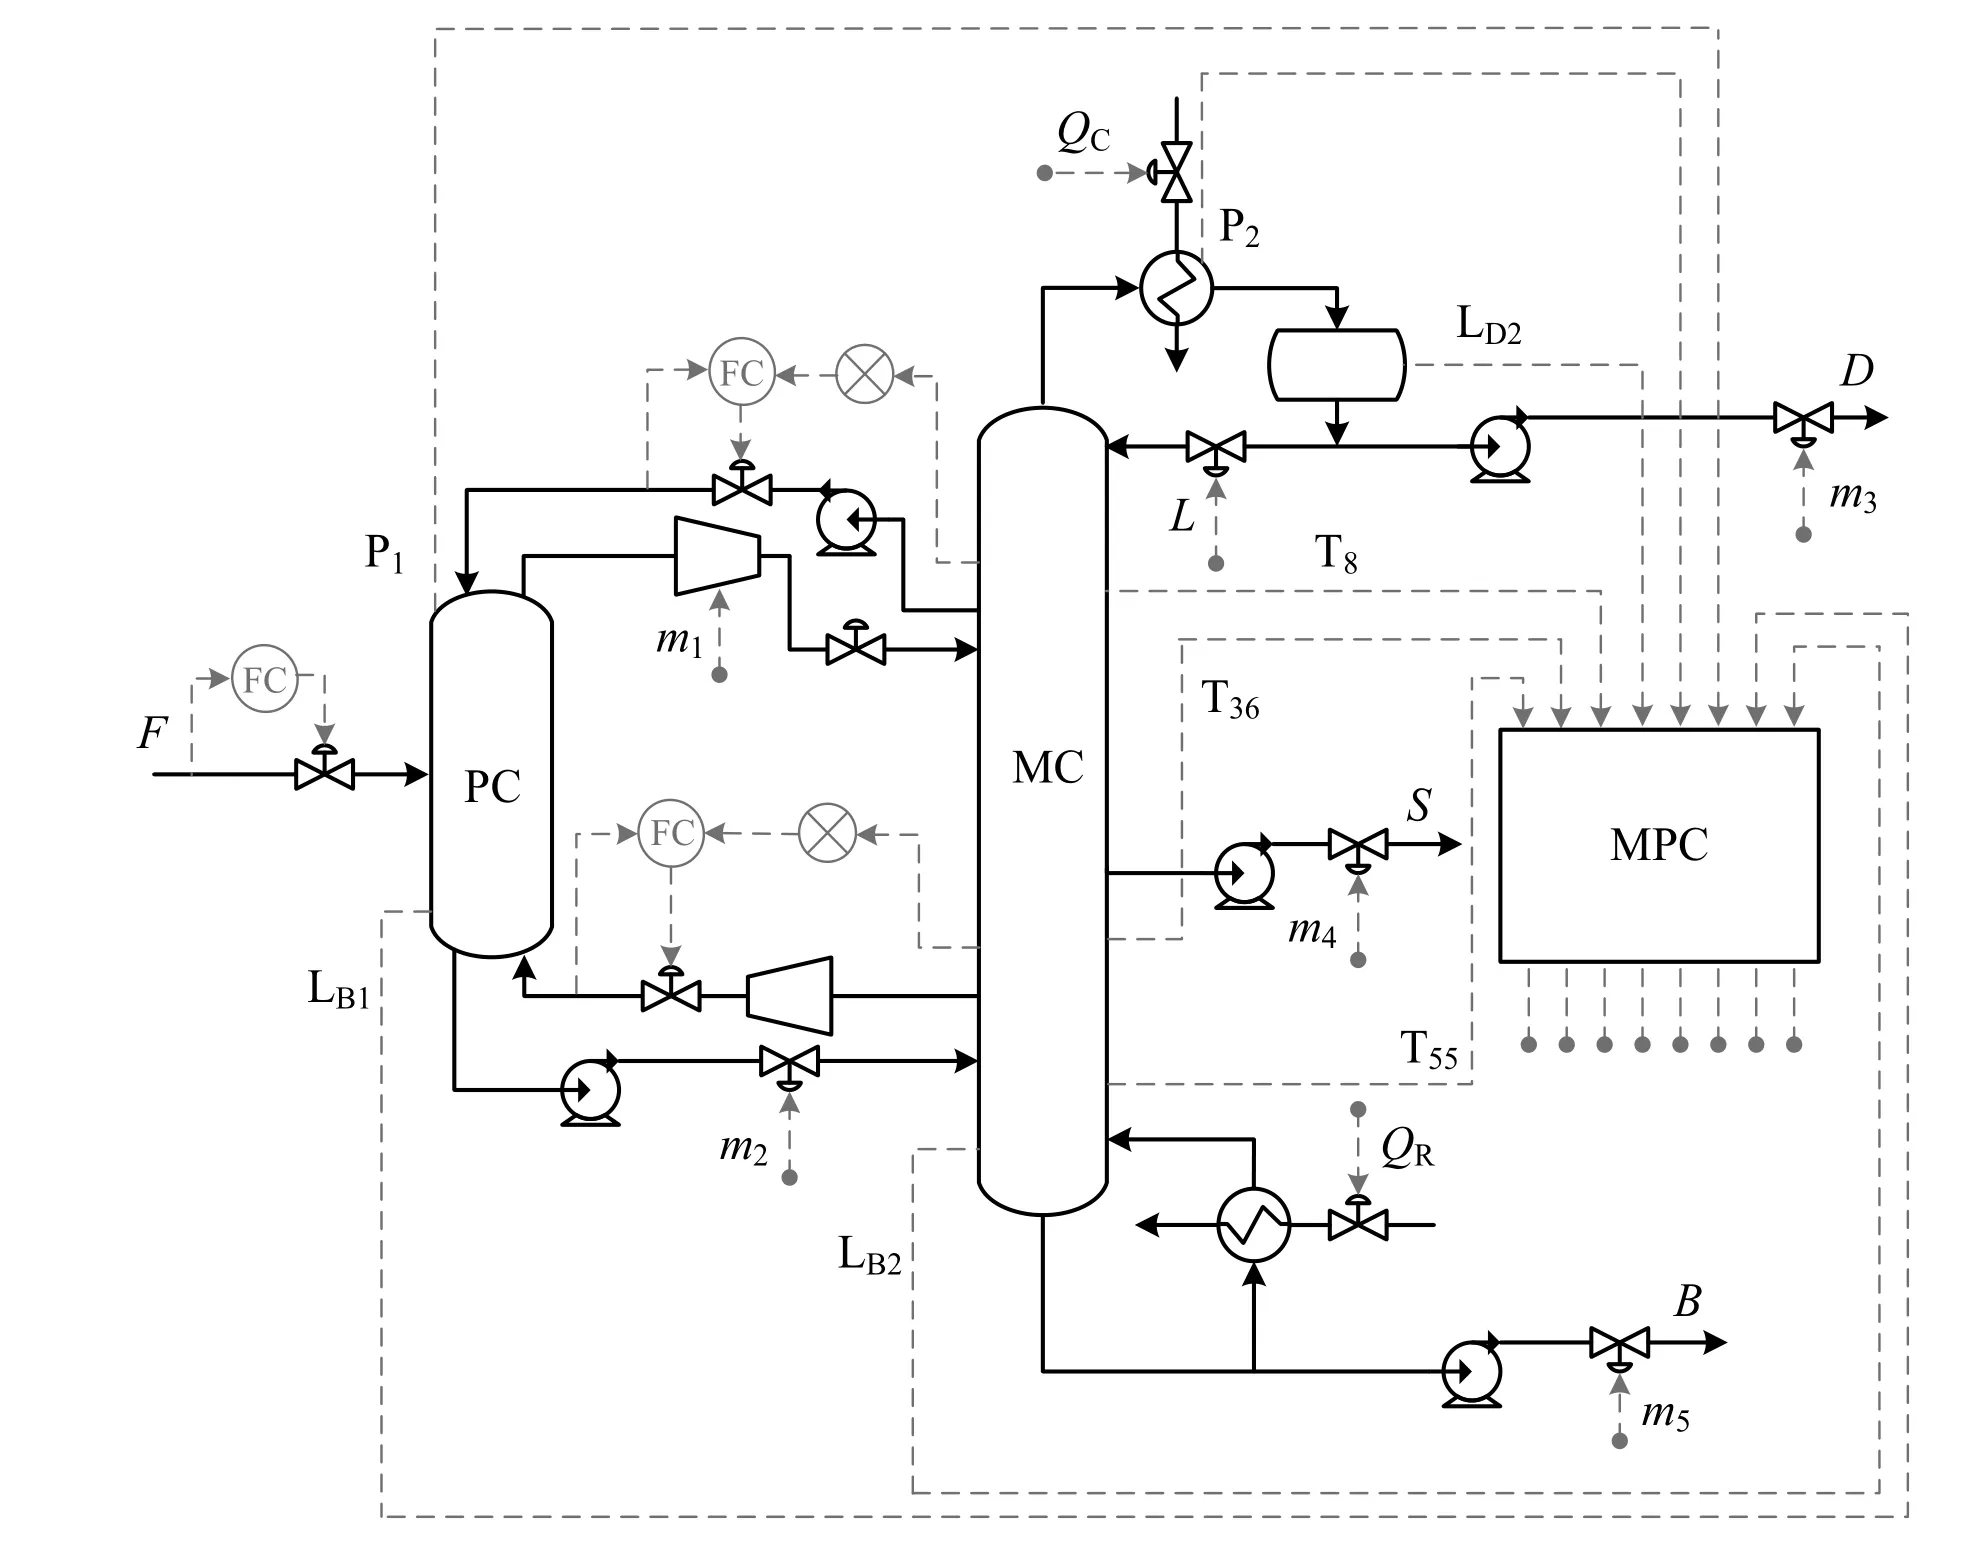
Fig.9.Temperature inferential control structure for MPC.
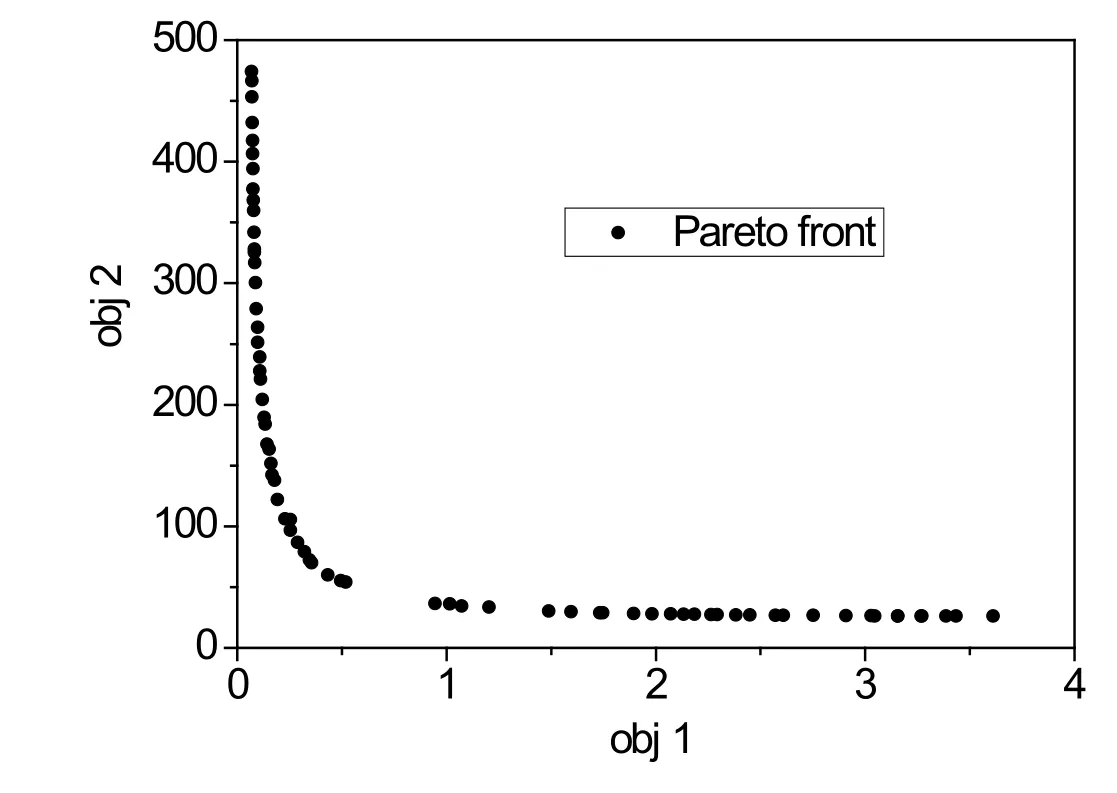
Fig.10.Pareto optimum solution set for temperature inferential control.
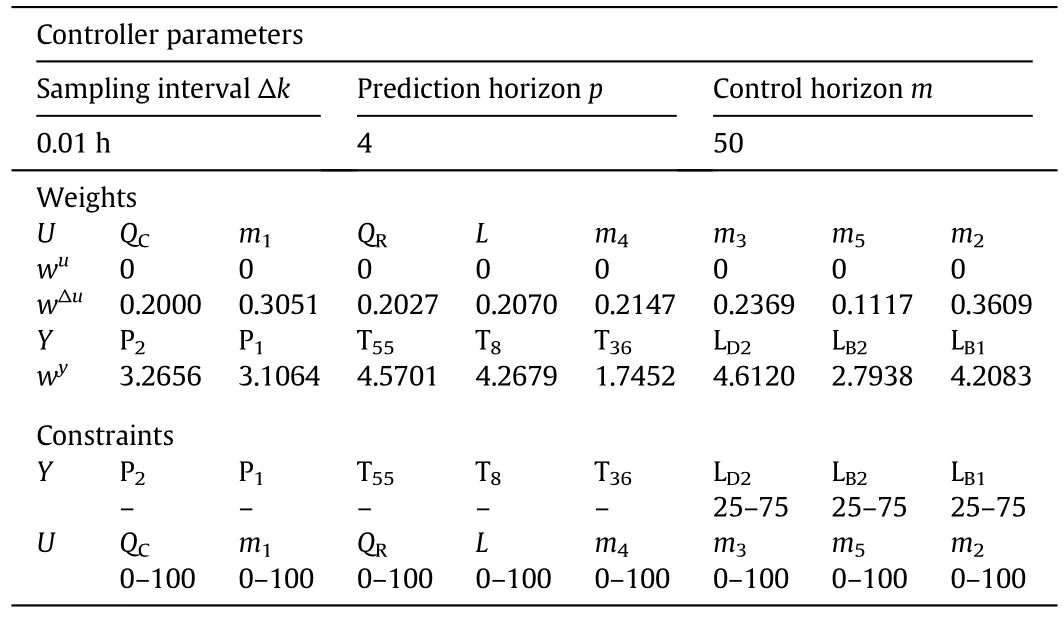
Table 6 Summary of controller parameters for temperature inferential control
3.2.2.Temperature inferential control based on model predictive control
The temperature inferential control structure for MPC and the resulting Pareto optimum solution set are shown in Figs.9 and 10,respectively.The point corresponding to an obj 1 value of 0.0732 and an obj 2 value of 427.47 is chosen as the final solution.The tuning parameters of MPC are listed in Table 6.
4.Results and Discussions
Dynamic simulations are conducted to test the control performance of the proposed MPC scheme and compare it with that of PI scheme;±10%step changes in feed flow rate and feed composition are introduced as persistent disturbances at 0.5 h.
4.1.Composition control
Figs.11 to 14 show dynamic responses of the MPCvs.those of PI strategy for composition control to disturbances in feed flow rate and feed composition.It can be seen that both schemes can achieve the goal to steer the system to the given set points,but MPC shows better performance in maintaining product purities,featured with reduced overshoots,less oscillation and shorter settling times.The responses of the manipulated variables to±10%step changes in feed flow rate are shown in Fig.15.As can be seen,MPC reacts as quickly as the PI strategy to the feed flow rate disturbances,and the manipulated variables move more smoothly and reach new steady states in a shorter time.The following reasons may account for the improved control quality of MPC:(1)MPC takes into account simultaneously the effects of all manipulated variables to all controlled variables;thus,a coordination between manipulated variables is possible,which is helpful to reduce the oscillation.(2)The measured disturbances and the use of the prediction model assure a feed-forward control and optimized control actions.A more stable and superior performance can therefore be obtained.
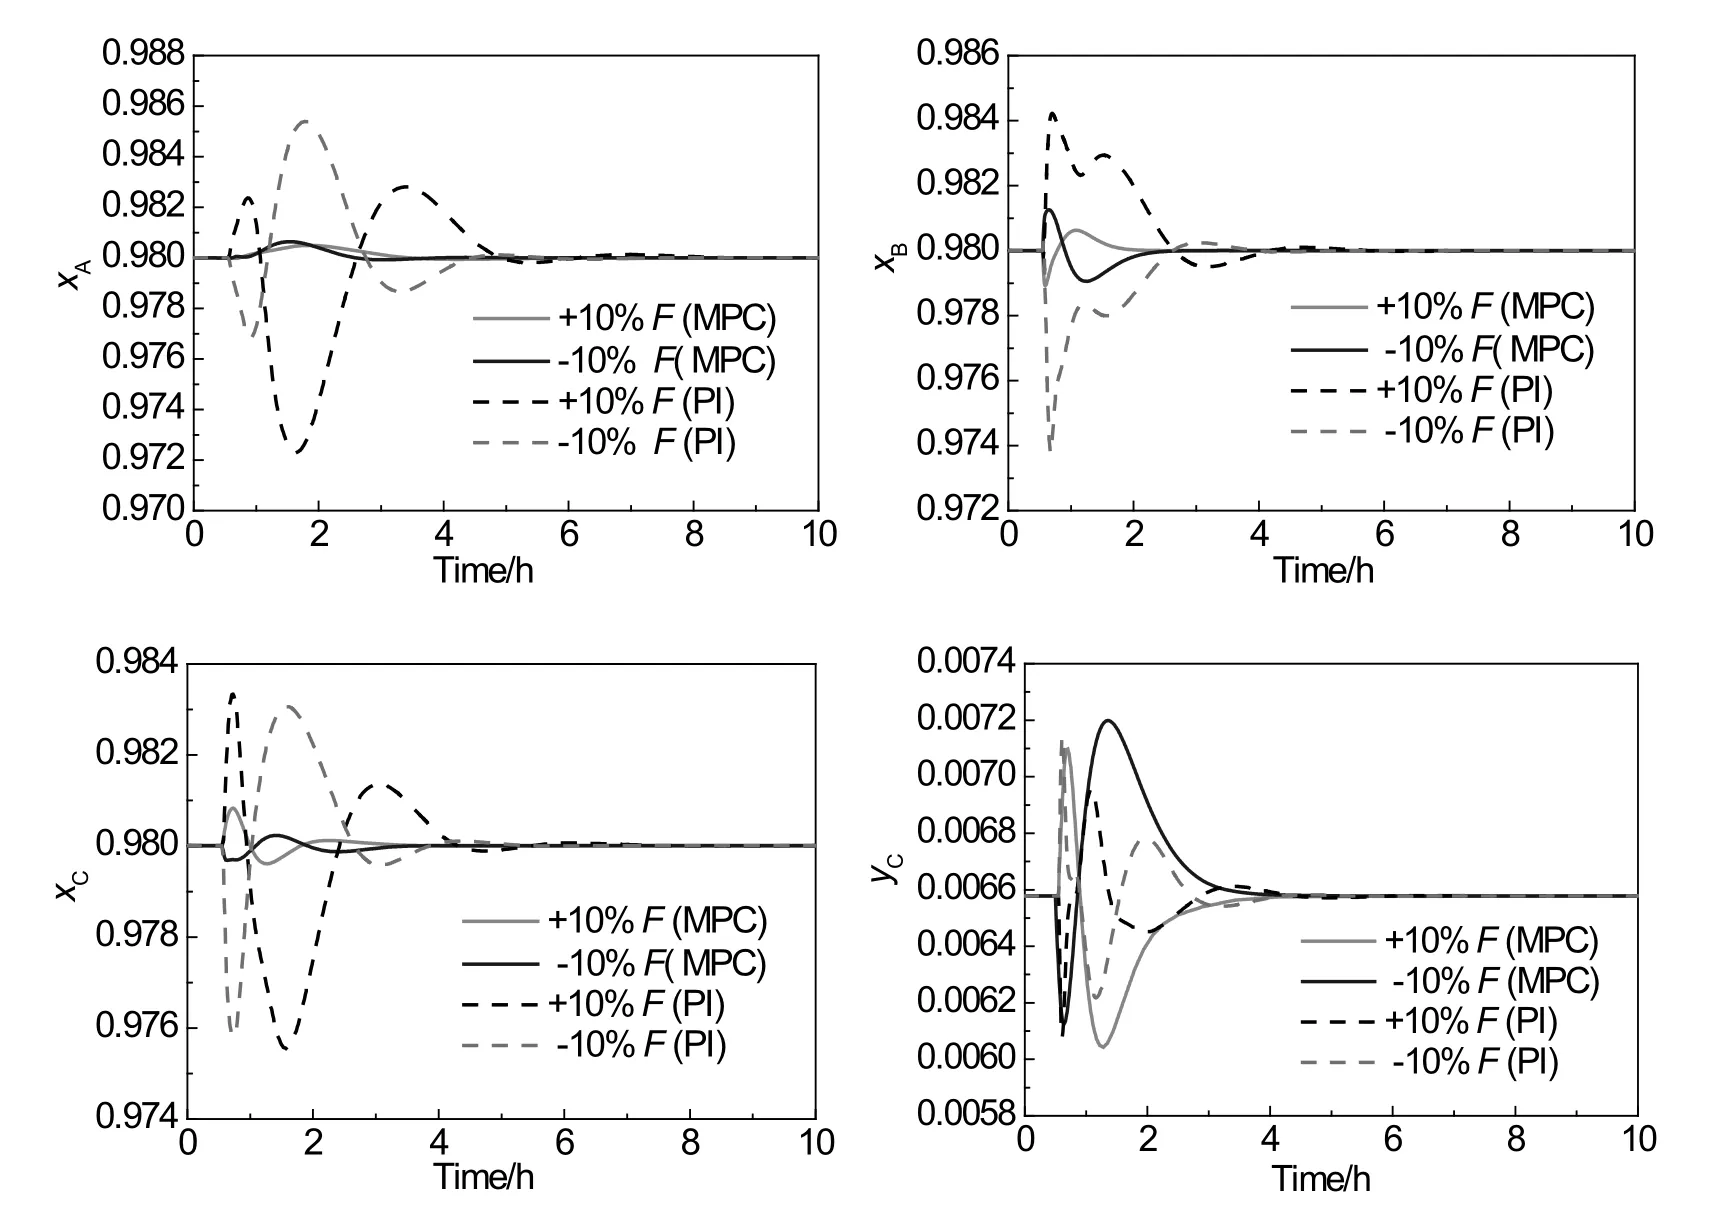
Fig.11.MPC vs.PI for composition control:dynamic responses to±10%feed flow rate disturbances.

Fig.12.MPC vs.PI for composition control:dynamic responses to±10%feed composition of ethanol disturbances.
For the feed flow rate disturbances,the liquid split ratio ends up at a new steady-state value with a negligible difference from the initial value.The small deviation is due to the change of the pressure in the DWC.Since the throughput changes while the size of the column remains unchanged,the pressure profile in the column will also change since the pressure drop at each tray varies with the vapor and liquid rates in the column.The change of the pressure profile will inevitably lead to the changes of temperature and composition profile in the column.The deviations of the manipulated variables are therefore required to steer the process to the new steady state.The manipulated variablesL,S,andQRall reach new values that are 10%higher or lower than the original.
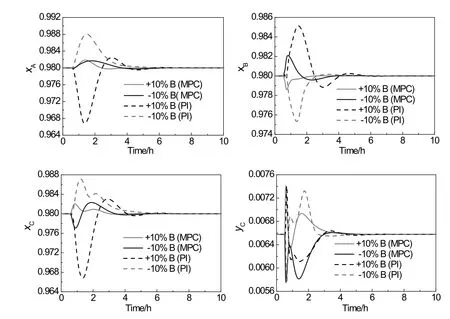
Fig.13.MPC vs.PI for composition control:dynamic responses to±10%feed composition of n-propanol disturbances.

Fig.14.MPC vs.PI for composition control:dynamic responses to±10%feed composition of n-butanol disturbances.
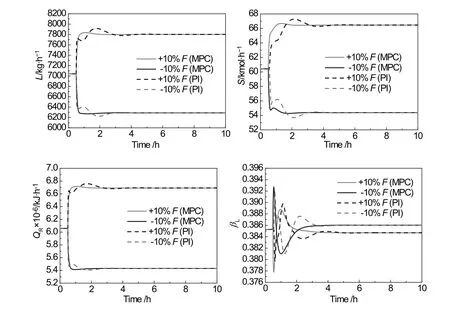
Fig.15.MPC vs.PI for composition control:dynamic responses of manipulated variables when±10%feed flow rate disturbances occur.

Table 7 Comparison of the performance of MPC vs.PI control for composition control in terms of the ISE
The integral of squared error(ISE)is a commonly used performance evaluation index since it takes into account both overshoots and settling times;ISE is defined as:

The comparison between the performances of MPC and PI control in terms of ISE is shown in Table 7.Obviously,MPC performs better than PI strategy in maintaining product purities,resulting in lower values of ISE.It is worth noting that the performance of MPC is not always better than that of PI control,especially for the control ofyc.This can be explained by Eq.(4).The weighted sum of squared errors of controlled variables is optimized to be as small as possible.The summation of the ISE for all the controlled variables could be smaller than that of PI control,but this cannot assure that the ISE for each of the controlled variables is smaller than that of PI control.MPC may sacrifice the control qualities of certain variables to achieve an optimum overall performance.
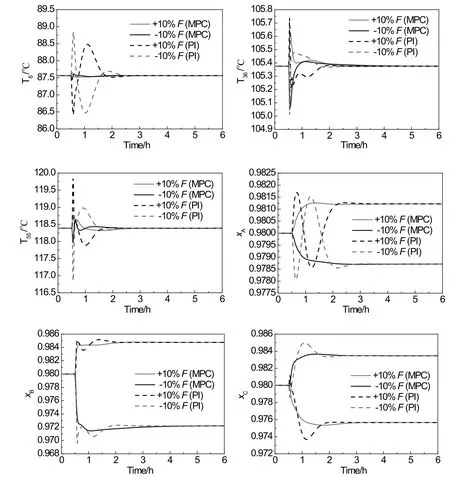
Fig.16.MPC vs.PI for temperature inferential control:dynamic responses of controlled variables to±10%feed flow rate disturbances.

Fig.17.MPC vs.PI for temperature inferential control:dynamic responses to±10%feed composition of n-propanol disturbances.
4.2.Temperature inferential control
Figs.16 and 17 show the dynamic responses of MPCvs.those of PI scheme for temperature inferential control in case of disturbances in feed flow rate and feed composition ofn-propanol.Table 8 shows the comparison between the performances of MPC and PI control in terms of ISE.Despite that the control qualities of MPC for certain variables are not always better than that of PI control,the overall performance of MPC is generally better than that of PI control,which can be justified by the summation of the ISE for the three controlled temperatures shown in Table 8.Although the three controlled temperatures can settle down quickly at their corresponding set points,three product purities cannot return to the designed values.Table 9 shows the new steady state values for product purities in case of disturbances in feed flow rate and feed composition.The product purity deviations exist even for the disturbances in feed flow rate.The maximum deviation of 0.78%occurs for the side stream purity in case of-10%feed flow rate disturbance.This can be explained by Fig.18.When the feed flow ratechanges,as mentioned earlier,the pressure in the column will also change.Since the temperature at each tray varies with the pressure,simply controlling the temperatures of sensitive trays will inevitably lead to the deviations of the product purities from designed values.Given that the temperatures at all trays are affected by the pressure in the same way,differential temperature control may compensate for the temperature variations and reduce the deviations of product purities.The derivation of an effective differential temperature control scheme requires a detailed quantitative analysis of the DWC.This will be discussed in our future work.

Table 8 Comparison of the performance of MPC vs.PI control for temperature inferential control in terms of ISE

Table 9 New steady state values for product purities

Fig.18.Temperature profiles of(a)prefractionator and(b)main column for±10%feed flow rate disturbances with product purities equal to 98 mol%.
5.Conclusions
In this article,a composition control structure and a temperature inferential control structure based on MPC strategies as well as their equivalent PI strategies are proposed for the control of a DWC for separating ethanol,n-propanol andn-butanol.Dynamic process is fully pressure-driven.GA is used for the weight tuning of MPC to obtain an optimized solution.The simulation results show that the linear MPC generally delivers an improved performance in stabilizing the nonlinear DWC flow sheet in case of disturbances in feed flow rate and feed composition,featured with reduced overshoots and less oscillation.For the composition control based on MPC scheme,directly controlling the content ofn-butanol at the top of the prefractionator will cause the instability of the process.This is mainly due to the difference between the linear model and the nonlinear process.Despite that controlling the summation of the content of ethanol andn-propanol at the top of the prefractionator can successfully maintain stable on-specification operation in face of disturbances,the nonlinear model predictive control still deserves further investigation,especially for the control of highly nonlinear process.
Temperature measurement can guarantee an affordable cost and a shorter response time in comparison to on-line analyzers.However,simply controlling the temperatures on the sensitivity trays has difficulty achieving a tight control of the product purities for a ternary system.The future work will focus on enhancing composition inference capabilities through differential temperature control.
Nomenclature
Bbottoms flow rate
Ddistillate flow rate
Ffeed flow rate
KCproportional gain
Lre flux rate
L1liquid to the prefractionator
L2liquid from the prefractionator
LB1the sump level of the prefractionator
LB2the sump level of the main column
LD2liquid level in the re flux drum
MC the main column
m1brake power of the compressor C1
m2valve position that affectsL2
m3valve position that affectsD
m4valve position that affectsS
m5valve position that affectsB
PC the prefractionator
P1top stage pressure of the prefractionator
P2top stage pressure of the main column
QCcondenser duty
QRreboiler duty
Sside stream flow rate
T8temperature of tray 8 in the main column
T36temperature of tray 36 in the main column
T55temperature of tray 55 in the main column
V1vapor from the prefractionator
V2vapor to the prefractionator
xAmole fraction of ethanol in the distillate
xBmole fraction ofn-propanol in the side stream
xCmole fraction ofn-butanol in the bottom product
yA+Bmole fraction of ethanol andn-propanol at the top of the prefractionator
yCmole fraction ofn-butanol at the top of the prefractionator
βLliquid split ratio
βVvapor split ratio
τIintegral time
[1]R.Taylor,R.Krishna,H.Kooijman,Real-world modeling of distillation,Chem.Eng.Prog.99(7)(2003)28-39.
[2]I.Dejanović,L.Matijašević,Ž.Olujić,Dividing wall column—a breakthrough towards sustainable distilling,Chem.Eng.Process.49(6)(2010)559-580.
[3]Ö.Yildirim,A.A.Kiss,E.Y.Kenig,Dividing wall columns in chemical process industry:a review on current activities,Sep.Purif.Technol.80(3)(2011)403-417.
[4]K.T.Chu,L.Cadoret,C.C.Yu,J.D.Ward,A new shortcut design method and economic analysis of divided wall columns,Ind.Eng.Chem.Res.50(15)(2011)9221-9235.
[5]J.Fang,H.Zhao,J.Qi,C.Li,J.Qi,J.Guo,Energy conserving effects of dividing wall column,Chin.J.Chem.Eng.23(6)(2015)934-940.
[6]M.I.A.Mutalib,R.Smith,Operation and control of dividing wall distillation columns:part 1:degrees of freedom and dynamic simulation,Chem.Eng.Res.Des.76(3)(1998)308-318.
[7]S.J.Wang,D.S.H.Wong,Controllability and energy efficiency of a high-purity divided wall column,Chem.Eng.Sci.62(4)(2007)1010-1025.
[8]H.Ling,W.L.Luyben,New control structure for divided-wall columns,Ind.Eng.Chem.Res.48(13)(2009)6034-6049.
[9]H.Ling,W.L.Luyben,Temperature control of the BTX divided-wall column,Ind.Eng.Chem.Res.49(1)(2010)189-203.
[10]C.Buck,C.Hiller,G.Fieg,Decentralized temperature control of a pilot dividing wall column,Chem.Eng.Process.50(2)(2011)167-180.
[11]A.A.Kiss,R.R.Rewagad,Energy efficient control of a BTX dividing-wall column,Comput.Chem.Eng.35(12)(2011)2896-2904.
[12]M.Xia,Y.Xin,J.Luo,W.Li,L.Shi,Y.Min,C.Xu,Temperature control for extractive dividing-wall column with an adjustable vapor split:methylal/methanol azeotrope separation,Ind.Eng.Chem.Res.52(50)(2013)17996-18013.
[13]L.Sun,Q.Wang,L.Li,J.Zhai,Y.Liu,Design and control of extractive dividing wall column for separating benzene/cyclohexane mixtures,Ind.Eng.Chem.Res.53(19)(2014)8120-8131.
[14]X.Qian,S.Jia,Y.Luo,X.Yuan,K.T.Yu,Control of reactive dividing wall column for selective hydrogenation and separation of C3 stream,Chin.J.Chem.Eng.24(9)(2016)1213-1228.
[15]L.Li,L.Sun,D.Yang,W.Zhong,Y.Zhu,Y.Tian,Reactive dividing wall column for hydrolysis of methyl acetate:design and control,Chin.J.Chem.Eng.24(10)(2016)1360-1368.
[16]T.Adrian,H.Schoenmakers,M.Boll,Model predictive control of integrated unit operations:control of a divided wall column,Chem.Eng.Process.43(3)(2004)347-355.
[17]C.Buck,C.Hiller,G.Fieg,Applying model predictive control to dividing wall columns,Chem.Eng.Technol.34(5)(2011)663-672.
[18]R.R.Rewagad,A.A.Kiss,Dynamic optimization of a dividing-wall column using model predictive control,Chem.Eng.Sci.68(1)(2012)132-142.
[19]M.R.Hernández,J.A.Chinea-Herranz,Decentralized control and identified-model predictive control of divided wall columns,J.Process Control22(9)(2012)1582-1592.
[20]R.K.Dohare,K.Singh,R.Kumar,Modeling and model predictive control of a dividing wall column for separation of benzene-toluene-o-xylene,Syst.Sci.Control Eng.3(1)(2015)142-153.
[21]M.Rodríguez,P.Z.Li,I.Díaz,A control strategy for extractive and reactive dividing wall columns,Chem.Eng.Process.113(2016)14-19.
[22]X.Qian,S.Jia,S.Skogestad,X.Yuan,Y.Luo,Model predictive control of reactive dividing wall column for the selective hydrogenation and separation of a C3 stream in an ethylene plant,Ind.Eng.Chem.Res.55(36)(2016)9738-9748.
[23]W.L.Luyben,Process Modeling,Simulation and Control for Chemical Engineers,McGraw-Hill,New York,1990.
 Chinese Journal of Chemical Engineering2018年5期
- Chinese Journal of Chemical Engineering的其它文章
- Bioregeneration of spent activated carbon:Review of key factors and recent mathematical models of kinetics
- CFD simulations of quenching process for partial oxidation of methane:Comparison of jet-in-cross- flow and impinging flow configurations☆
- Quantifying growth and breakage of agglomerates in fluid-particle flow using discrete particle method☆
- Coupling simulation of fluid structure interaction in the stirred vessel with a pitched blade turbine☆
- An integrated model for predicting the flame propagation in crimped ribbon flame arresters☆
- Assessment of k-ε models using tetrahedral grids to describe the turbulent flow field of a PBT impeller and validation through the PIV technique
