
A Probability Distribution Model for SCFs in Multi-planar Circular Hollow Section DT-joints Subjected to Axial Loading
2018-06-27 07:19YUANKuilinJIANGYongyiYANGHitinHONGMing
船舶力学 2018年6期
YUAN Kui-lin,JIANG Yong-yi,YANG Hi-tin,HONG Ming
(a.State Key Lab of Structural Analysis for Industrial Equipment,School of Naval Architecture Engineering;b.Department of Engineering Mechanics,Dalian University of Technology,Dalian 116024,China)
0 Introduction
Circular hollow section(CHS)joints are widely used in the offshore jacket-type platform structures.Due to the complex shape of CHS joints,nearby the weld toe region the high stress locally appears,which is usually quantified by stress concentration factor(SCF).Considering the different types and geometric dimensions of tubular joints,the SCF is supposed be a random variable,of which the probability distribution greatly affects the accuracy of fatigue reliability assessment for offshore structures.
Using the probabilistic fracture mechanics method,Kirkemo[1]performed the fatigue reliability analysis for a certain tubular joint of the jacket structure located in shallow water.The SCFs are assumed to follow a log-normal distribution with the coefficient of variation(COV)equals to 0.15 and the mean value of 2.75 and 2.50 for axial loading and in-plane bending,respectively.Rajasankar et al[2]analyzed the reliability of a cracked tubular T-joint subjected to axial loading,based on a log-normal distribution of SCFs with the mean of 10.118 and the standard deviation of 2.024.Lotfollahi-Yaghin et al[3-4]calculated the SCFs of the central brace by finite element(FE)analysis and then carried out the reliability analysis for bi-planar tubular DKT-joints under axial loading based on fracture mechanics and S-N approaches,respectively.Although the accuracy of log-normal distribution is considered to be acceptable and the corresponding parameters have been calculated in many studies,sometimes,it seems not the best fitted probability model.Ahmadi and Lotfollahi-Yaghin[5]investigated the probability models for the maximum SCFs along the weld toe of bi-planar tubular DKT-joints under axial loads.The Birnbaum-Saunders probability density distribution(PDF)with parameters β0of 22.6 and γ0of 0.74 was found to be best fitted to the FE-based sample.Ahmadi et al[6-8]showed the maximum SCFs at the weld toe of tubular KT-joints reinforced with internal ring stiffeners follow Inverse Gaussian distribution,Gamma distribution and Generalized Extreme Value distribution for axial,in-plane bending and out-plane bending(IPB)loads,respectively.
For practical structural design and decision on damage detection,it is of great importance to assess the region with maximum SCFs in advance,which is always firstly vulnerable to fatigue.Although few studies like Refs.[3-5]paid attention to multi-planar tubular joints,the probability distributions of the maximum SCFs on the chord and the brace sides had not been systematically investigated.
In this study,the aim is to present the appropriate probability distribution functions for the maximum SCFs of multi-planar DT-joints under axial loadings.Totally 352 finite element models of the multi-planar DT-joints with different geometric parameters have been generated with solid elements,and the maximum SCFs along the chord-brace intersection are analyzed.The results are categorized into four groups of samples,according to the position on the chord or brace side under two kinds of axial loading,i.e.single axial loading or balanced axial loading,respectively.Several commonly used probability models,in which the parameter values are obtained by maximum likelihood(ML)method,are fitted to the density histograms.Based on the chi-squared goodness-of-fit test,a new set of probability density functions(PDFs)for the maximum SCFs in multi-planar DT-joints are proposed for the further fatigue reliability analysis.
1 Preparation of the SCF sample database by FE method
Due to the complex geometry of multi-planar DT-joints,it is impractical to calculate the SCFs along the chord-brace intersection by analytical method.Finite element(FE)method and the experimental measurement can be used for evaluating the SCFs of tubular joints.The former is more efficient and convenient than the latter.Hence,the finite element method is used to prepare sample database in this study.
1.1 Geometrical parameters of DT-joints
A typical shape and geometrical parameters of multi-planar CHS DT-joint are illustrated in Fig.1.In this research,two braces are assumed to be identical and perpendicular to the chord.The axes of the two braces intersect at the midpoint of the chord axis.The SCFs along the chord-brace intersection of the multi-planar DT-joint are related to the parameters including α (the ratio of chord length and chord outer radius,2L/D),β (the ratio of brace outer diameter and chord outer diameter,d/D),γ(the ratio of chord outer radius and chord thickness,D/2T),τ(the ratio of brace thickness and chord thickness,t/T),φ (polar angle)and ω(out-of-plane angle).The parameters of α,β,γ and τ have been commonly used in the existing parameter equations to consider the geometric characteristics of tubular joints.Out-ofplane angle ω is a specific parameter for multi-planar joints.Gap angle ωinsideis not an independent parameter,which is related to ω and β as the following equation[9].


Fig.1 Geometrical parameters of a multi-planar tubular DT-joint
To prepare a sample database for the SCFs in multi-planar DT-joints subjected to axial loading,352 models were generated and analyzed by using ANSYS.Different values assigned for each geometrical parameter have been presented in Tab.1.These values cover the practical ranges of the dimensionless parameters typically found in multi-planar tubular joints of offshore jacket structures.
1.2 FE model generation method
As 3D brick elements can be used to model the entire joint including the weld region and it will provide more accurate and detailed stress distribution than a simple 2D shell analysis.3D brick element named as SOLID186 in ANSYS code,which is a higher order three-dimensional 20-node brick element that exhibits quadratic displacement behavior,was utilized in the finite element models.Appropriate approach to model weld region is essential for calculating the SCF along the weld toe,so the generated weld profiles were referred to AWS Code[10].
In order to guarantee good quality and appropriate quantity of FE meshes,a method of sub-zone mesh generation is used here.In this method,the entire structure is divided into several different zones regarding the computational requirements,as shown in Fig.2.On the other respect,the number of zones should be as few as possible to simplify the modeling process.Mesh sensitivity analysis was also carried out to determine the optimum mesh size in advance.The generated mesh around the chord-brace intersection is shown in Fig.3.Moreover,the Young’s modulus and Poisson’s ratio of the material are set as 206 GPa and 0.3,respectively.

Fig.2 A typical geometrical model
1.3 Defined boundary conditions
The boundary condition of chord end may range from ‘almost fixed’ to ‘almost pinned’.The length of chord greater than six times of chord diameters(i.e.α≥12)can be used to ensure that the stress distribution in the brace-chord intersection not influenced by the end condition[11].According to Morgan and Lee[12],the effect of chord end boundary conditions is only important for joints with α<8 together with high values of β and γ.The influence of αB(ratio of brace length/diameter)and the boundary condition of brace end on SCFs are also considered.Chang and Dover[13]show αBhas little effect on the SCFs along the chord-brace intersection when αBis greater than a critical value of 6.Therefore, α=15 and αB=14 are prescribed for each FE model and the chord ends are fully fixed.
In practice,two braces of the multi-planar DT-joint are often subjected to balanced axial loading with the same amplitude as shown in Fig.4(b).In some cases,a multi-planar CHS DT-joint may be subjected to axial loading as Fig.4(a),that one of the braces is bearing load and the other one can be treated as fixed end[14].Hence,these two kinds of axial loading are both taken into account.
1.4 Analysis and extraction of SCFs

Fig.4 Boundary conditions at the brace ends
As the orientation of the maximum principal stress is usually normal to the weld toe,the stresses normal to the weld toe are used to perform line extrapolations for obtaining the hot spot stress.The zone so-called‘extrapolation region’depends on the geometrical parameters of joints and the position around the intersection,as shown in Fig.5.The extrapolated stress at the weld toe position which is perpendicular to the weld toe is calculated by the following equation:

where σ1and σ2are the stress at the first and second extrapolation points at the distance of 0.4T and 1.4T from the weld toe,in which T represents the thickness of tube,respectively.

Fig.5 Extrapolation of the hot spot stress[15]
Then,the SCF at the weld toe is obtained as

here σnis the nominal stress of the loaded brace which is calculated as follows:

where F is the applied axial force.
1.5 Verification of the FE results
The results of the finite element analysis are better to be verified with experiments in order to make them more convincing.To the best knowledge of the authors,there is no reliable experimental data about the SCFs distribution along the chord-brace intersection of steel multi-planar DT-joints in the existing literatures.With the same modeling procedure as above mentioned,an alternative FE-based SCFs analysis for axial loaded T-joints was performed here and verified with the experimental results in Ref.[16].The results are summarized in Tab.2,showing a fairly good agreement with each other.The divergence between FE results and the mean of experimental results is within-17.59%which is acceptable for engineering application considering the uncertainty of welding quality[17].

Tab.2 FE results compared with experiments published[16](D=914 mm,τ=0.5,β=0.5,γ=14.3,α=5.0)
Ch.sad.is the location at saddle of chord.Ch.cro.is the location at crown of chord.Br.sad.is the location at saddle of brace.Br.cro.is the location at crown of brace.Mean and standard deviations are calculated for experimental results.Relative error is defined as the difference between FE result and the mean of experimental results.
1.6 Organization of the sample database
In this study,the probability distribution of maximum SCFs in the multi-planar DT-joints is emphasized.The SCFs extracted from the FE analysis of 352 models were organized as four samples for further statistical and probabilistic analysis.The first and second samples include the maximum SCFs along the weld on the chord and the brace side under single axial loading,respectively.Similarly,the third and fourth samples include the maximum SCFs on the chord and the brace side under balanced axial loading,respectively.
2 Probability density function fitting for the maximum SCFs
2.1 Generation of the density histograms
The density histogram is utilized to describe the distribution of the samples.A density histogram is generated by the following equation[18]:

where Hidenotes the height of the i-th bar,νirepresents the number of data points that fall into the i-th bin,k is the total number of bins,n is the sample size and d represents the uniform width of the bins.Insufficient number of bins may lead to omission of some important features of the distribution.In addition,the number of bins will affect the accuracy of the chi-squared goodness-of-fit test(section 2.3).Considering the following chi-squared test,the following equation is adopted to determine the value of k[18].
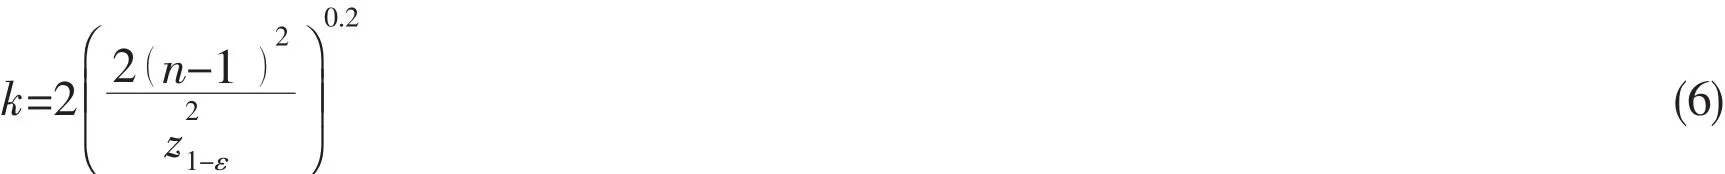
where ε is the significance level,z1-εis the value which a standard normal variable Z exceeds with probability ε as follows:

The density histograms of generated samples for ε=0.05 are shown in Fig.6.

Fig.6 Density histograms generated for maximum SCF samples(a)Chord side under single axial loading;(b)Brace side under single axial loading;(c)Chord side under balanced axial loading;(d)Brace side under balanced axial loading.
2.2 PDF fitting based on ML method
In order to compare the degree of fitting of various probability distributions to the sample data,nine different PDFs were fitted to the density histograms,as Fig.7.In each case,distribution parameters were estimated by the maximum likelihood(ML)method.
A maximum likelihood estimator is the value of the parameters that maximize the likelihood function of the sample.For a random variable X with a known PDF,fX()x,and the observed values x1,x2,…,xn,in a random sample of size n,the likelihood function can be expressed as a joint probability density function:

where θ represents the vector of unknown parameters.
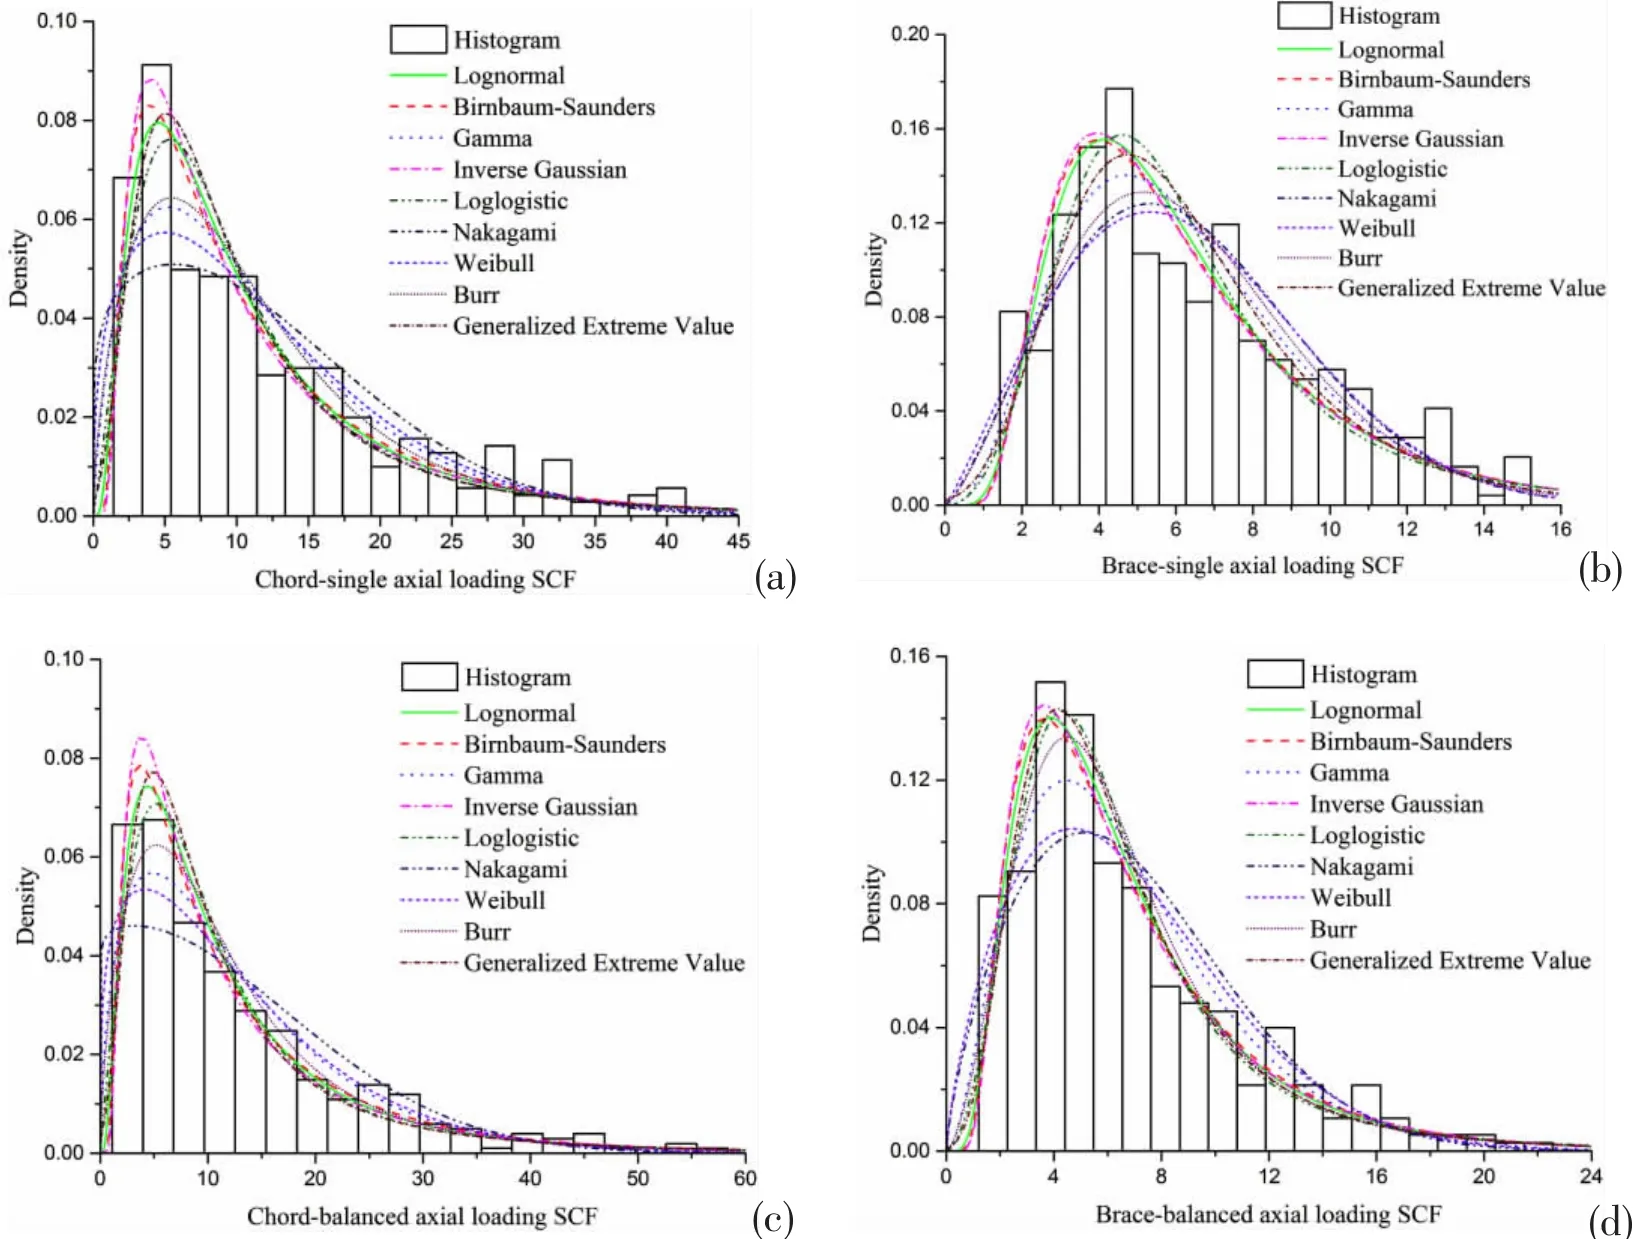
Fig.7 PDFs fitted to the generated histograms(a)Chord_single axial loading SCFs;(b)Brace_single axial loading SCFs;(c)Chord_balanced axial loading SCFs;(d)Brace_balanced axial loading SCFs
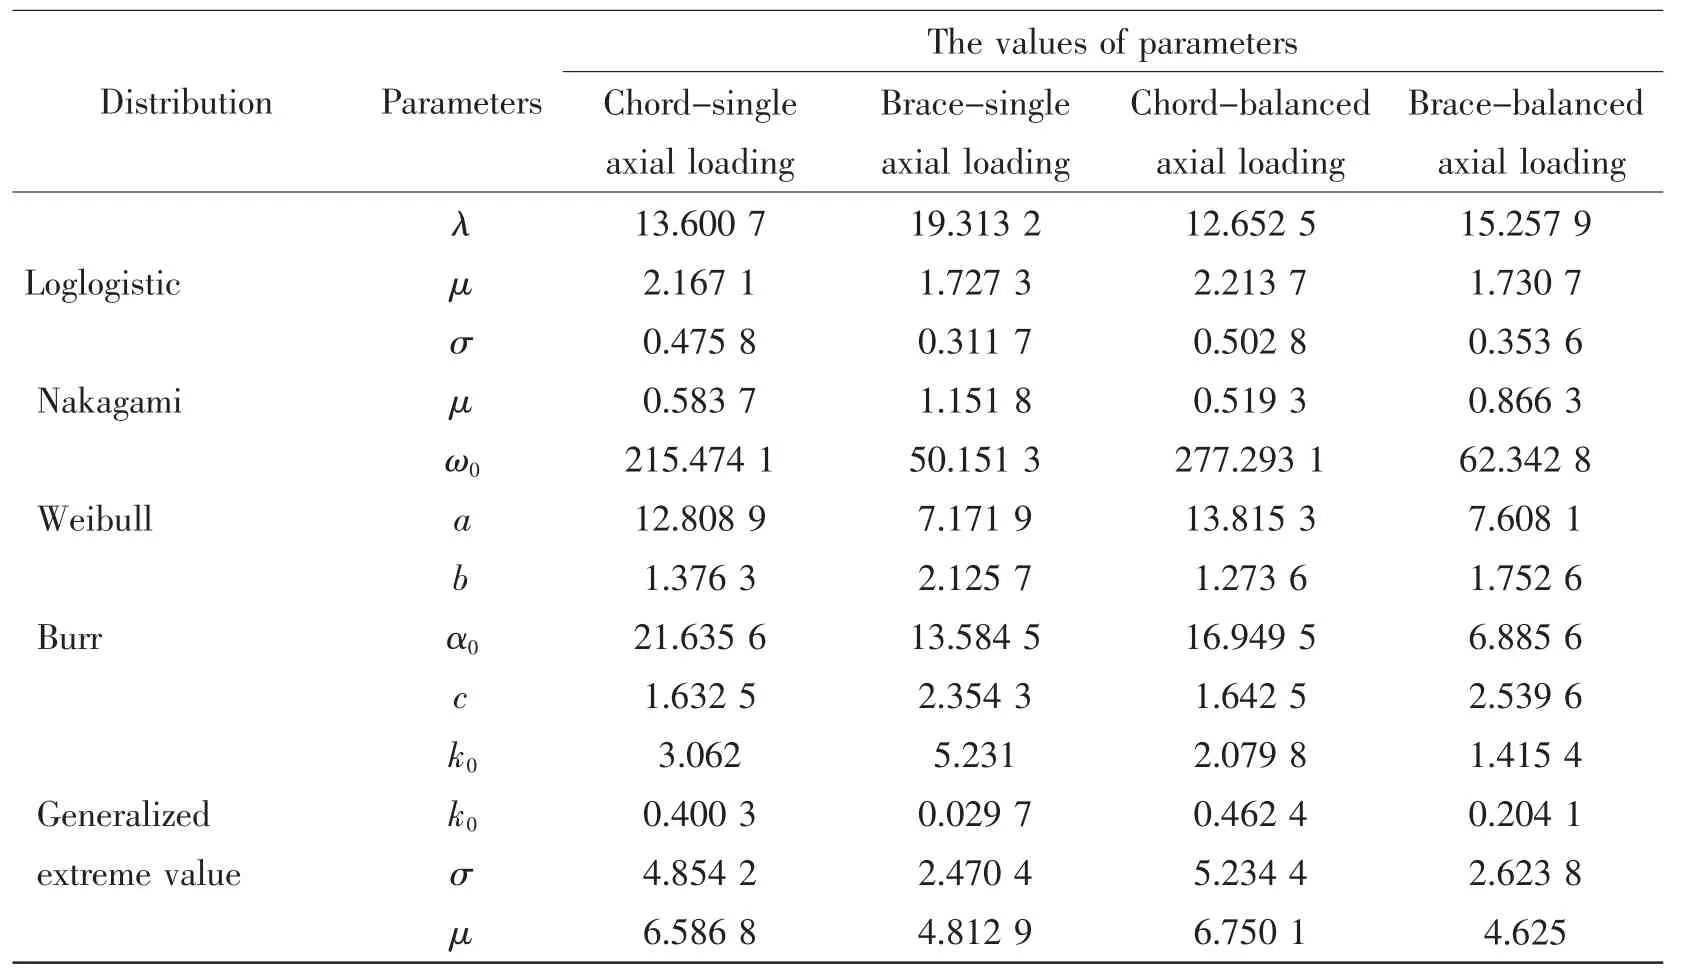
The objective is to maximize L()θfor the given data set.It can be solved by taking r partial derivatives of L()θ,where r is the number of unknown parameters,and equating them to zero.Then the maximum likelihood estimators of the parameter set θ can be found from the solution of the equations.Thus,the distribution parameters of each candidate probability distribution estimated by ML method are listed in Tab.3.

Tab.3 The values of parameters in the PDFs calibrated by maximum likelihood estimation
Continue
2.3 Assessment of the goodness-of-fit
The chi-squared test is performed to check the goodness-of-fit of each probability distribution,based on the chi-squared statistic[18].To test whether the differences between the observed and expected frequencies are significant,the following statistic is employed:
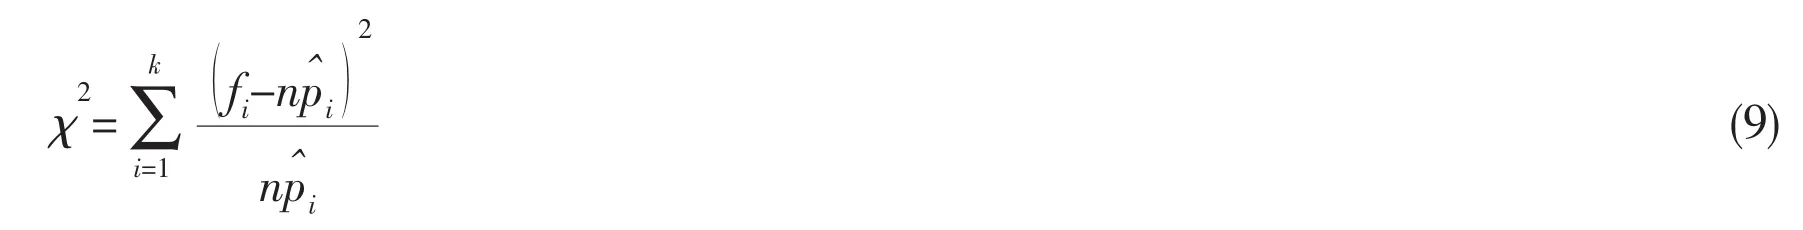
where k is the number of bins,n is the sample size,fiis the frequency of the observed sample in the i-th bins andis probability within the i-th bins estimated by expected probability distribution.If n is greater than 50 andis not less than 5 in practical applications,the adjacent bins could be merged appropriately.
If the chi-squared statistic is greater than a critical value,it indicates a poor fit.So,the critical value(k-r- 1 )is defined as the chi-squared variable X exceeds with probability ε,i.e.
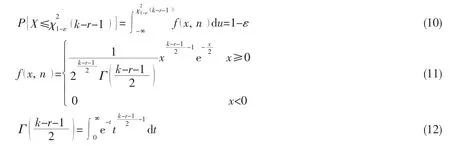
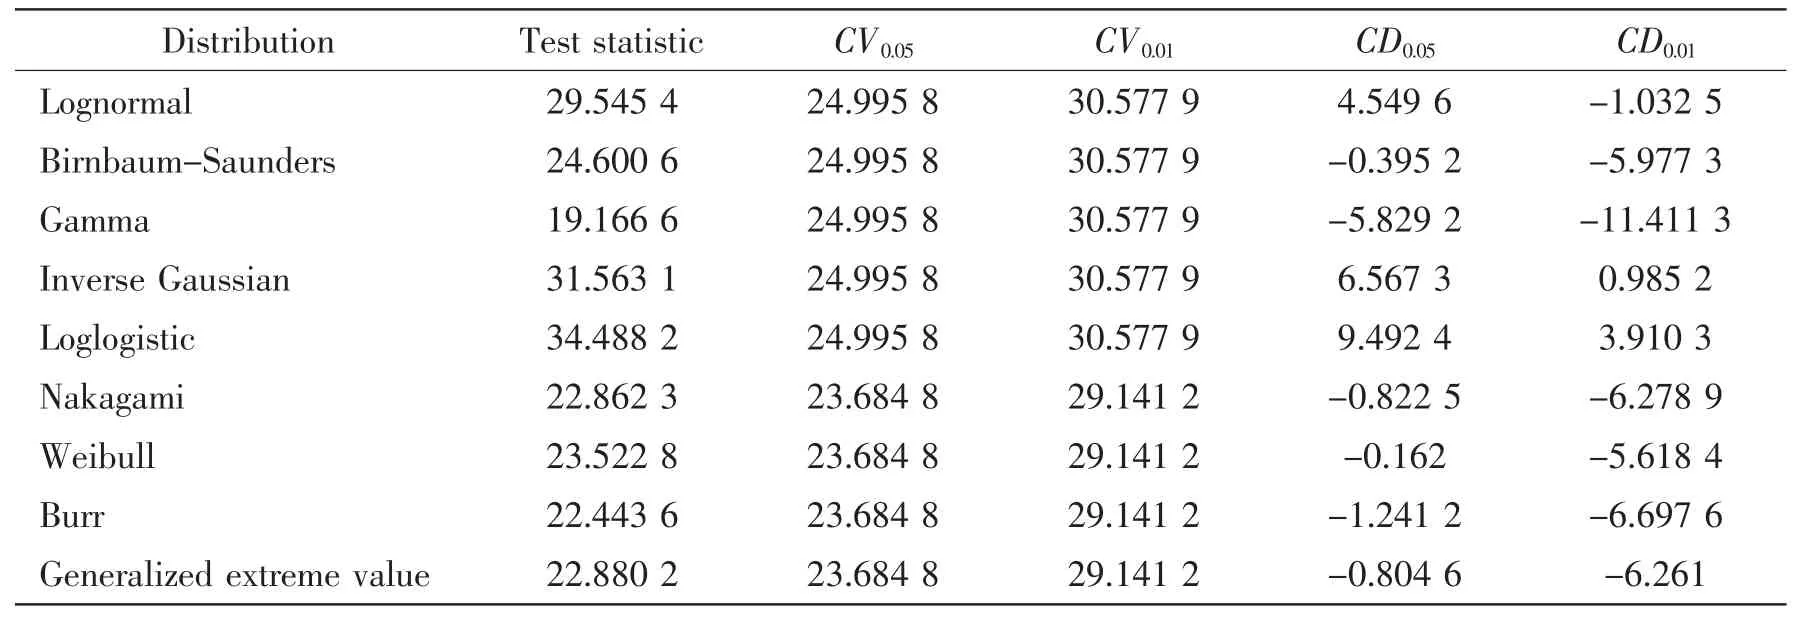
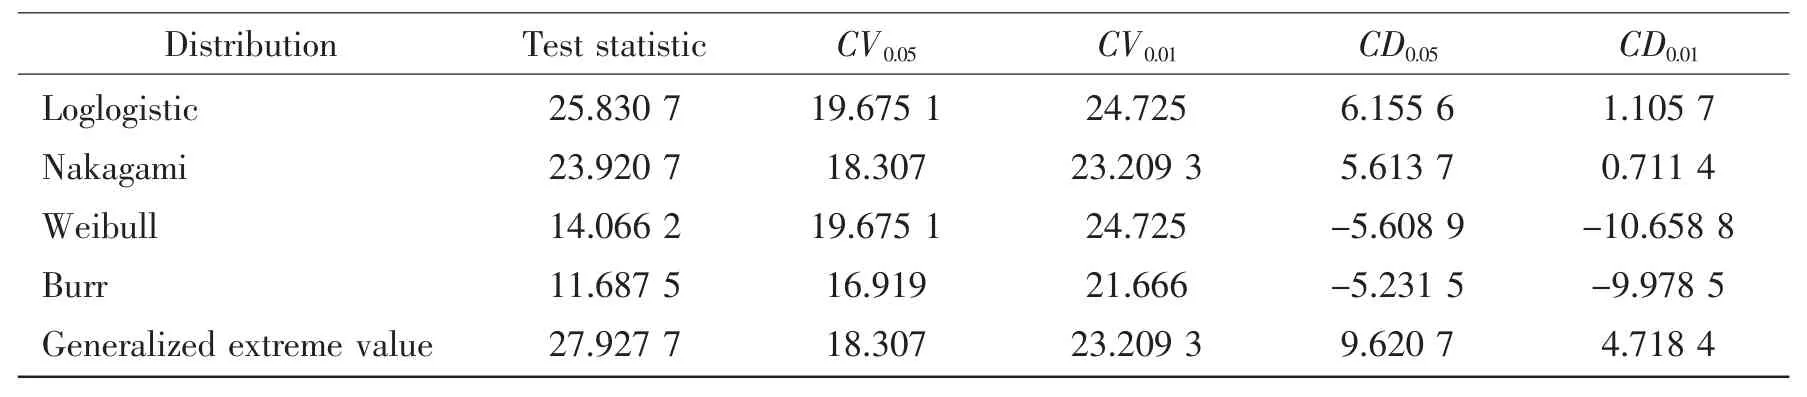
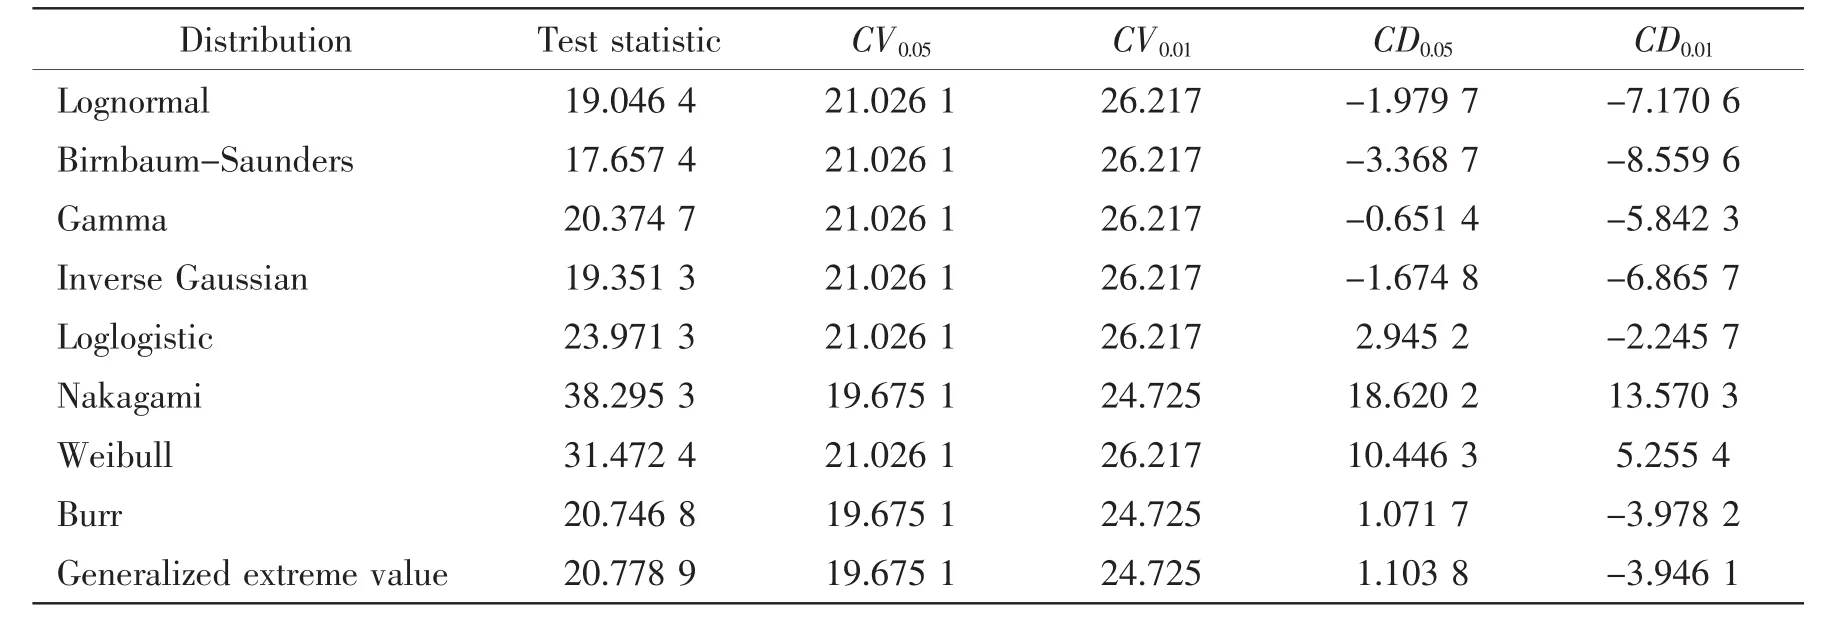
where r is the number of distribution parameters in the probability model.The results of chisquared test for four prepared samples are given in Tabs.4-7.The CV0.05and CV0.01represent the critical value of Chi-squared statistic with significance level ε=0.05 and ε=0.01,respectively.And CD0.05and CD0.01are the corresponding difference between the test statistic of sample and the critical values.The negative value of CD0.05and CD0.01indicates that the expected probability distribution is acceptable at the desired significance level and the bigger absolute value is better.Therefore,it can be found that the Birnbaum-Saunders probability distribution has the smallest values of the test statistic,indicating it best fitting to the generated samples on the chord side under single axial loading,chord and brace sides under balanced axial loading.On the other hand,the Gamma distribution is the best fitted distribution for the sample on the brace side under single axial loading.

Tab.4 Results of the goodness-of-fit test for the SCF sample on the chord side under single axial loading
Tab.5 Results of the goodness-of-fit test for the SCF sample on the brace side under single axial loading

Tab.6 Results of the goodness-of-fit test for the SCF sample on the chord side under balance axial loading
Continue
Tab.7 Results of the goodness-of-fit test for the SCF sample on the brace side under balance axial loading
3 Proposed probability models for the maximum SCFs
The best-case scenario is that a single probability model can be proposed for all SCF samples in such a way that each sample has its specific values estimated parameters.According to the discussion in the previous section on chi-squared goodness-of-fit test,the Birnbaum-Saunders distribution is not the best probability model for SCFs on the brace side under single axial loading,but it is yet quite acceptable.The reason is that the value of the test statistic for the Birnbaum-Saunders distribution is also well below the critical value.Therefore,the Birnbaum-Saunders distribution is proposed to describe the maximum SCFs along chordbrace intersection of multi-planar DT-joints under axial loading,for the further fatigue reliability analysis of the offshore jacket structures.
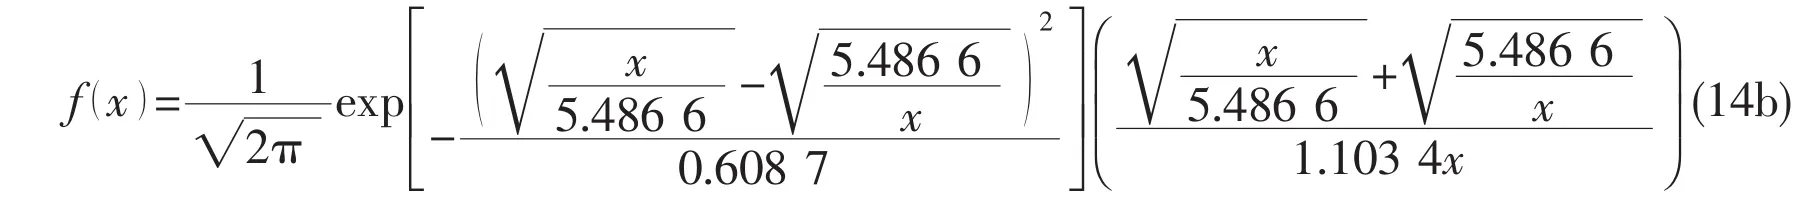
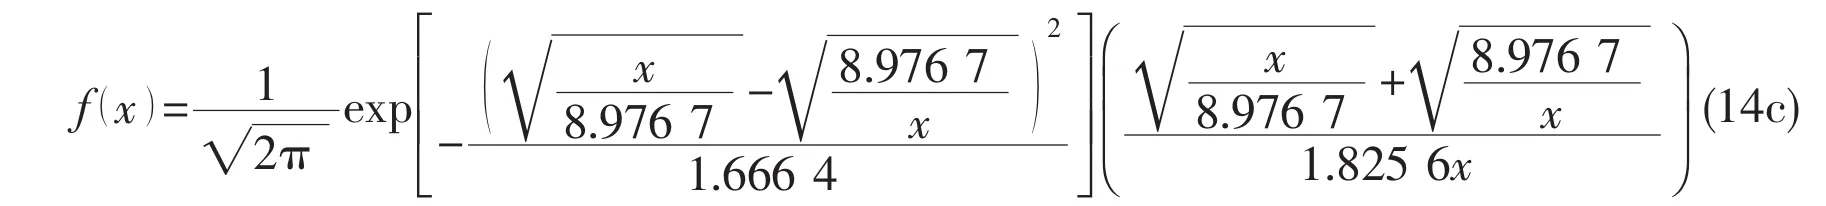
The PDF of the Birnbaum-Saunders distribution is formulated as:

where the estimated values of parameters β0and γ0could be referred to the Tab.3.The corresponding PDFs for each sample are given as follows:

for SCFs on the chord side under single axial loading.
for SCFs on the brace side under single axial loading.
for SCFs on the chord side under balanced axial loading.

for SCFs on the brace side under balanced axial loading.
[1]Kirkemo F.Applications of probabilistic fracture mechanics to offshore structures[J].Appl.Mech.Rev.,1988,41:61-84.
[2]Rajasankar J,Iyer N R,Appa Rao T V S R.Structural integrity assessment of offshore tubular joints based on reliability analysis[J].Int J Fatigue,2003,25:609-619.
[3]Lotfollahi-Yaghin M A,Ahmadi H,Aminfar M H.Effect of stress concentration factors on the structural integrity assessment of multi-planar offshore tubular DKT-joints based on the fracture mechanics fatigue reliability approach[J].Ocean Eng.,2011,38:1883-1893.
[4]Lotfollahi-Yaghin M A,Ahmadi H.Effect of SCFs on S-N based fatigue reliability of multi-planar tubular DKT-joints of offshore jacket-type structures[J].Ships Offshore Struct.,2013,8:55-72.
[5]Ahmadi H,Lotfollahi-Yaghin M A.A probability distribution model for stress concentration factors in multi-planar tubular DKT-joints of steel offshore structures[J].Appl.Ocean Res.,2012,34:21-32.
[6]Ahmadi H,Mohammadi A H,Yeganeh A.Probability density functions of SCFs in internally ring-stiffened tubular KT-joints of offshore structures subjected to axial loading[J].Thin-Walled Struct.,2015,94:485-499.
[7]Ahmadi H,Yeganeh A,Mohammadi A H,Zavvar E.Probabilistic analysis of stress concentration factors in tubular KT-joints reinforced with internal ring stiffeners under in-plane bending loads[J].Thin-Walled Struct.,2016,99:58-75.
[8]Ahmadi H.A probability distribution model for SCFs in internally ring-stiffened tubular KT-joints of offshore structures subjected to out-of-plane bending loads[J].Ocean Eng.,2016,116:184-199.
[9]Karamanos S A,Romeijn A,Wardenier J.Stress concentrations in tubular DT-joints for fatigue design[J].J Struct.Eng.,2000,126:1320-1330.
[10]American Welding Society(AWS).Structural Welding-Structural welding code-steel[S].2010.
[11]Lotfollahi-Yaghin M A,Ahmadi H.Effect of geometrical parameters on SCF distribution along the weld toe of tubular KT-joints under balanced axial loads[J].Int J Fatigue,2010,32:703-719.
[12]Morgan M R,Lee M M K.Prediction of stress concentrations and degrees of bending in axially loaded tubular K-joints[J].J Constr.Steel Res.,1998,45:67-97.
[13]Chang E,Dover W D.Stress concentration factor parametric equations for tubular X and DT joints[J].Int J Fatigue,1996,18:363-387.
[14]Li T,Lie S T,Shao Y B.Fatigue and fracture strength of a multi-planar circular hollow section TT-joint[J].J Constr.Steel Res.,2017,129:101-110.
[15]Zhao X L,Packer J A.Fatigue design procedure for welded hollow section joints[M].Woodhead Publishing,2000.
[16]Lloyd’s Register of Shipping.Stress concentration factors for simple tubular joints[S].1997.
[17]Shao Y B.Geometrical effect on the stress distribution along weld toe for tubular T-and K-joints under axial loading[J].J Constr.Steel Res.,2007,63:1351-1360.
[18]Martinez W L,Martinez A R.Computational statistics handbook with MATLAB[M].CRC Press,2013.

- 船舶力学的其它文章
- Numerical Simulations of the Effects of Marine Fouling on the Hydrodynamic Performance of Blade Sections
- Analysis of Effective Height of Green Water Loading for Tension Leg Platform Based on Statistical Process Control
- Seakeeping Prediction of SWATH with Three Dimensional Translating-pulsating Source Green Function
- Experimental Investigation on Motion Responses and Sectional Wave Loads of a Moored Semi-submersible in Deepwater
- Low-Cycle Dwell-Fatigue Life and Failure Mode of a Candidate Titanium Alloy Material TB19 for Full-Ocean-Depth Manned Cabin
- A Preliminary Study on the Buoyancy Materials for the Use in Full Ocean Depth Manned Submersibles