Numerical Simulations of the Effects of Marine Fouling on the Hydrodynamic Performance of Blade Sections
ZHANG Tao,ZHU Xiao-jun,PENG Fei,MIN Shao-song
(1.PLA 91872 Unit,Beijing 102442,China;2.Department of Naval Engineering,University of Naval Engineering,Wuhan 430033,China)
Nomenclature
α angle of attack in degrees h model barnacle height
c chord length of airfoil Re Reynolds number,Re=U∞c/υ
CLlift coefficient U∞free-stream velocity
CDdrag coefficient υ fluid kinematic viscosity
AOA angle of attack k turbulent kinetic energy
0 Introduction
The settlement and subsequent growth of flora and fauna on surfaces exposed in aquatic environments is termed as biofouling(Schultz 2004)[1].Biofouling begins to occur immediately after a ship is immersed in water and will continue to accumulate throughout a ship at sea until a cleaning and repainting process is performed.The level of fouling depends on several fac-tors,including the length of time spent at sea,the water temperature,the sea area where ships sailing,the salinity of the sea,and the effectiveness of the antifouling paint(Woods Hole O-ceanographic Institute,1952)[2].It is well established that biofouling on ships increases the surface roughness of the hull which,in turn,caused increased frictional resistance and fuel consumption and decreased top speed and range(Schultz 2011)[3].Microscopic and macroscopic are two groups of fouling organisms.
According to Taylan(2010)[4],the increase of ship resistance due to microscopic fouling is around 1%-2%,whereas an accumulation of macroscopic fouling,such as barnacles,can cause an increase of ship resistance as high as 40%.Schultz et al(2007)[5]investigated the effect of fouling on the required shaft power for a frigate by the means of fouling rating of US Naval Ships’Technical Manual(2006)[6]and equivalent sand roughness.He predicted roughly that when the ship at a speed of 15 knots,heavy slime required a 21%increase in shaft power,compared to the hydrodynamic smooth condition,whereas heavy calcareous fouling led to an 86%increase.However,their study does not include the effect of propeller biofouling because the influence of propeller fouling on ship powering is not as well established as for generic roughness.According to US Naval Ships’Technical Manual(2006),fouling on the propeller can account for as much as 50%of the increased energy demand associated with a light to moderately fouled hull.Therefore,light to moderately fouling of the propeller can result in 10.5%to 43%energy loss of a ship.
Generally,propeller blade surfaces are of polished metal and have no antifouling provision,which makes them vulnerable to biofouling.The 25th International Towing Tank Conference(ITTC)pointed out that in its report by far for propeller roughness the biggest cause is fouling and a small roughness increase of the propeller can causes large increases in the required power(ITTC,2008)[7].
Investigation of hull and propeller biofouling has not met much effort despite their significant effects on the ship performance and operation costs.Townsin(2003)[8]reviewed much of the research in this field and pointed out the difficulties and research directions for investigating of ship hull fouling,then stated that the drag penalty due to shell macrofouling(eg.barnacles)is relatively simple to study compared to soft fouling(eg.bacterial and algae).Orme et al(2001)[9]studied the effects of fouling on a NACA 4424 airfoil in a wind tunnel experiment by applying extruded small conical spikes to model barnacles fouling.The height and density of barnacles were chosen as two key factors of macroscopic fouling surface through sample collection.Results were in the form of airfoil’s lift coefficient CLand drag coefficient CD.As expected,the drag was found to increase when fouling occurred but the stall angle increased by around 10 degrees.The maximum CL/CDvalue was found to decrease 70%with high level fouling.Although some information has been provided on fouling effect,it lacks details of flow on fouling surface.
Khor and Xiao(2011)[10]simulated numerically the experiment of Orme et al(2001)by employing Computational Fluid Dynamics(CFD)method.Although their research results provided a CFD method for reference to study the effect of fouling,some questions were found from the computational method.Firstly,the flow may not be fully developed turbulent as the Reynolds number(Re)was 4.6×10⁵,but standard k-ε turbulence model employed in the simulation is high Reynolds number model and appropriate for fully developed turbulent flow,therefore,the choice of turbulence models may be not suitable.Secondly,the flow separation occurs around trailing edge and between the roughness elements,whereas standard wall function used in the computation can not deal with flow separation.Thirdly,as the standard wall function limits the grid refinement around the roughness elements,only three grid nodes were arranged on a side of the elements, which could make the flow details near the elements could not be captured accurately.
Demirel et al(2014)[11]studied the effect of antifouling coatings of plates on frictional resistance through CFD model based on the obtained flow information.They used the equivalent sand grain roughness and the built-in wall-function which considers the uniform sand-grain roughness function model based on Nikuradse’s data(1933)[12].However,the ITTC(2011b)[13]was still questioning the validity of the roughness model and equivalent sand grain roughness used in CFD application for hull roughness.
In these papers above,although fouling effects on performance of blade sections have seen research efforts,the flow details is not yet obtained due to limitation of experimental method.On aspect of CFD investigation,there are some problems with application of turbulence models and near-wall treatment methods.
The aim of the present study is to correct those problems and investigate the impact of fouling on hydrodynamic performance of blade sections by utilizing the CFD method.Considering the dominant form of fouling on propellers is hard fouling,such as barnacles(Naval Ships’Technical Manual,2006)[6],barnacles are chosen as the object of fouling and are directly modeling at the geometry level instead of using the wall function models.The SST k-ω turbulence model and fine mesh in near-wall zones were adopted to capture the flow details around barnacles.Since the blade sections are usually composed of airfoils and reference experience data is required,NACA 4424 airfoil is chosen as the object of study.Besides the overall lift and drag,more efforts will be focused on flow details of fouling surface such as velocity field distribution,wall pressure distribution,turbulent kinetic energy distribution,which could contribute to understanding the flow mechanism,and thus provide more useful information for industrial applications.
This paper is organized as follows:the numerical approach will be described in Chap.1,followed by results and discussion in Chap.2,and conclusions will be drawn at the end.
1 Numerical approach
1.1 Geometry of bare foil and relevant parameters
It is well known that numbering system for NACA foils of the four-digit series is based on the section geometry.The first integer indicates the maximum value of the mean-line ordinate ybin percent of the chord.The second integer indicates the distance from the leading edge to the location of the maximum of ybin tenths of the chord.The last two integers indicate the section thickness in percent of the chord(Abbott et al,1960)[14].

Fig.1 The geometry of NACA 4424 airfoil
Thus geometry of NACA four-digit foils can be described through thickness distribution ordinates yfand the mean-line ordinates ybof foils,which can be calculated using the equations below.Hence the coordinates of the upper and lower surface of foils yu,l()x could be obtained.Once the chord length is specified,the geometry of NACA 4424 would be determined and is shown in Fig.1.

where b denotes maximum thickness expressed as a fraction of the chord,f denotes maximum ordinate of mean line expressed as fraction of chord,xfdenotes chordwise position of maximum ordinate.The chord length c equals to 0.2 m.
1.2 Fouling modeling
Barnacles are dominant organism of fouling on propellers and the actual distribution on a ship propeller is shown in Fig.2.In the experiment of Orme et al(2001),barnacles are modeled by setting small conical shapes on the surface of airfoils,which is shown in Fig.3.As the 2-D shape of cones is triangle and a 2-D airfoil is examined here,it is simplified by making triangle-shape spikes modeling the barnacles as shown in Fig.4.

Fig.2 Barnacles distribution on a ship propeller
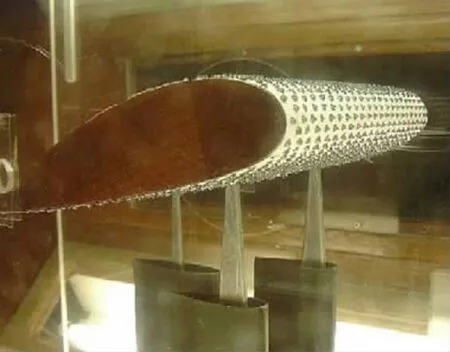
Fig.3 Experimental model from Orme et al(2001)
The experimental setting is showed in Tab.1.Considering the effect of fouling density is beyond our research,only experimental information about change of the fouling height is listed in the table.As seen,two variables are used to describe the fouling cases:height and density.Fouling height is defined as the size of barnacles on the airfoil surface,and fouling density is defined as the number of specimens per square meter.To investigate the effect of fouling height alone,the density is set to be constant.Furthermore,the control case of a smooth airfoil is set up for comparison purposes.Although the density of the three dimensional airfoil is given,distribution of fouling is hard to model.The principles of laying out the spikes on surface of the foil are determined as follows:spikes are not fitted at the leading and trailing edges to avoid adverse near-wall conditions;spikes are distributed uniformly over other parts of the airfoil surface.
With these thoughts in mind,the computational fouling cases can be set up in Tab.2.Different fouling cases of MinHe,MedHe and MaxHe are studied at a fixed fouling density,and Nofoul is the presentation of the control case.

Fig.4 Present research model of NACA 4424 airfoil
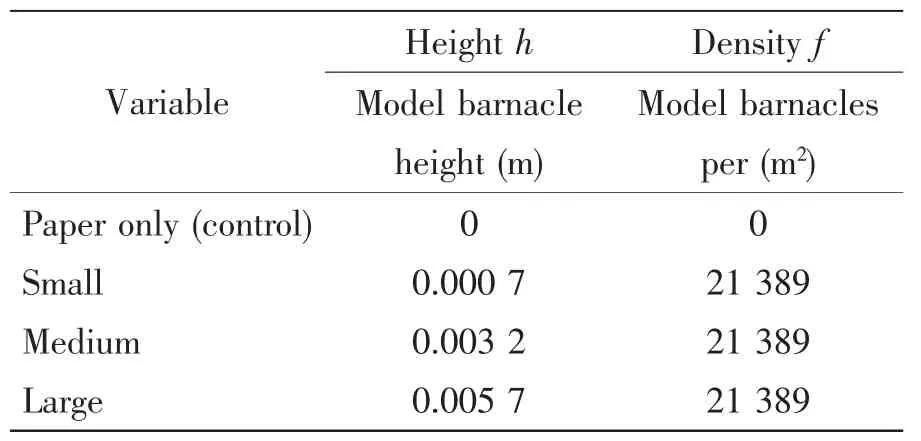
Tab.1 Experiment fouling cases(from Orme et al,2001)
1.3 Numerical modelling

Tab.2 Computational fouling cases
1.3.1 Mathematical formulation
The simulation is conducted by using a commercial Computational Fluid Dynamics package FLUENT.The Reynolds averaged continuity and momentum equations for incompressible flows in tensor notation and Cartesian coordinates are summarized below:

where ρ is the fluid density,is averaged components of the velocity vector,is the Reynolds stresses,p¯is mean pressure and μ is the dynamic viscosity
The Reynolds number(Re)based on the coming velocity and chord length for flow around the airfoil is about 4.6×10⁵as the fluid density ρ and dynamic viscosity μ equal to 1.225 kg/m3and 1.789 4×10⁻⁵kg/(m·s)respectively.Therefore,the flow can be considered as being low-Reynolds turbulent,and thus low-Reynolds turbulence model is required.The shear-stress transport(SST)k-w turbulence model is developed to effectively blend the robust and accurate formulation of the k-w model in the near-wall region with free-stream independence of the k-ε model in the far field,Moreover,the near-wall flow is resolved directly with the integration method instead of the wall function based on empirical formulas.
Menter(1994)[15]simulated the flow field distribution around foils by using k-ε,k-w,BSL k-w and SST k-w turbulence model respectively,and found that the results of SST k-w model agreed with experiment data best.Hence the present study employs SST k-w model in commercial software FLUENT to investigate the flow field of rough 2-D airfoils and effect of fouling on the performance of airfoils.The SST k-w model is described as follows:
where k is the turbulent kinetic energy,w is the specific dissipation rate.In these equations,Gkrepresents the generation of turbulence kinetic energy due to mean velocity gradients.Gwrepresents the generation of w.Γkand Γwrepresent the effective diffusivity of k and w,respectively.Ykand Ywrepresent the dissipation of k and w due to turbulence.Skand Sware userdefined source terms.
In the SST k-w model setting of the software FLUENT,model constants maintain default values.Since the drawback of the eddy-viscosity models is that these models are insensitive to streamline curvature,which plays an important role in flows around airfoils(ANSYS,2011)[16],curvature correction option is adopted to sensitize the model to effects of streamline curvature.
1.3.2 Grid and meshing
In viscous flows around airfoils,it is necessary to resolve the wake beyond the trailing edge accurately,thus the C-grid is used for the airfoil as high resolution can be concentrated at the trailing edge.Typically a C-grid consists of a semi-circle face and two square faces,and the airfoil locates near the center of the semi-circle.Considering the geometry irregularity of the airfoil surface under fouling conditions,hybrid grid method is adopted:unstructured grid is used in the inner C-region near the airfoil and structured grid is used in the outer C-region far away from the airfoil.The radius of circles of inner and outer C-region is 10c and 25c,which equals to the length of the side of inner and outer squares beyond the trailing edge respectively.The term c refers to the chord length and equals to 0.2 m.Near-wall grid is arranged clustering to the surface of the airfoil to capture the boundary layer field accurately,especially the viscous sublayer.Besides,in order to preserve the high resolution near the trailing edge,different C-grid has been created for each AOA instead of changing the angles of the incoming flow.The whole computational zone and mesh distribution for NACA 4424 are displayed in Fig.5 and Fig.6.
1.3.3 Numerical scheme

Fig.5 The whole computational zone and mesh
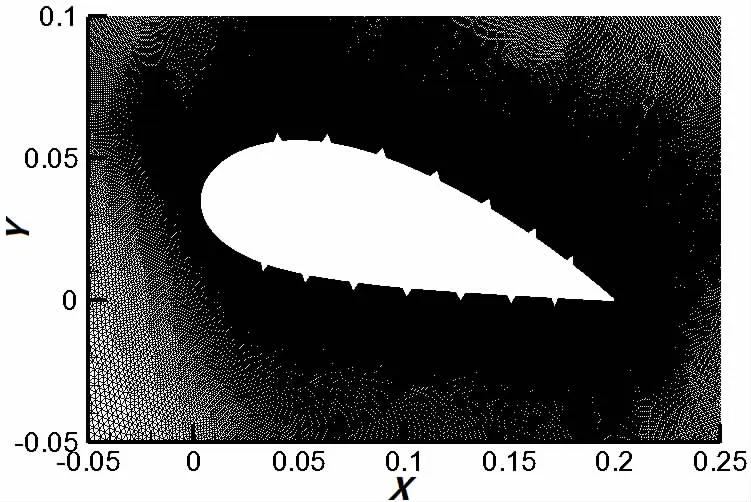
Fig.6 Local amplified grids for the NACA 4424
SIMPLE scheme is adopted for pressure-velocity coupling.Green-Gauss node-based gradient option is chosen instead of the default least squares cell based option because the former is more suitable for triangle mesh and hybrid grid.Owing to the near-wall flow being resolved directly and the mesh being very fine,thus total grid size is large and convergence is slow.In order to improve the convergence rate,first order upwind discretization scheme is used in the initial solution for convective terms such as moment,turbulent kinetic energy and specific dissipation rate.After rough convergence of initial calculation,second order upwind discretization scheme is chosen for those convective terms to lighten artificial diffusing and improve the accuracy;meanwhile,the under-relaxation factors increase appropriately to accelerate convergence.
1.3.4 Boundary conditions
In the computational zone,the outer semi-circle,upper and lower boundary lines are defined as inlet boundary,which is specified as velocity inlet.The inlet velocity is 34 m/s from the experiment of Orme et al(2001)[9],the turbulence intensity I and turbulent length scale l are obtained through the following equations:

where L is characteristics scale.In present case,Re=4.6×10⁵,L=the chord length c=0.2 m,thus I≈3%,l≈0.014.
The outflow and no-slip wall boundary condition are specified as boundary type of the outlet and foil,respectively.The interface boundary condition is used for two overlapping boundary of inner and outer C-regions in the middle of the domain.
1.3.5 Hydrodynamic parameters
The wall pressure coefficient,lift coefficient,and drag coefficient are three main hydrodynamic parameters for an airfoil.The wall pressure coefficient Cpis defined as

where p is the static pressure of the wall,p∞and U∞are the static pressure and velocity of the incoming flow,respectively.
Lift is the component of the hydrodynamic force perpendicular to the direction of motion and is generated from the difference in pressure between upper and lower surface of an airfoil.Lift coefficient CLis defined as

Drag is the component of hydrodynamic force opposite to the direction of motion and consists of two parts:the skin friction and pressure drag.Drag coefficient CDis defined as

2 Results and discussions
2.1 Grid dependence test
It is important to arrange the mean distance of the first grid point from the wall (yp)properly as a result of large gradient of the streamwise velocity near the wall.This distance is characterized by y+value.Here y+is defined as y+= (ρypuτ)/μ where uτis friction velocity and defined as uτ= (τw/ρ )1/2with τwbeing wall shear stress.The setting of y+value has to match with the turbulence model and wall treatment method.Although it is commended that the first grid point should be within the viscous sublayer and y+<5 for SST k-ω model in FLUENT,the approximate value of y+differs for each case.If the results will not change significantly through reducing the y+value within the limits,the grid independence can be regarded as being good.The near-wall grid dependence study is carried out for Nofoul case of NACA 4424 airfoil at α=10 degrees.The Nofoul case and large AOA are chosen since CL/CDvalue is high,hence changes are more visible.Fig.7 shows the change of CL/CDwith the variation of y+,no significant change can be observed after y+reduced to 1,and the value of ypis about 10-5c(m)where c is the chord length.Therefore,the grid resolution with y+value of 1 is chosen and used throughout all cases.

Fig.7 Variation of CL/CDof NACA 4424 airfoil with y+value
2.2 Lift and drag
The CLand CDof NACA 4424 airfoil under smooth surface condition can be obtained through the software Xfoil(2001)[17],for instance,CL/CDvalue of the airfoil is 58.69 under 10 degrees AOA and 5×10⁵of Re,however,the value is about 13 in the experiment of Orme et al(2001)[9].In the paper,Orme et al pointed out that the values of CL/CDwere notably low,and the cause includes discrepancies in Re,boundary growth on the end plates,a small gap inducing end effects and blockage effect in the tunnel.In CFD simulations,theses influence factors do not exist under proper computing setting,therefore it would be inappropriate to compare the results of computation with the experimental data directly.The impact of fouling can be quantified and meanwhile those influence factors would be eliminated basically by subtracting CL/CDvalue of each fouling case from that of PaperOnly case.The variation of the differences of CL/CDwith AOA is shown in Fig.8 for different fouling cases and compared with the corresponding computation results.
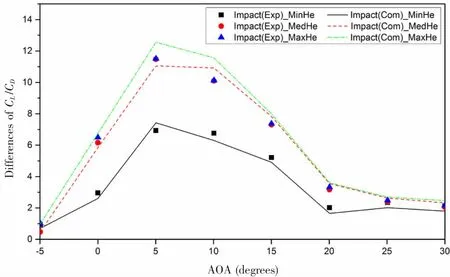
Fig.8 Results of CL/CDfor NACA 4424 airfoil under fouling cases at different AOA
It can be seen that the results of CL/CDfrom CFD are in fair agreement with those obtained by the experiment.The impact of fouling rises almost linearly with increase of AOA before the stall angle,however,when AOA exceeds the stall angle,the impact declines gradually,especially when the AOA increases more than 20 degrees,the impact becomes very slight.The results of CL/CDof MaxHe case are nearly the same as MedHe case although the height of the former is almost twice that of the latter.Therefore,it can be inferred that once the height exceeds a certain limit,the increase of the height has little effect on CL/CD.Yet the critical value of fouling height needs further research to determine.
2.3 Velocity contours and vector
The streamwise velocity(x-velocity)contours for various fouling cases are shown in Fig.9.As seen clearly,flow separation occurs earlier and the extent of the separation at trailing edge rises with increase of fouling height.For the case of higher fouling height,the region of high velocity of upper surface of the airfoil is smaller,thus the negative pressure of the upper surface becomes smaller resulting in lower lift.
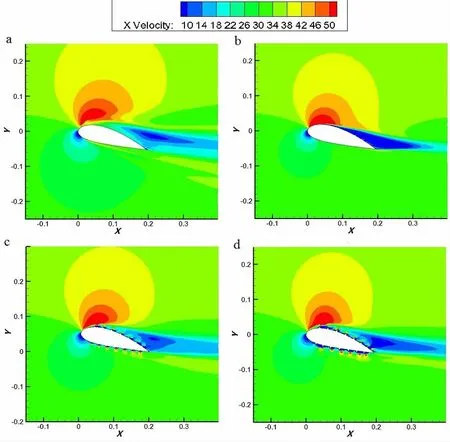
Fig.9 Streamwise velocity contour at AOA of 15 degrees for NACA 4424 under following fouling cases(a)Nofoul;(b)MinHe;(c)MedHe;(d)MaxHe
From the details of flow field around the model barnacles shown in Fig.10,although the model barnacles disturb the wall shear flow around the airfoil in different fouling cases,the disturbance effect is much less in the MinHe case,the flow quickly restores the normal state below the barnacles.However,the vortexes appear both at front and back of the barnacles in MedHe and MaxHe cases,which makes the normal wall flow being destroyed totally and the viscous sublayer almost disappear,thus the flow can be considered to enter the fully rough regime.It may explain that the fouling impact keeps almost unchanged with fouling height increasing when the height exceeds a certain value.


Fig.10 Velocity vector at AOA of 15 degrees for NACA 4424 around model barnacles under following fouling cases(a)Nofoul;(b)MinHe;(c)MedHe;(d)MaxHe
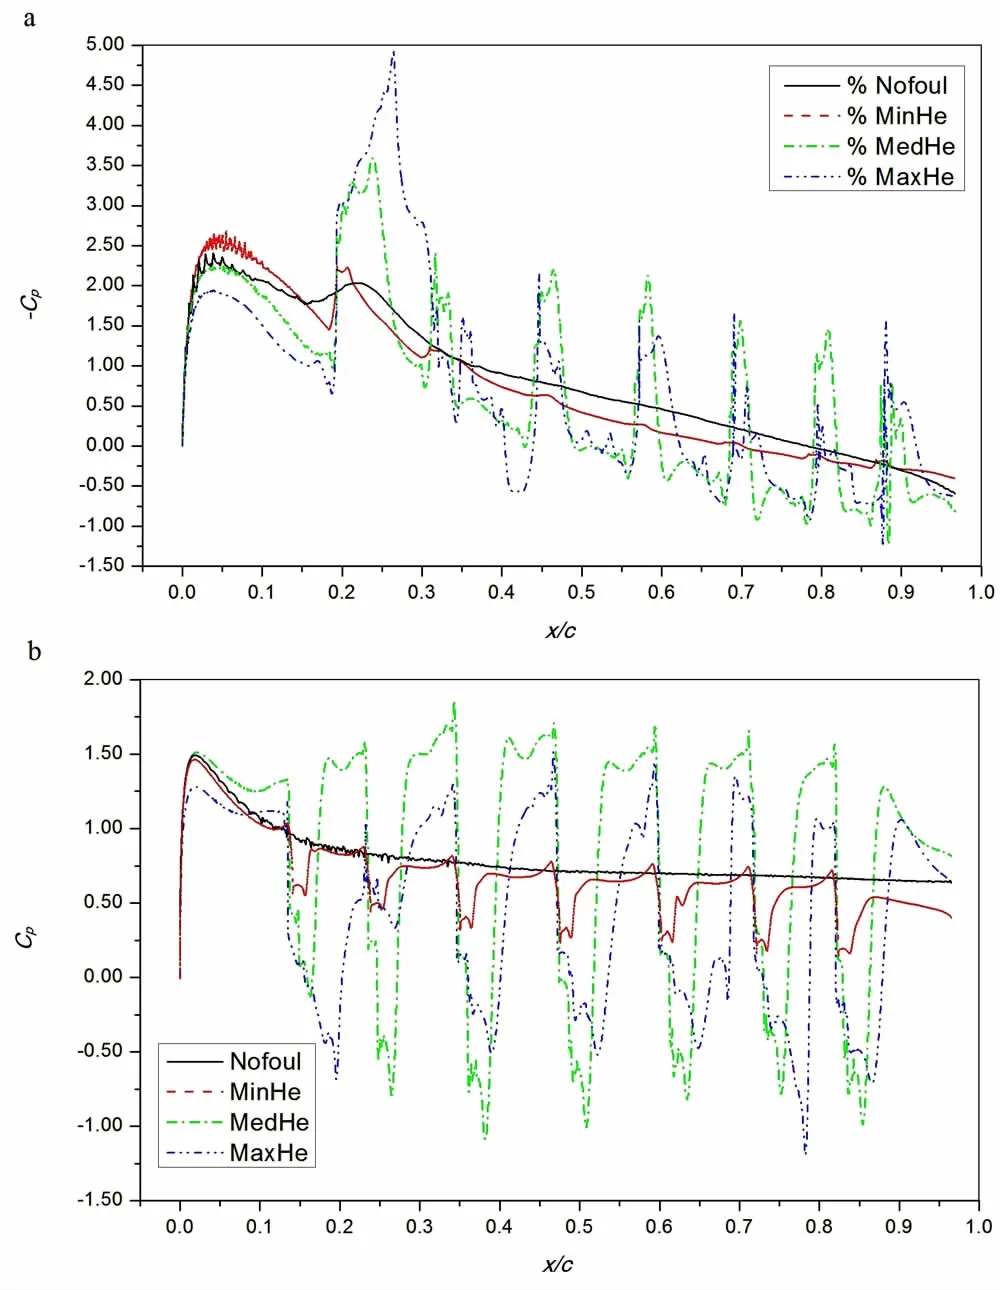
Fig.11 Wall pressure coefficient distribution at AOA of 15 degrees for NACA 4424 under following fouling cases(a)Upper surface;(b)Lower surface
2.4 Wall pressure distribution
Wall pressure distributions of the foil upper and lower surfaces at α=15 degrees,presented by pressure coefficient Cpdefined in Eq.(10),are shown in Fig.11 for different fouling heights.It can be seen that the general trend of Cpvariation along the chord is basically similar for Nofoul and MinHe cases.However,large wave crests and troughs of Cpcurves indicate the alternate appearance of low and high velocity regions along the chord,which makes Cpvariation show unconspicuous trend for MedHe and MaxHe cases,especially at lower surface of the foil.Therefore,larger barnacles can change wall pressure distribution of foils dramatically,resulting in a significant change of lift and drag.
2.5 Turbulent kinematic energy distribution
The turbulent kinetic energy is defined as)where u′,v′and w′are the fluctuating velocities of x,y and z direction,respectively.The k is one of main parameters of characterizing the turbulent fluctuation intensity.The k contours for the airfoil at AOA of 15 degrees for different fouling cases are shown in Fig.12.It can be observed clearly that the model barnacles lead to an increase of the turbulent kinetic energy(k)near the foil surface and occurrence of small high turbulent-intensity regions around them,especially for the MedHe case and MaxHe case.The fouling would intensify the turbulent mixing of flow on the foil surface significantly.

Fig.12 Turbulent kinetic energy contours at α=15 degrees for NACA 4424 under following fouling cases(a)Nofoul;(b)MinHe;(c)MedHe;(d)MaxHe
3 Conclusions
The fouling effect on performance of NACA 4424 is explored by using CFD method.The SST k-w turbulence model and fine mesh around the airfoil are employed to capture the flow details near the airfoil,especially around the fouling elements and beyond the trailing edge.The proposed method avoids the weakness and limitations of the well-known wall function methods,such as the non-applicability in dealing with flow separations and dependency on empirical data.Moreover,the satisfactory results are obtained.
Fouling has a significant negative impact on the lift-drag ratio of blade sections,which would lead to reduction of the propulsive efficiency of propeller.The impact gets severer with increase of the fouling height,however,once the height exceeds a certain limit,the impact becomes almost unchanged.Through detailed examination of the flow structure,such as velocity contours and vector,wall pressure distribution,and turbulent kinematic energy distribution,the disturbance to flow is caused by presence of the model barnacles,for the case of smaller fouling height,the disturbing effect is only restricted in small region around the barnacles,and the flow restores quickly the normal state below them.However,for case of larger fouling height,normal flow around the airfoil is destroyed totally and the viscous sublayer almost disappears,thus the flow would be considered to enter fully rough regime,which could explain that the effect of worse fouling keeps almost constant.
Given the fine mesh employed and the large number of grid elements,the method proposed in this paper is not suitable for three-dimensional airfoils and propellers.However,considering the significant effect of fouling and complexity of flow around fouled surface,this study can provide some useful information for industrial application and fluid dynamic academia.
Acknowledgements
The authors gratefully acknowledge the financial support of this research by Naval University of Engineering of China(Grant No.435517D48).And the authors would like to express their gratitude to Dr Shi Lipan for many helpful discussions.
[1]Schultz M P.Frictional resistance of antifouling coating systems[J].J Fluids Eng.,2004,126(6):1039-1048.
[2]Woods Hole Oceanographic Institute.Marine fouling and its prevention[M].George Banta Publishing Co.,1952.
[3]Schultz M P,Bendickb J A,Holmb E R,et al.Economic impact of biofouling on a naval surface ship[J].Biofouling,2011,27:87-98.
[4]Taylan M.An overview:effect of roughness and coatings on ship resistance[C]//In:Proceedings of the International Conference on Ship Drag Reduction(Smooth-Ships).Istanbul,Turkey,2010.
[5]Schultz M P.Effects of coating roughness and biofouling on ship resistanceand powering[J].Biofouling,2007,23(5):331-341.
[6]Naval Ships’Technical Manual Chapter 81.Waterborne underwater hull cleaning of naval ships[M].Publication S9086-CQ-STM-010/CH-081-R5,Naval Sea System Command,2006.
[7]ITTC.ITTC-recommended procedures and guidelines:Testing and extrapolation methods,propulsion,performance,predicting powering margins[C].ITTC,2008.
[8]Townsin R L.The ship hull fouling penalty[J].Biofouling,2003,19(Supplement):9-15.
[9]Orme J A C,Masters I,Griffiths R T.Investigation of the effect of biofouling on the efficiency of marine current turbines[C]//In:Proceedings of Marine Renewable Energy Conference(MAREC),2001:91-99.
[10]Khor Y S,Xiao Q.CFD simulations of the effects of fouling and antifouling[J].Ocean Eng.,2011,38:1065-1079.
[11]Demirel Y K,Khorasanchi M,Turan O,Incecik A,et al.A CFD model for the frictional resistance prediction of antifouling coatings[J].Ocean Eng.,2014,89:21-31.
[12]Nikuradse J.Laws of flow in rough pipes[R].NACA Technical Memorandum 1292,1933.
[13]ITTC.ITTC-recommended procedures and guidelines:Practical guidelines for ship CFD application[C].ITTC,2011.
[14]Abbott I H,Von Doenhoff A E.Theory of wing sections,including a summary of airfoil data[M].Dover Publications,New York,1960.
[15]Menter F R.Two-equation eddy-viscosity turbulence models for engineering applications[J].AIAA Journal,1994,32:1598-605.
[16]ANSYS.ANSYS FLUENT theory guide[K].Release 14.0,2011.
[17]Drela M,Youngren H.XFOIL 6.94 user guide[K].Aeronautics and Astronautics Engineering,Massachusetts Institute of Technology,2001.
- 船舶力学的其它文章
- Experimental Study on Interaction of Low Cycle Fatigue and Accumulative Plastic Damage of AH32 Steel in Uniaxial Cyclic Loading
- A Probability Distribution Model for SCFs in Multi-planar Circular Hollow Section DT-joints Subjected to Axial Loading
- A Preliminary Study on the Buoyancy Materials for the Use in Full Ocean Depth Manned Submersibles
- Low-Cycle Dwell-Fatigue Life and Failure Mode of a Candidate Titanium Alloy Material TB19 for Full-Ocean-Depth Manned Cabin
- Experimental Investigation on Motion Responses and Sectional Wave Loads of a Moored Semi-submersible in Deepwater
- Seakeeping Prediction of SWATH with Three Dimensional Translating-pulsating Source Green Function

