Study on reactions of gaseous P2O5 with Ca3(PO4)2 and SiO2 during a rotary kiln process for phosphoric acid production☆
Qiang Liu,Weizao Liu,Li Lü,Ruhu Li,Bin Liang,Hairong Yue,Shengwei Tang,Chun Li*
College of Chemical Engineering,Sichuan University,Chengdu 610065,China
1.Introduction
Commercial production of phosphoric acid consists of the wet process and thermal process[1–5].In the wet process,sulfuric acid is added to phosphate ores to yield an insoluble calcium sulfate CaSO4(the so-called phosphogypsum)and an impure phosphoric acid solution.Although the wet process has a relatively low production cost,the productis inferiorand the phosphogypsumis hard to be reused[6].The thermal process involves two separate steps[7,8],i.e.,reducing phosphate ores with carbon to produce elemental phosphorus gas in an electric arc furnace at 1400–1600 °C,and burning the phosphorus gas with oxygen to form phosphorus pentoxide(P2O5),which is further absorbed in water to get phosphoric acid.Although the process can obtain relatively pure H3PO4,high energy consumption prevents it from wide application.To reduce the energy consumption,early in 1937,Levemore and Vivian proposed supplying the endothermal heat necessary in the reduction reaction between phosphate ore and carbon by oxidizing the reduced phosphorus gas and carbon monoxide[9],and designed a special double-sleeve rotary kiln.In the rotary kiln,the outer kiln is the reduction zone of phosphate ore and the inner kiln is oxidation zone of phosphorus gas and carbon monoxide.This is the earliest conceptual design of rotary kiln for phosphoric acid production.From then on,a large number of patents which relate to the design of kiln and technology came forward[10–13].During the 1978 to 1982,America Occidental Research Corp.(ORC)developed a rotary kiln H3PO4technology and completed its pilot plant test[14–16].However,further industrialization test hasn't yet been reported.In 2005,a commercial kiln process plant with H3PO4output of 10000 t·a-1was constructed and put into operation in Baokang,Hubei,China[17].However,the test shows that the P2O5transformation rate is only 75%at the best condition,and the heat recovery is low.Besides,due to formation of serious ring in the kiln inner,which prevented the feed balls frompassing in and out,the production had soon to be stopped with the utmost continueous run-cycle only a week.
So far,most investigators have reached an agreement that the formation of low melting point materials is responsible for the kiln ring forming[18–21].As for what the low melting point material is and how it forms the ring,however,there are many different viewpoints.
Hokanso and Williams suggested thatthe kiln-ringing was primarily formed due to uneven temperature distribution inside rotary kiln[20,21].Leder thought that the melting problem could occur because of the release of fluoride during fluorapatite reduction,which easily formed low melting-point reaction products upon mixing with silica,lime and impurities[18].Whereas,most researchers proposed that the phosphorus pentoxide from the oxidizing zone entered into the reduction zone of feed balls and reacted with solid raw materials(phosphate ore and silicon dioxide)to form various low melting point materials due to the two zones not being able to be isolated effectively[19].Based on his spot observation on the production of calcium metaphosphate fertilizer via reaction of phosphate ore with phosphorus pentoxide at high temperatures by America TVA corporation during 1930 and 1950[22],Jiang Shan-xiang firstly came up with an idea thatthe reaction might also happen in the kiln phosphoric acid production,which would decrease the phosphate ore reduction[23,24]but further research wasn't reported.Jacob proposed that a formulation with low CaO/SiO2ratios(high silica)resulted in formation of reaction residues of branched polysilicates,which produced an extremely viscous glass meltatreduction temperatures[25].As a summary ofthe Baokang industrialization test,YIN Xian-guo[17]suggested that both the“absorption”ofP2O5by phosphate ore and excessively burning ofcarbonaceous materialin the feed balls led to formation of kiln ring.In the series of patent applications[16,26],Megy et al.pointed out that the reaction of P2O5with phosphate ore was a new discovery in the kiln process phosphoric acid,which occurred at over 485°C with formation of calcium metaphosphate of melting point 973°C,a temperature far less than the carbon thermal reduction temperature of phosphate ore at high SiO2/CaO ratios(~1200 °C).Also,further research works have not been reported.Our previous thermodynamic calculation demonstrates that the reaction of phosphorus pentoxide with phosphate ore tends to form calcium metaphosphate below temperature of 1140°C and calcium pyrophosphate above temperature of 1140°C[27].
A survey of literature indicates that the “absorption”of phosphorus pentoxide by phosphate ore and silicon dioxide haven't been investigated up to now.In this study,the reactions of gaseous phosphorus pentoxide with phosphate ore,silicon dioxide and their mixture,respectively,were systematically investigated by combined chemical analysis and various characterizations comprised of X-ray diffraction(XRD),Fourier-transform infrared(FTIR)spectroscopy,thermogravimetric analysis(TG)and differential scanning calorimeter(DSC),and scanning electron microscopy(SEM)and energy dispersive spectrometer(EDS).Attentions were focused on apparent morphology,phase transformation and thermal stability of the products of the“absorption”at differenttemperatures.The aim of presentstudy is to understand the process of“absorption”by providing basic data about the reactions.
2.Experimental
2.1.Materials
Since natural phosphate ore and fluorapatite generally contain lots of impurities and fluorapatite is firstly transformed into calcium phosphate during its carbon thermal reduction for production of the kiln process phosphoric acid[28],an analytical pure calcium phosphate with Ca3(PO4)2content of≥99%,obtained from Tianjing Kemiou Chemical Reagent Factory,was employed in the presentstudy to avoid the effect of impurities.The major impurities in natural phosphate ore and fluorapatite are aluminum oxide,magnesium oxide and iron trioxide and their“absorption”behavior to P2O5and effect on the “absorption”of calcium phosphate and silicon during the kiln process will be discussed elsewhere.
Phosphorus pentoxide(≥99%)and silicon dioxide(≥99%)are analytical grade reagents provided by Chengdu Kelong Chemical Reagent Factory.
2.2.Experimental procedure
2.2.1.Reaction of P2O5with Ca3(PO4)2and SiO2
Experiments of the“absorption”of gaseous P2O5were conducted in a horizontal tube furnace(GSL-1600X,Zhengzhou,China)under air atmosphere,as shown in Scheme 1.In each test,about 1.000 g calcium phosphate,silicon dioxide,or their mixture placed in a porcelain boat with sample thickness of about 4 mm was pushed to constant temperature zone at the middle of furnace and heated to a designated temperature and subsequently a certain amount of phosphorus pentoxide powder placed in another porcelain boat was rapidly pushed to a position with its temperature constantat500°C.The phosphorus pentoxide was sublimated into gaseous state, flowed across and reacted with the solid raw materials under a sweep of air at a rate of 0.8 L·min-1.The off gas was absorbed with alkaline solution.The reaction products thus obtained was withdrawn after 40 min,cooled naturally to room temperature in a desiccator,weighed and pulverized in agate mortar and then divided into two parts.One part was characterized by XRD,FT-IR,TG-DSC,and SEM-EDS.The other part was used to chemically analyze the contentofphosphorus pentoxide in the products and thus calculate the amount of P2O5“absorption”per unit mass of raw material(AM,g/g):

where CAPrepresents the P2O5content in the“absorption”product,CRMrepresents the P2O5content in the raw materials(Ca3(PO4)2or mixed Ca3(PO4)2and SiO2),WAPrepresents the mass of“absorption”product,and WRMrepresents the mass of raw materials.
2.2.2.Thermal stability experiment
Acertain mass ofthe“absorption”productplaced in a porcelain boat was pushed to constanttemperature zone ofthe horizontaltube furnace and annealed for 60 min at a preset temperature under air atmosphere.The sample thus obtained was withdrawn,cooled naturally to room temperature in a desiccator,weighed and pulverized in an agate mortar.The heat treatment sample was then chemically analyzed and characterized.
2.2.3.Chemical analysis and characterization
Measuring the contentofwatersoluble phosphorus pentoxide in the“absorption”sample(WCAP):approximately 0.5 g of the sample was precisely weighed,dissolved in 150 ml deionized water at 40°C under a stirred condition for60 min and then filtered.The contentofphosphorus pentoxide in the solution thus obtained was measured by the quinoline molybdate gravimetric method.
Measuring the total content of phosphorus pentoxide in the“absorption”sample(TCAP):approximately 0.5 g of the “absorption”sample mixed with 2 g of NaOH and 1.5 g of Na2O2in a nickel crucible,was first smelted in a muf fle furnace at 400°C for 10 min and then at 700 °C for 5–10 min.The digested sample was dissolved in a mixed solution of 10 ml of 1:1 dilute nitric acid,10 ml of 1:1 dilute hydrochloric acid,and 150 mlof deionized water at 90°C for 90 min and filtered.The total content of phosphorus pentoxide in the leach liquor was also measured by the quinoline molybdate gravimetric method.
Therefore,the P2O5content in the “absorption”product was calculated as follows:CAP=TCAP-WCAP.
The experimental results showed that the content of water soluble phosphorus pentoxide in the “absorption”sample was about 1%,which was negligible compared to the total P2O5content upon the“absorption”with pure Ca3(PO4)2or mixed Ca3(PO4)2and SiO2.
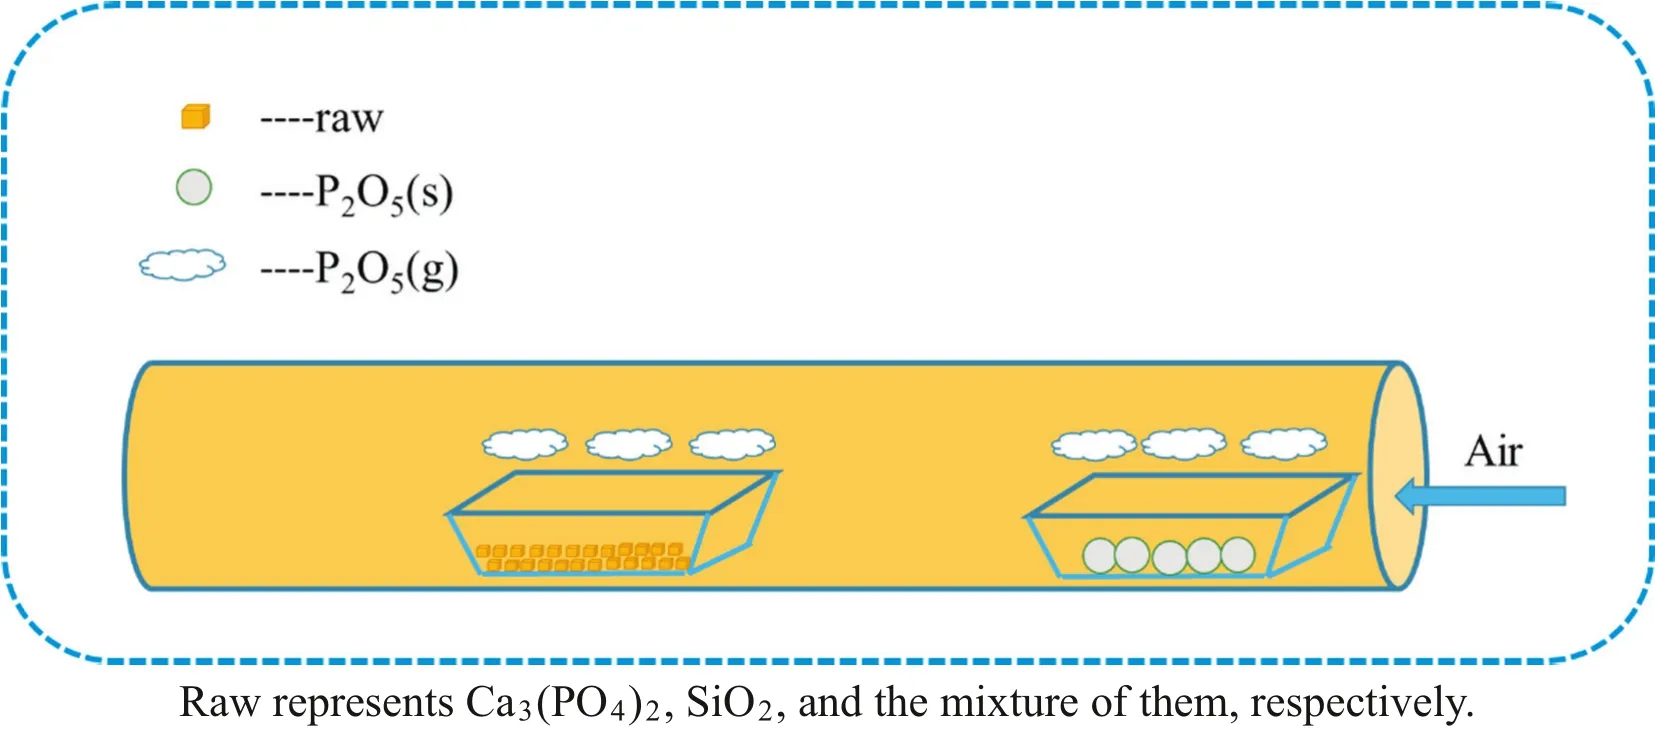
Scheme 1.Schematic illustration of the “absorption”process.Raw represents Ca3(PO4)2,SiO2,and the mixture of them,respectively.
The phase constitution of“absorption”products was detected using a DX-2007 X-ray diffraction spectrometer(Danton,China)operating with a Cu Kαradiation source filtered with a graphite monochromator at a frequency of λ=1.54 nm.The continuous scanning mode with a 0.03-s interval and 0.05-s set time was used to collect the XRD patterns.The voltage and anode current were 40 kV and 30 mA,respectively.
The vibration spectra were measured using a FTIR spectrometer(Nicolet 6700,USA)with a resolution of 2 cm-1with 32 scans in the wavenumber range of 4000–400 cm-1.
The surface morphology of the “absorption”products was observed using a JEOL JSM-7500F scanning electron microscope(SEM)at an accelerating voltage of 5 kV.The relative elemental abundance of the sample was analyzed with a combined energy-dispersive X-ray spectrometer(EDS,Oxford IS250,Japan).
Thermal analysis was performed on a thermogravimetry(TG)and differential scanning calorimetry(DSC)analyzer(HTC-2,China)with a heating rate of 10 K·min-1and an air flow rate of 30 ml·min-1.
3.Results and Discussion
3.1.Reaction of gaseous P2O5 with calcium phosphate
Pure calcium phosphate contacted and reacted with gaseous phosphorus pentoxide atdifferenttemperatures for40 min as described in Experimental procedure,and the apparent morphology of the“absorption”products is shown in Fig.1.Clearly,agglomeration of the product particles was aggravated with increasing reaction temperature and upon the temperature over 800°C,the surfaces of the products seem to fuse completely.
The P2O5content in the“absorption”products at different temperatures was measured and presented in Fig.2.Theoretically,the P2O5contents in pure Ca3(PO4)2,calcium metaphosphate(Ca(PO3)2)and calcium pyrophosphate(Ca2P2O7)are 45.8%,71.7%,and 55.9%,respectively.As can be seen in Fig.2,the P2O5content in the “absorption”product at 500°C was 47%,which is slightly higher than the theoretical P2O5content of calcium phosphate.The P2O5content increased monotonically with reaction temperature until 900°C,beyond which it began to decrease.The maximum P2O5content reached 70%,which approaches the theoretical P2O5content of calcium metaphosphate,while the value dropped to approximately 58%at1300°C,which is close to the theoretical P2O5content of calcium pyrophosphate.
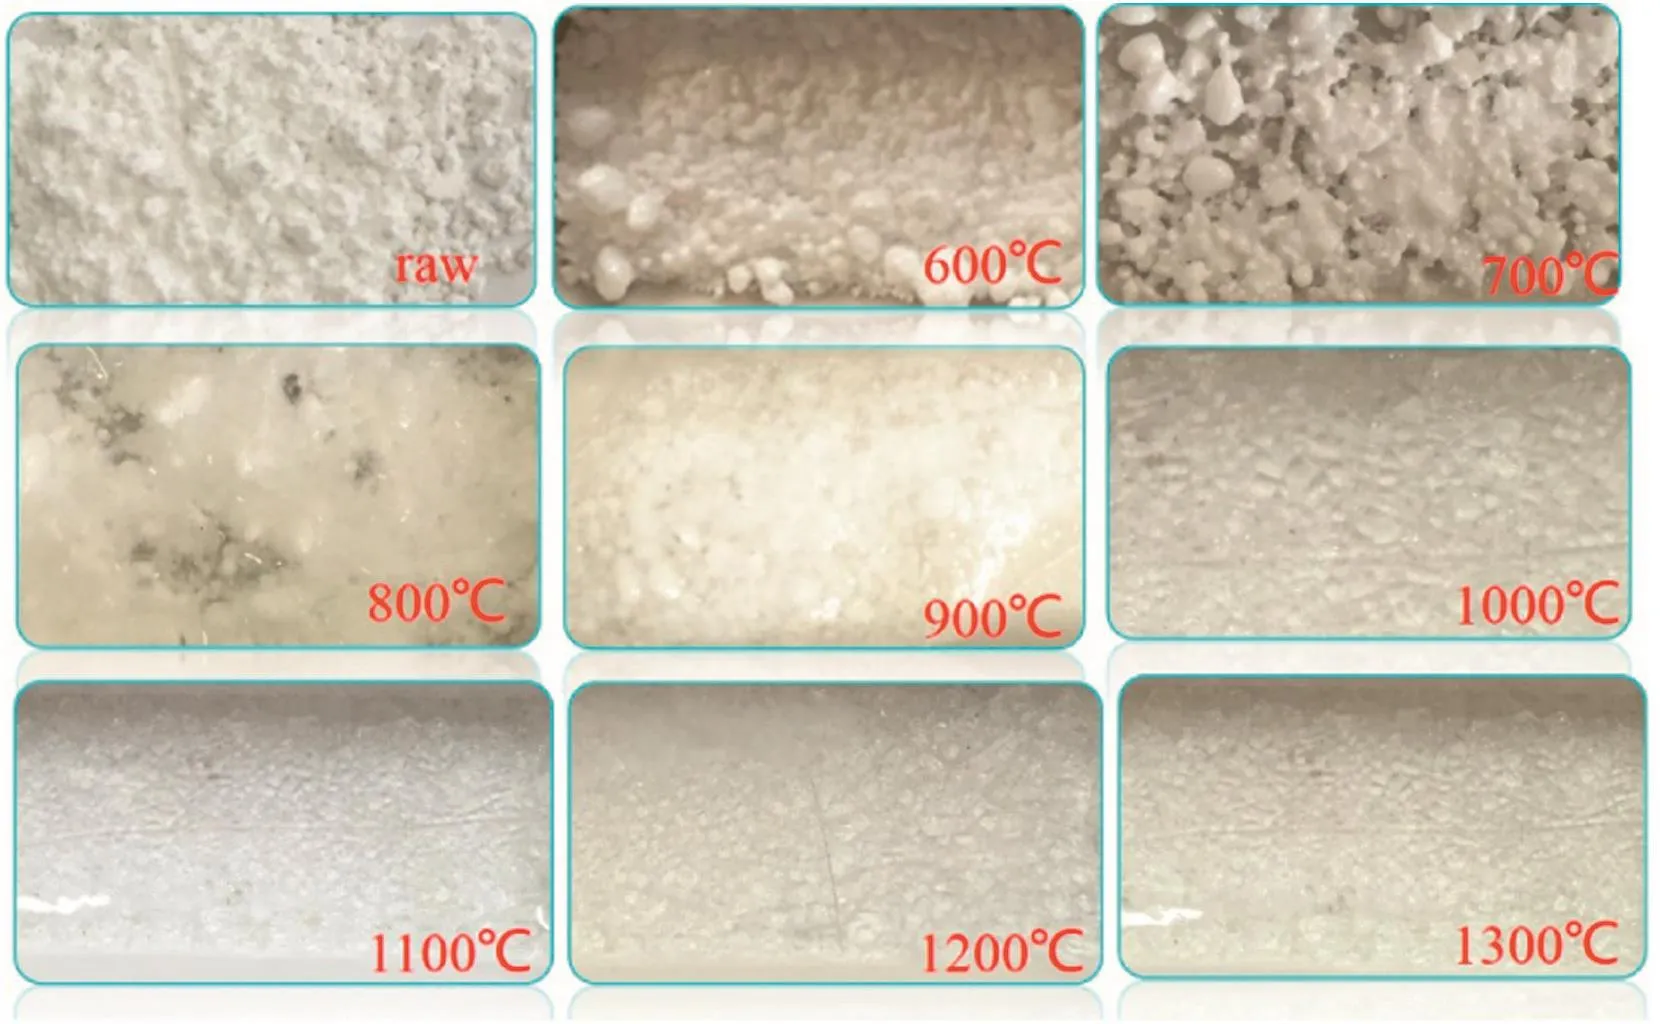
Fig.1.The apparent morphology of the “absorption”products of calcium phosphate at different temperatures.

Fig.2.The P2O5 content in the“absorption”products and the P2O5“absorption”amount per unit mass of calcium phosphate at different temperatures.
In addition,to compare with the result of the P2O5“absorption”by mixture of Ca3(PO4)2and SiO2later,the amount of P2O5“absorption”per unit mass of calcium phosphate(g/100 g)at different temperatures was calculated based on the P2O5content in the “absorption”products and a change in the Ca3(PO4)2mass before and after the “absorption”,and the result is also shown in Fig.2.The biggest P2O5“absorption”amount was 85 g P2O5per 100 g calcium phosphate at 900°C.
As shown in Fig.1,the“absorption”products at 1000–1300°C were vitreous body.To obtain their phase constitution information,the products were crystalized at 500°C for 24 h prior to XRD detection[29].
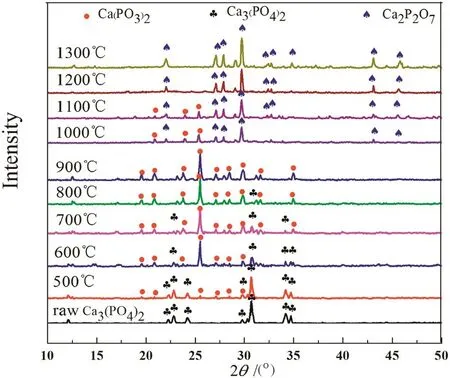
Fig.3.XRD patterns of the “absorption”products of calcium phosphate at different temperatures.
The XRD patterns of the “absorption”products of calcium phosphate at different temperatures are shown in Fig.3.As can be seen,calcium metaphosphate occurred in the “absorption”product at 500 °C.With increasing reaction temperature,its diffraction peaks gradually became strong while the ones of calcium phosphate became weak and almost disappeared at 800°C.Calcium pyrophosphate appeared in the“absorption”product at 1000 °C and its diffraction peaks gradually strengthened with increasing temperature while the ones of calcium metaphosphate slowly weakened and completely disappeared at1200°C.
Based on the analyses of P2O5content and XRD patterns of the“absorption”products at different temperatures,it can be determined that the reaction of gaseous phosphorus pentoxide with calcium phosphate takes place at a wide temperature range from 500 to 1300°C.At 500–900 °C,the “absorption”reaction can be expressed as:

A nearly phase-pure “absorption”product calcium metaphosphate(Ca(PO3)2)was obtained at 900 °C with its melting point≤900 °C as demonstrated in Fig.1.At 1000–1100 °C,another“absorption”reaction for formation of calcium pyrophosphate occurred simultaneously besides the Reaction(1)and can be expressed as:

At 1200°C only the Reaction(2)was observed and a nearly phasepure “absorption”product calcium pyrophosphate(Ca2P2O7)was obtained with its melting point≤1200 °C as demonstrated in Fig.1.
The SEM images of calciumphosphate and its“absorption”products at900 and 1300°C are shown in Fig.4.Itcan be seen that calcium phosphate was loose minute powder with particle size less than several μm and was transformed into strip-structure and compact massive products of several dozens μm after reacting with gaseous phosphorus pentoxide at 900 and 1300°C,respectively,which were identified as calcium metaphosphate and calcium pyrophosphate by a combined EDS analysis.
Thermalstability ofthe“absorption”productobtained at900°C(calcium metaphosphate)was investigated by using TG/DSC analysis and the result is shown in Fig.5.A considerable weight loss was observed in the temperature region from 900 to 1400°C,while at the same time an endothermic peak appeared at 1151°C on DSC curve,indicating that calcium metaphosphate was decomposed.
The “absorption”product at 900 °C(actually the calcium metaphosphate)was calcined at different temperatures under N2atmosphere for 40 min and the slags thus obtained were analyzed by using XRD.The results are shown in Fig.6.

Fig.4.SEM of calcium phosphate and its“absorption”products.
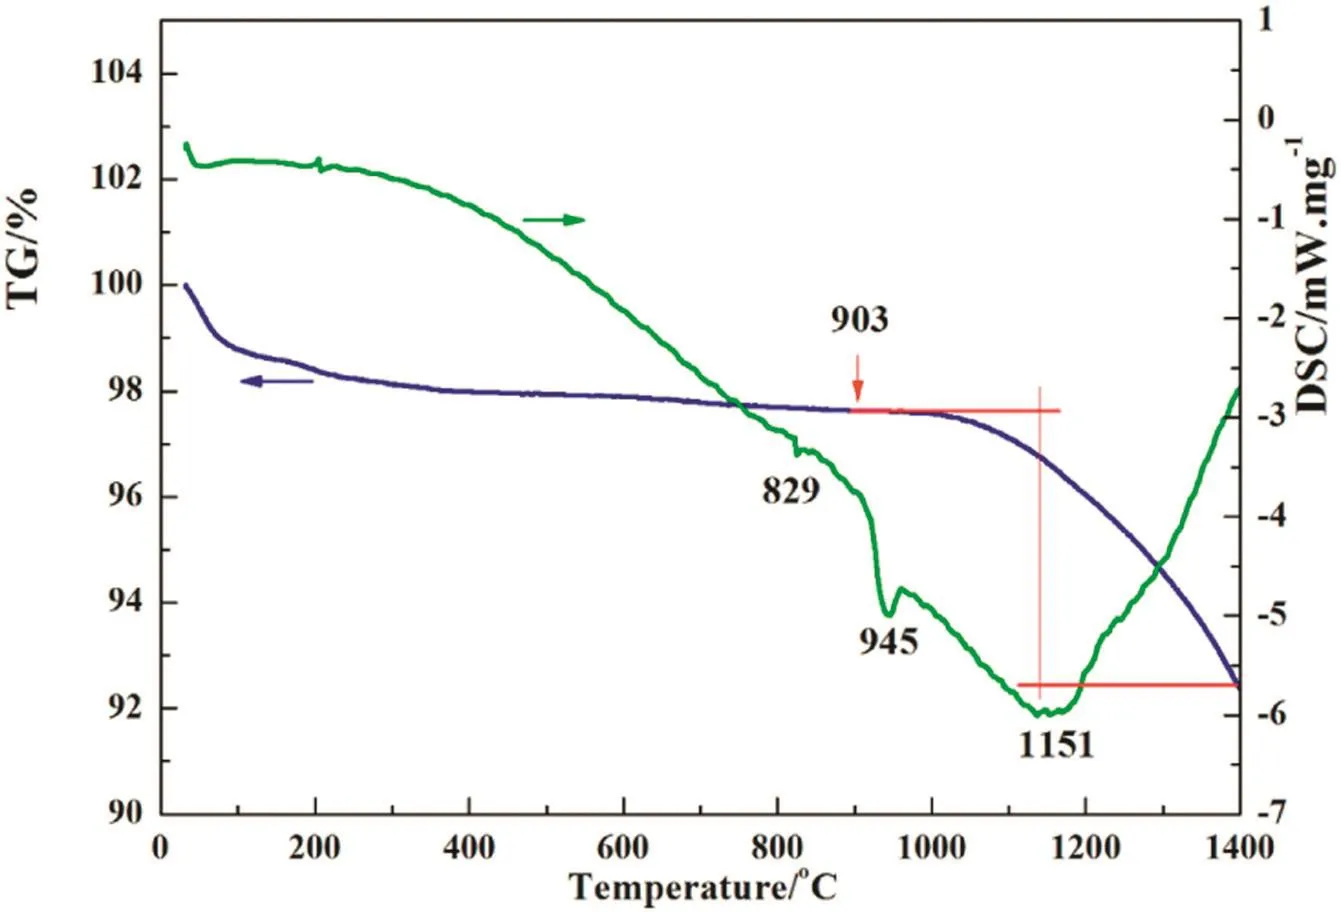
Fig.5.TG and DSC curves of the “absorption”product of calcium phosphate obtained at 900 °C.

Fig.6.XRD patterns of calcium metaphosphate calcined at different temperatures.
Calcium pyrophosphate are observed to appear in the slags at the roasting temperature beyond 1000°C and its diffraction peaks strengthened with increasing temperature while the ones of calcium metaphosphate gradually weakened.At 1200°C,the calcium metaphosphate almost completely disappeared.The results indicate that calcium metaphosphate will be decomposed to calcium pyrophosphate at high temperatures and the reaction can be expressed as:

As a conclusion,the three reactions from Eqs.(1)to(3)would take place at the same time upon the “absorption”of gaseous P2O5by calcium phosphate at 1000–1100 °C.
3.2.Reaction of gaseous P2O5 with silicon dioxide
Pure silica contacted and reacted with gaseous phosphorus pentoxide at different temperatures for 40 min as described in Experimental procedure,and the apparent morphology of the“absorption”products is shown in Fig.7.The raw material silica was dispersible powder.With increasing reaction temperature the product particles began to agglomerate or sinter,which resulted in formation of large quantity of cracks.At 1000°C a significant surface fusion was observed.
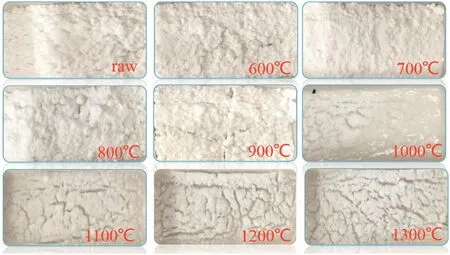
Fig.7.The apparent morphology of the “absorption”products of silica at different temperatures.
The P2O5contents in the“absorption”products ofsilicon dioxide are shown in Fig.8.As can be seen,the P2O5content was only 4%at 500°C.With increasing reaction temperature,the P2O5content increased monotonically until 1000°C,beyond which it began to decrease.The maximum P2O5content was 22%at 1000°C.
Similarly,the amount of P2O5“absorption”per unit mass of silica(g/100 g)at different temperatures was calculated based on the P2O5content in the “absorption”products and a change in the SiO2mass before and after the “absorption”,and the result is also shown in Fig.8.The biggest P2O5“absorption”amount was 31 g P2O5per 100 g silica at 1000°C.
The XRD patterns of the “absorption”products of silica obtained at different temperatures and crystallized at 500°C are shown in Fig.9.As can be seen,no new diffraction peaks are observed besides silicon dioxide below 700 °C and beyond 1100 °C,and a new crystalline phase silicon pyrophosphate(SiP2O7)occurred in the temperature range from 800 to 1000 °C.This indicates that the “absorption”reaction between silicon dioxide and gaseous phosphorus pentoxide took place and it can be expressed as follows:

It should be noted that although the P2O5content in the products obtained atthe temperatures≤700°C and≥1100°C was notlow,no diffraction peaks of phosphorus-containing crystalline phases were observed.Even though the content in the “absorption”product at 1000 °C reached up to 22%,the corresponding diffraction peaks are stillnotstrong,indicating that silicon pyrophosphate has a poor crystallinity.
Besides,although the melting point of pure silicon dioxide is about 1650°C and the one of pure silicon pyrophosphate was reported to be 1400°C[30],the result shown in Fig.7 demonstrated that there was a eutectic point of≤1000 °C in SiO2-SiP2O7binary system.
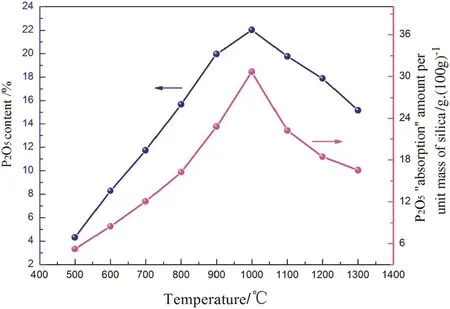
Fig.8.The P2O5 content in the “absorption”products and the P2O5“absorption”amount per unit mass of silica at different temperatures.
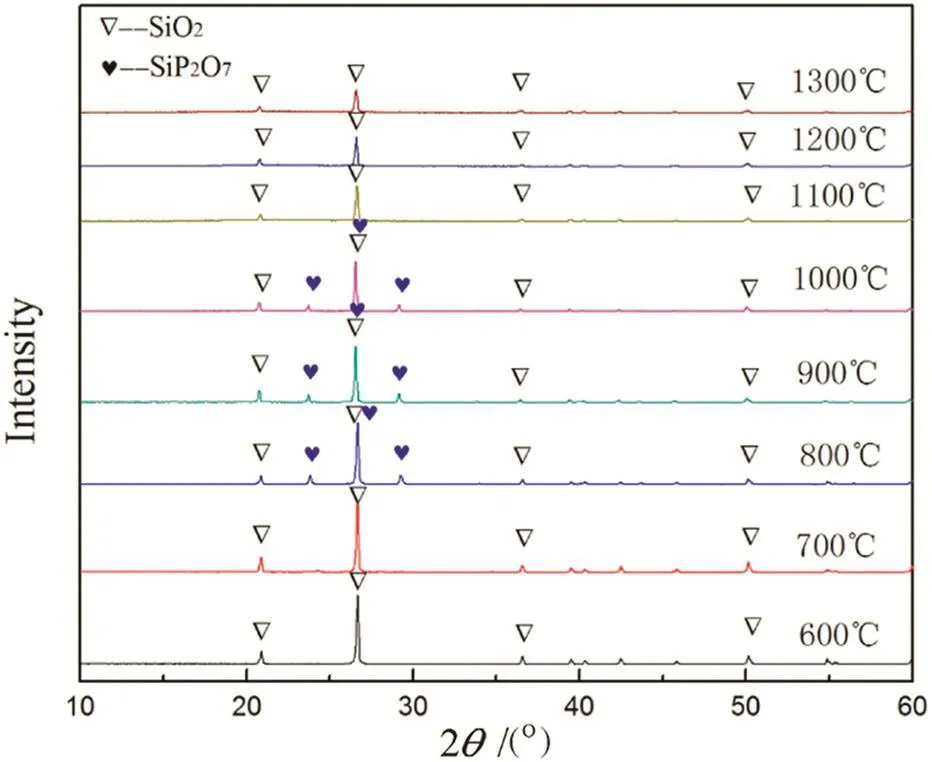
Fig.9.XRD patterns of the “absorption”products of silicon dioxide at different temperatures.

Fig.10.The FT-IR spectra of the “absorption”products of silicon dioxide.
Fig.10 illustrates the FT-IRspectra ofsilica and its“absorption”products at different temperatures.The characteristic peaks at 1084,799 and 461 cm-1are attributed to the Si–O–Siasymmetric stretching vibration,symmetric stretching vibration and bending vibration,respectively[31].The peak at 1084 cm-1was split into two peaks after the “absorption”at 1000°C.One peak at 1193 cm-1corresponds to non-bridge oxygen asymmetric stretching vibration of P2O72-and the other peak at 1058 cm-1is assigned to the non-bridge oxygen symmetric stretching vibration of P2O72-[32].
Moreover,a new peak at~700 cm-1is observed in the“absorption”products of 700 °C and 1300 °C compared with raw silicon dioxide,which is attributed to the vibration of P2O72-[32].The result indicates that FT-IR detection seems more sensitive to P2O72-group than XRD since no silicon pyrophosphate phase was observed at the two temperatures in Fig.9.
The SEM images of“absorption”products of silica at two temperatures are shown in Fig.11.Through a combined EDS analysis,the bulky compact particles at 600 °C with size of 5–10 μm were identified as silica while the floc-like particles at 1000°C(shown in Fig.11b)seemed to be comprised of ~1 μm tiny granules and have a layered structure in an enlarged view(shown in Fig.11c),which were silicon pyrophosphate.
Thermal stability of the “absorption”product of silica at 1000 °C was investigated by using TG analysis and the result is shown in Fig.12.A considerable weight loss was observed in the temperature region from 923 to 1150°C,indicating decomposition of silicon pyrophosphate.
The “absorption”product of silica obtained at 1000 °C was calcined at different temperatures for 40 min and the XRD patterns of calcined productsare shown in Fig.13.Clearly,the diffraction peaks ofsilicon pyrophosphate disappeared after calcinations at≥1100°C.Combined with the TG analysis above,it can be determined that silicon pyrophosphate would be decomposed to silicon dioxide and phosphorus pentoxide when the temperature is over 1100°C.

3.3.Reaction of gaseous P2O5 with mixture of silicon dioxide and calcium phosphate
The powders of calcium phosphate and silica with their mole ratio of 2:1 were thoroughly mixed in an agate mortar and reacted with gaseous P2O5.Fig.14 shows the apparent morphology of“absorption”products of the mixture at different temperatures.As can be seen,the“absorption”products of the mixture were obviously looser than the ones of pure calcium phosphate powder at the temperatures from 600 to 800 °C.Beyond 900 °C,a large area of fusion was evident although there were still quite lots of white crystals present among the melt.The crystals should be the unreacted silicon dioxide.
The P2O5contents in the “absorption”products of mixed calcium phosphate and silica were measured and are shown in Fig.15.The theoretical P2O5content in the mixture is 21.2%.After reacting with gaseous P2O5,the P2O5content in the “absorption”product reached 57.3%at 600 °C and still remained up to 49.5%at 1300 °C although the P2O5content decreased with increasing temperature.

Fig.11.SEM of the “absorption”products of silica.
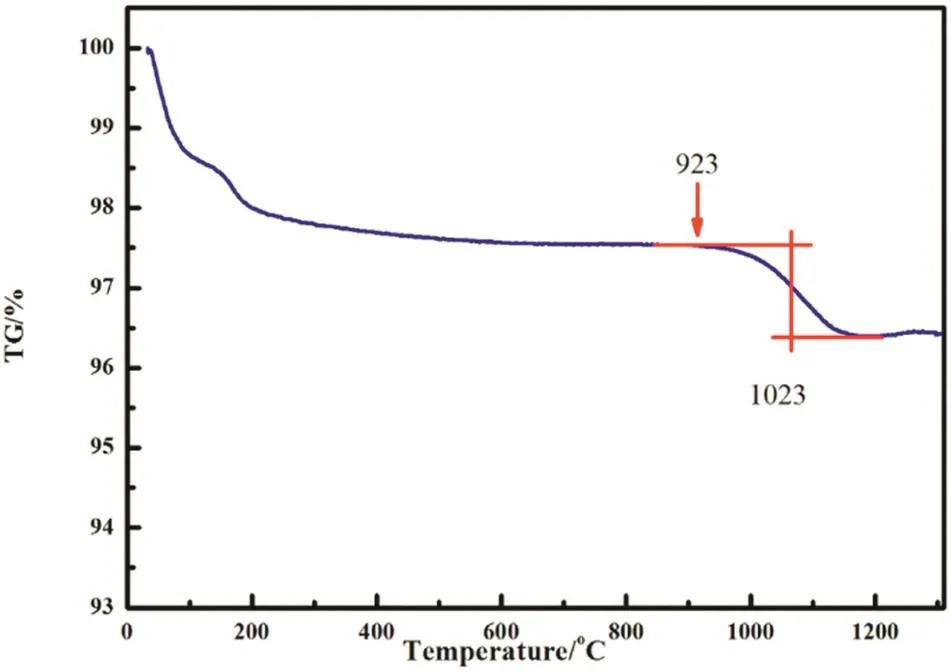
Fig.12.TG curve of the “absorption”products of silicon dioxide obtained at 1000 °C.
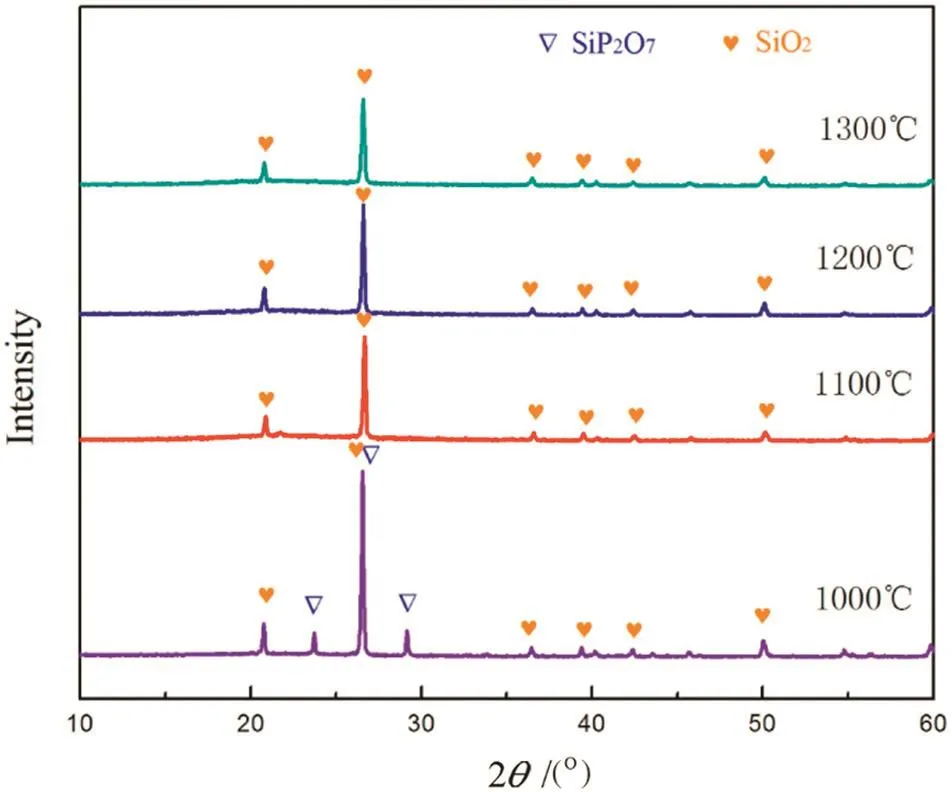
Fig.13.XRD patterns of the “absorption”product of silicon dioxide after calcined at different temperatures.
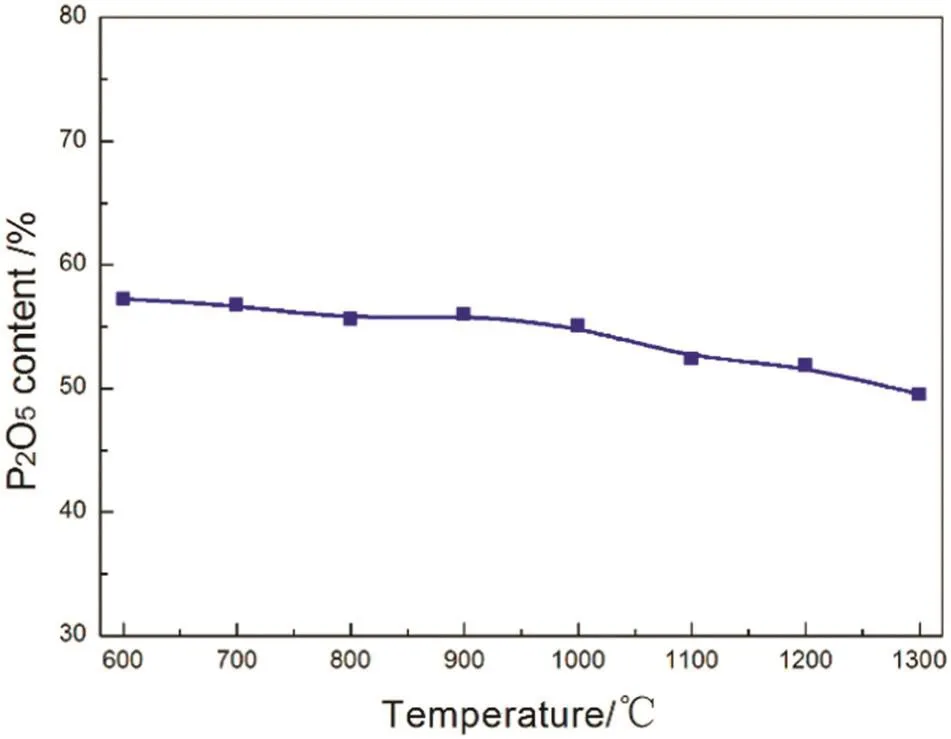
Fig.15.Variation of the P2O5 content of“absorption”products of mixture with reaction temperature.
The amount of P2O5“absorption”per unit mass of the mixture(g/100 g)at different temperatures was calculated based on the P2O5content in the “absorption”products and a change in the mass of mixture before and after the “absorption”,and the result is also shown in Fig.16.To compare the P2O5“absorption”by the mixture with the ones by pure calcium phosphate and silica,the data from Figs.2 and 8 were further processed.Set,where X and Y stand for the “absorption”amounts of P2O5in pure calciumphosphate in Fig.2 and pure silicon dioxide in Fig.8,respectively,ω1%and ω2%stand for the mass fraction of calcium phosphate and silicon dioxide in the raw material mixture,respectively.Obviously,M represents the theoretical or calculated“absorption”amount of P2O5in the mixture based on the “absorption”of pure raw materials.Variation of M with temperature is also shown in Fig.16.Clearly,the experimental values of P2O5“absorption”are remarkably bigger than the theoretical ones,especially in the low and high temperature ranges.The result demonstrates existence of a synergistic effect for the “absorption”upon using mixed calcium phosphate and silica as raw material.

Fig.14.Morphology of the “absorption”products of mixture.

Fig.16.Variation of the “absorption”amounts of P2O5 in the mixture with temperature.
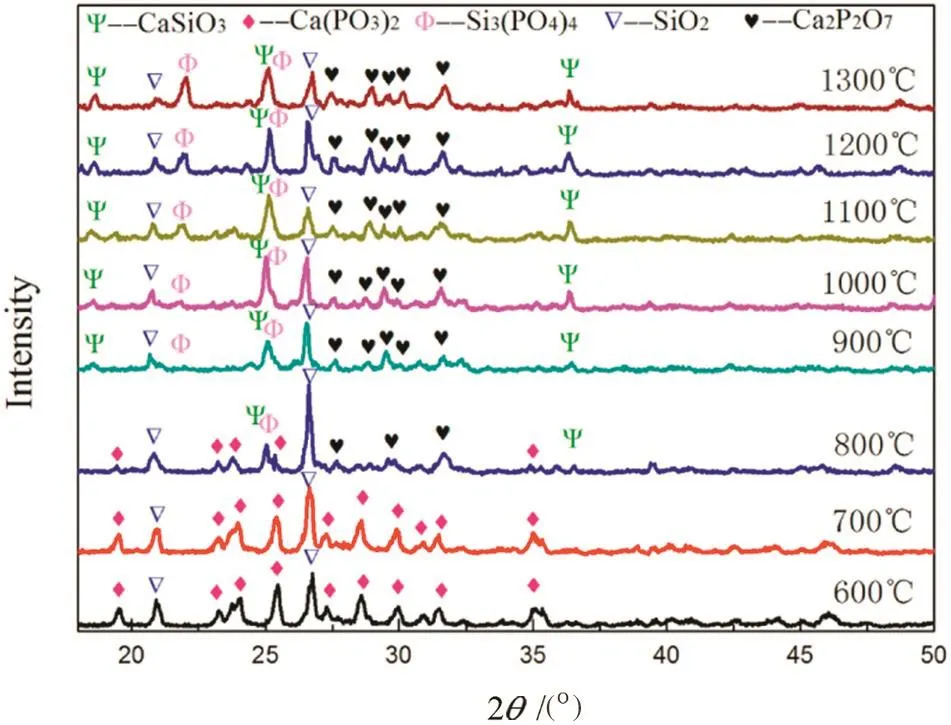
Fig.17.XRD patterns of the “absorption”products of mixture at different temperatures.
Fig.17 shows XRDpatterns ofthe“absorption”products ofmixture at different temperatures.As can be seen,the main phases at 600–700 °C were calcium metaphosphate and silica,and no calcium phosphate was observed while calcium phosphate was still present when it separately reacted with P2O5shown in Fig.3.Comparing Fig.1 with Fig.14,it was found that a looser structure occurred in the “absorption”products of mixture instead of pure calcium phosphate at the two temperatures.Since silicon dioxide can't react with phosphorus pentoxide at the temperatures as shown in Fig.9,it actually acts as an inert material present in the mixture,which forms porous structure.This is bene ficial for the mass transfer of phosphorus pentoxide into the mixture inside hence strengthening the “absorption”of calcium phosphate at low temperatures(Eq.(1)).At 800°C calcium pyrophosphate had occurred and the main phases at900–1300°C were silica,calcium pyrophosphate,calcium silicate(CaSiO3)and silicon phosphate(Si3(PO4)4).Compared with the“absorption”by pure calcium phosphate,the formation temperature of calcium pyrophosphate was lower and two new phases,i.e.,CaSiO3and Si3(PO4)4,were observed for the first time.
Based on the XRD analysis above,we infer that the following reactions might take place at 800–1300 °C:

A cascade reaction of SiO2with Ca2P2O7promotes Reaction(6)towards the positive direction,thus enhancing the “absorption”by calcium phosphate.
It should be noted that no silicon pyrophosphate was observed in the “absorption”products of mixture,which may be due to relatively low content and low crystallinity of silicon pyrophosphate in the“absorption”products.What is more,the mechanism of reaction process is shown in Scheme 2.

Scheme 2.Schematic mechanism of reaction process of mixture.

Fig.18.SEM of the mixture and its“absorption”products.
Fig.18 shows the SEM micrographs of the raw mixture and its“absorption”products at 700 and 1000 °C.Combined with EDS analysis,the minute particles and the 30–40 μm compact bulky particles shown in Fig.18a were calcium phosphate and silica,respectively.The strip-like particles in Fig.18b were calcium metaphosphate while the massive particles of 15–20 μm in Fig.18c were calcium pyrophosphate.
4.Conclusions
In this study the reactions ofgaseous phosphorus pentoxide with solid calcium phosphate,silicon dioxide and their mixture were investigated,respectively,by combined chemical analysis and characterization of XRD,FT-IR,TG-DSC,and SEM-EDS.The experimentalresults demonstrate that:
(1)The reaction of P2O5with pure calcium phosphate is initiated at 500 °C,the major“absorption”product at 600–900 °C is calcium metaphosphate with its melting pointbelow 900°C.The reaction can be expressed as follows:

Upon the temperature over 1000 °C,the “absorption”product shifts to be calcium pyrophosphate,which has a melting point≤1200 °C.The reaction can be expressed as follows:

The calcium metaphosphate formed atlow temperatures was unstable and would further decompose to more stable calcium pyrophosphate over 1000°C.
(2)The reaction of phosphorus pentoxide with pure silicon dioxide starts at 800°C by formation of silicon pyrophosphate and the most significant“absorption”occurs at 1000 °C with the melting point of“absorption”product≤1000 °C.The reaction can be described as follows:

When the temperature is over 1000 °C,the “absorption”reaction would proceed reversely.
(3)The “absorption”of P2O5by mixture of silicon dioxide and calcium phosphate is aggravated compared with the one over pure calcium phosphate due to existence of SiO2.At 600–700°C silicon dioxide can act as an inert material,which is helpful to form a porous structure,thus enhancing the mass transfer of gaseous phosphorus pentoxide into the mixture inside and the“absorption”reaction.At higher temperatures the coupled“absorption”by calcium phosphate and the reaction between silicon dioxide and the “absorption”product calcium pyrophosphate strengthens the reaction of P2O5with the mixture.The reactions can be described as follows:

References
[1]L.C.C.Jr.,Treatment of Phosphoric Acid Process,Apparatus and Product:US,US3649175 A[P],1972.
[2]Chao Ma,Yuan-xin Wu,Fang Jin,et al.,Current status and prospect of industrial phosphoric acid production,Chem.Eng.41(6)(2013)74–78.
[3]Yu-ping Zhu,Industrialization prospects of KPA,Phosphate Compd.Fertil.23(5)(2008)25–28.
[4]Yan-feng Li,Xi-zhu Bai,Guo-chao Sun,Technology development of CDK kilnprocess phosphoric acid,Phosphate Compd.Fertil.26(2)(2011)24–27.
[5]Yan-feng Li,Hui Hu,Chen Yu,et al.,Industrial production experiments development of kiln-process phosphoric acid,Phosphate Compd.Fertil.28(1)(2013)25–29.
[6]S.V.D.Sluis,A.H.M.Schrijver,F.P.C.Baak,G.M.V.Rosmalen,Fluoride distribution coefficients in wet phosphoric acid processes,Ind.Eng.Chem.Res.27(3)(2002)527–536.
[7]T.A.Hendrickson,Production of Ortho Phosphoric Acid:US,US3341289[P],1967.
[8]W.C.Saeman,Phosphorus Recovery Feed Control Method:US,US3558114[P],1971.
[9]C.L.Levermore,R.E.Vivian,Manufacture of Phosphoric Acid:US,US2075212 A[P],1937.
[10]W.C.Lapple,Production of phosphorus pentoxide from a phosphatic ore.US,US3241917[P],1996.
[11]W.C.Lapple,Recovery of phosphorus values and cement clinker from a phosphatic ore.US,US3235330[P],1966.
[12]J.A.Megy,R.A.Hard,Process for reducing phosphate ore.US,US4351809[P],1982.
[13]J.C.Barber,Production of Phosphorus and Phosphoric Acid:US,US 4656020 A[P],1987.
[14]M.U.Jacob,L.Frederic,W.C.Park,et al.,Reduction of phosphate ores by carbon part:Process variables for design of rotary kiln system,Metall.Trans.B 12(17B)(1986)861–868.
[15]L.Frederic,R.Howard,M.U.Jacob,et al.,Reduction of phosphate ores by carbon part II:Rate limiting steps,Metall.Trans.B 17(1986)869–877.
[16]Joseph A.Megy,137 Casa Sueno Ct.,Richland,WA(US)99352,2008.Phosphorous pentoxide producing methods:US,US7378070B2.
[17]Xian-guo Yin,Discussion on the current trial production of CDK kiln-method phosphoric acid technology in China,Phosphate Compd.Fertil.22(1)(2007)33–35.
[18]F.Leder,et al.,New process for technical-grade phosphoric acid,Ind.Eng.Chem.Process Des.Dev.24(3)(2002)688–697.
[19]Vincent Ssuchell,Chemistry&Technology of Fertilizer,Reinhold Publishing Corp,New York,1960 346.
[20]A.E.Hokanson,D.Williams,C.S.Williams,Method of Forming Phosphoric Acid from Phosphate Ore:US,US20050002845 A1[P],2005.
[21]D.Williams,C.Williams,A.Hokanson,Method of Producing Phosphoric Acid from Phosphate Ore,WO/2004/052938[P],2004.
[22]D.B.Blake,J.A.Megy,S.A.Pachpor,et al.,Phosphorous Pentoxide Producing Methods and Systems with Increased Agglomerate Compression Strength:,US20160090305[P],2016.
[23]Shanxiang Jiang,Discussion on improving reduction rate of kiln phosphoric acid(continued),Phosphate Compd.Fertil.(2)(1995)10–15.
[24]Shanxiang Jiang,Discussion on improving reduction rate of kiln phosphoric acid,Phosphate Compd.Fertil.(1)(1995)13–17.
[25]K.D.Jacob,D.S.Reynolds,W.L.Hill,Reduction of tricalcium phosphate by carbon,Ind.Eng.Chem.20(1)(2002)1204–1210.
[26]J.A.Megy,Phosphorous Pentoxide Producing Methods:US,US7910080 B2[P],2011.
[27]Honghui Yang,Chun Li,Bin Liang,et al.,Thermodynamics of reactions for producing phosphoric acid by kiln method,Chem.React.Eng.Technol.27(6)(2011)543–549.
[28]Keli Jiang,Liyou Qiu,Bin Liang,et al.,Solid reaction mechanism for the thermal reduction of fluorapatite by carbon,J.Chengdu Univ.Sci.Technol.1(1995)1–5.
[29]Xiao-feng Liang,Shi-yuan Yang,Guang-Fu Yin,Raman spectra analysis for calcium metaphosphate structure transformation in glass preparation process,Chin.J.Inorg.Chem.26(8)(2010)1404–1408.
[30]J.Zhang,Y.Yan,Q.Chu,et al.,Solid phosphoric acid catalyst for propene oligomerization:Effect of silicon phosphate composition,Fuel Process.Technol.135(2015)2–5.
[31]Chengzhong Zhang,Jinglin You,Hui Chen,et al.,Vibrational modes and in-situ high temperature Raman spectra of zircon,J.Chin.Ceram.Soc.34(10)(2006)1172–1176.
[32]Yu-hua Cao,Dong-xiang Wei,Lu-gen Huang,Study on composition and surface structure of silicon phosphate/boron phosphate by FT-IR,J.Catal.4(1992)285–290.
 Chinese Journal of Chemical Engineering2018年4期
- Chinese Journal of Chemical Engineering的其它文章
- An innovative design of septic tank for wastewater treatment and its performance evaluation:An applicable model for developing countries
- CFD modeling of turbulent reacting flow in a semi-batch stirred-tank reactor☆
- Synergistic and interference effects in coaxial mixers:Numerical analysis of the power consumption☆
- Atomic layer deposition of Al2O3 on porous polypropylene hollow fibers for enhanced membrane performances☆
- Experimental investigation and cost assessment of the salt production by solar assisted evaporation of saturated brine☆
- Equilibrium of liquid-liquid extraction of 2-phenylbutyric acid enantiomers:Experiment and model☆
