Kinetic studies on extra heavy crude oilupgrading using nanocatalysts by applying CFD techniques☆
Javad Aminian Dehkordi,Arezou Jafari,*,Seyyed Amir Sabet,Fatemeh Karami
1 Faculty of Chemical Engineering,Tarbiat Modares University,Tehran,Iran
2 Islamic Azad University,Shahrood,Iran
1.Introduction
Recently,extraction and application of heavy and extra heavy crude oil have received more consideration because of the accretion of global energy consumption and the scarcity of light crude oil.Research revealed that about 80%of global energy demands will be supplied by oil and gas productions within the next two decades[1].Based upon International Energy Agency(IEA)reports,about 70%of extractable deposits of oil throughout the world are related to heavy and extra heavy crude oil and bitumen[2].However,the demand for heavy and extra heavy crude oil is very low due to difficulties in its transportation and refinement.Not only are the extraction and transportation of heavy and extra heavy crude oil difficult processes,but also the extracted oil has the leastvalue and lowestprice in the globaloilmarket.Transportation of heavy and extra heavy crude oil has encountered some adversity owing to high viscosity and low flowability.Thus,it is essential to reduce the viscosity of heavy and extra heavy crude oil through in-situ operations or immediate actions after extraction to minimize transportation costs.Many efforts have been made over recent years to upgrade heavy crude oil so as to enable pertinent and beneficial improvements.
Among various upgrading processes,thermal catalytic cracking(TCC)has garnered much attention as one of the most efficient processes of upgrading heavy and extra heavy crude oil[3].Except for a few studies that investigated the upgrading of extra heavy crude oil in a catalytic cracking process,like Ren et al.[4]who used dimethyl benzene sulfonic copper as a catalyst,research has concentrated on upgrading heavy oil.Breaking hydrocarbons in the presence of catalysts leads to more light hydrocarbons with higher selectivity in lower temperatures.Generally,a catalyst is an operant factor in the upgrading of heavy and extra heavy crude oil which influences product distribution.Researchers have shown that type of catalyst is substantial to products and optimumconditions[5].Compared to catalysts,nanocatalysts have higher efficiency due to their higher surface area perunitvolume[6].Thus,itis desired to apply nanocatalysts in cracking processes.
The high viscosity of heavy and extra heavy crude oil is related to macromolecule compounds like asphaltene and resins[7].Generally,crude oil is a combination of a large amount of hydrocarbons,wax,and asphaltene for which a specified structure can hardly be defined[8].Extractable crude oil consists of 83%-87%carbon,10%-14%hydrogen,and other ingredients like sulfur,nitrogen,etc.[9].Researchers have reported that in the chemical structure of oil,single bonds(and among them carbon-sulfur,carbon-nitrogen,and carbon-carbon)have the least dissociation energy.Compared to the carbon-carbon double bond,the carbon-carbon single bond has less dissociation energy.Thus,this defines the main mechanism for viscosity reduction in heavy crude oil[7,10].However,it seems that there is no appropriate detailed study on changes to the chemical structure of extra heavy crude oil.Therefore,in this study,experimentaltests and computational fluid dynamics(CFD)were simultaneously applied to investigate the kinetic reaction of thermal catalytic cracking of extra heavy crude oil.
Recently,numerical simulations,especially CFD,have received attention from experts in numerous fields related to heavy crude oil.Nayak et al.[11]used the Eulerian-Lagrangian approach to simulate vaporization as well as cracking of liquid oil in a FFC riser by applying VGOas the feedstock and severalkinetic models reported in the literature.Chang et al.[12]investigated hydrodynamics and cracking reactions in a heavy oil riser and concluded that applying CFD not only reduces costs and time,butalso helps to better analyze the process.Behjat et al.[13]investigated the hydrodynamics and heattransferofa three-phase reaction using CFD;they reported that CFD offered acceptable predictions related to the process.Remarkably,a pertinentgeneralkinetic modelcould hardly be found for the catalytic cracking of extra heavy crude oil.Therefore,this investigation aimed to reduce operational and time costs and applied CFD,for the firsttime ever,to propose a kinetic modelfor predicting extra heavy oil viscosity reduction in a thermal catalytic reaction.
Accordingly,the objective of the presentstudy wasto employ experiments and CFD simultaneously to scrutinize extra heavy crude oil in a viscosity reduction process in the presence of nanocatalysts.Also,presenting a kinetic model based on experimental procedures and the equations reported in the literature for the process of reducing the viscosity of extra heavy crude oil wasanothermain target of this investigation.Based on a detailed literature review and to the best of the aut hors'knowledge,this is the first study that highlights the main parameters and their interactions that influence the process of upgrading extra heavy crude oil through CFD.In this study,a two-phase model was developed based on the experimental setup.The heat transfer,hydrodynamics,and cracking reaction behavior of the system are described and analyzed in the simulated reactor.Finally,a sensitivity analysis was performed to investigate how input parameters influence the upgrading process of extra heavy crude oil.The findings offer beneficial information about cracking kinetic reactions as well as optimizing input parameters and facilitating the design and development of TCC processes.
2.Experimental
2.1.Experimental setup
All experiments were carried out in a Pyrex batch reactor with a 500-ml volume and 4-mm thickness and equipped with an analog heating mantle magnetic stirrer.This magnetic stirrer was required to reach a homogenous mixture and enhance the catalytic reaction of the extra heavy crude oil by heating it in the presence of nanocatalysts.However,the stir was performed in the beginning and stopped after the mixture reached an approximately homogenous state.Vaporization made deviations in measuring the average viscosity ofthe system.Thus,to avoid the occurrence of vaporization,a vertical condenser containing cold water(0°C)was attached at the reactor outlet.Cold water was circulated into the vertical condenser through a pump.It is notable that the batch reactor was applied to handle materials better.Fig.1 represents the schematic of the experimental setup used in this study.It should be noted that only the reactor(the dashed box in Fig.1)was generated for the simulations.
In the experiments,the batch reactor was charged with 20 ml extra heavy oil obtained from an Iranian reservoir.Due to high viscosity of the oil,the reactor was first heated to 343-353 K;then,by adapting the stirrer with 1400 r·min-1and producing turbulences,the nanocatalyst powder as a dispersed catalyst was poured into the reactor to gain a homogeneous mixture.Thereafter,to avoid explosive reactions,the reactor mixture was heated at a moderate rate(2 K·min-1)to 723 K under atmospheric pressure(experiments showed that cracking reactions began at 623 K[14]).After that,heating was stopped,and the mixture was cooled to room temperature so as to measure the mixture's viscosity using a Brook field viscometer.
2.2.Materials
The properties of extra heavy oil sample used for investigating the cracking reactions are presented in Table 1.

Table 1 Properties of extra heavy oil sample
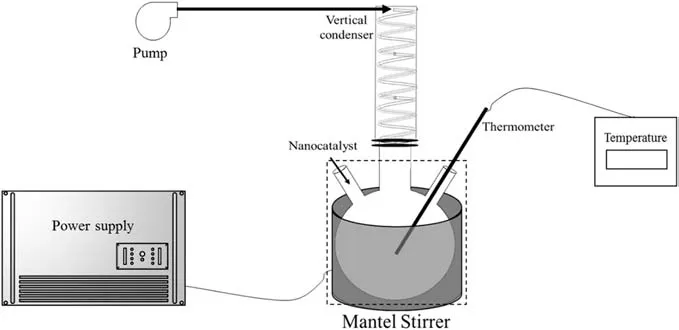
Fig.1.Schematic of the experimental setup for cracking of extra heavy crude oil.
Compared to bulk catalysts,nanocatalysts have larger surface area per unit,representing betterchemicaland physical properties[15].Therefore,two types of nanoparticles were applied as dispersed catalysts.Silica nanocatalyst with 99%silicon oxide purity,11-13 nm diameter,and 600-785 m2·g-1surface area were received from USNano.This nanoparticle is inexpensive,abundant in nature,and easily synthesized.Further,a nickel oxide nanocatalyst with a diameter of about 19.5 nm was synthesized through the decomposition of nickel nitrate and ammonia.Further information on synthesizing nickel oxide nanocatalysts is available in the literature[14].Fig.2 represents the SEM images of the SiO2and NiO nano catalysts.
3.Uncertainty Analysis
A basic problem in chemical engineering is uncertainty in measurements and modeling.It has been proven that uncertainties and errors are sometimes notable due to limited and incomplete information[16].Consequently,accepting and considering the uncertainties explicitly rather than ignoring them is the first step to reaching suitable accuracy[17].Generally,uncertainties are categorized into two groups:statistical uncertainties related to the changes of unknown variables of the same experiment,and systematic uncertainties that arise from the discarding of possible parameters in a model[18,19].In the experiments,uncertainties could have appeared from instrument selection and calibration or been caused by the operator or the environment[20].Therefore,in experiments regarding the upgrading of extra heavy crude oil,temperature,crude oil amount,and the amount of the nanocatalyst as well as the oil viscosity were measured using expedient instruments.
4.CFD Model Development
In the present study,the cracking reaction of extra heavy crude oil was predicted using CFD,and experiments were performed to validate and examine the accuracy of the results obtained through the CFD model.
4.1.Governing equations
Investigations confirmed that the reaction mixture in the batch reactor had a complex behavior.At moderate temperatures,it was observed that the oil mixture regime was laminar,whereas increasing the reactor temperature caused the turbulence effects to appear.To justify this behavior,the appropriate turbulent model was adopted.The mixture model,which can predict the behavior of phases by simultaneously solving the continuity,momentum,and energy equations for the mixture and the volume fraction equations for the secondary phases,was also applied to take into account the effects of nanoparticles.It is worthy to note that this model can predict the behavior of nanoparticle-size materials[21-23].The governing equations are presented below.
4.1.1.Momentum conservation equation
Changes of momentum and velocity are given by the following equation:

which is related to the conditions in which fluid is single-phase[24].In Eq.(1),t,ρ,u,p,μ and F are time,mixture density,mixture velocity,mixture pressure,mixture viscosity and volume force,respectively.Changes in momentum based on the mixture model are given by Eq.(2).

in which subscripts c and d refer to the continuous phase(crude oil sample)and the discrete phase(nanocatalysts),respectively.Also,mdc,cd,and uslipare the mass transfer rate from the dispersed phase to the continuous,mass fraction of the dispersed phase,and relative velocity between two phases,respectively.Here,u is the mass-averaged mixture velocity.The relationship between the velocities of the two phases is defined by

where ϕ denotes the volume fraction and Dmdis a turbulent dispersion coefficient.To obtain cdand,Eqs.(5)and(6)would be applied[25].

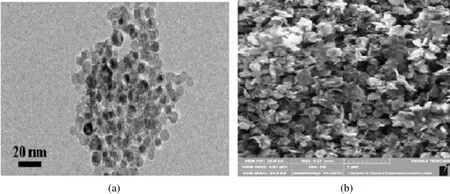
Fig.2.SEM image of(a)SiO2 and(b)synthesized NiO nanocatalyst.
Nϕdis described by

To calculate the relative velocity between two phases,the following equation is used.

where ddis the particles diameter;Cdrefers to the particle drag coefficient and is calculated using Schiller-Naumann models thatare appropriate for solid particles in a liquid[26,27].

Repis the particle Reynolds number and defined as:

The k-ε equation was adopted for higher temperatures when the mixture is turbulent[28].

where k is the turbulent kinetic energy,ε is the dissipation rate of turbulent kinetic energy,and μTis the turbulent viscosity.The turbulent viscosity and turbulent dispersion coefficient are respectively defined by

whereσTis the turbulent particle Schmidt number which was set to 0.35.σk,Cε2,and Cε1are parameters to be determined empirically.For constants in Eqs.(12)and(13),the following common values were adopted[29].(See Table 2.)

Table 2 Turbulence model constants
Moreover,the production term,Pk,was given by

In addition,the mixture density is defined by

Also,to calculate the mixture viscosity,the Krieger-type equation was used[23].

Here,ϕmaxis set to 0.62.
4.1.2.Continuity equation
The continuity equation forthe mixture(nanoparticle/extra heavy oil)was defined by

4.1.3.Energy conservation equation
Based on the energy governing equation,energy trans fer in the reactor was defined by:

In which Cp,T and k,respectively,refer to the mixture heat capacity,temperature and thermal conductive coefficient.In Eq.(17),the second term is related to the convective heat transfer,and it becomes zero for heat transfer in the solid phase(the reactor wall).
4.1.4.Mass transfer equation
To consider the effects of diffusion and reaction,the following equation was considered[30]:

where wi,ji,and Riare mass fraction,mass flux relative to the mass averaged velocity,and the rate expression describing the production or consumption related to component i,respectively.By applying the mixture model,mass flux could be defined by:

whereυT,Dim,DiT,and Mnare the undamped turbulent kinematic viscosity,effective diffusion coefficient,thermal diffusion coefficient,and mean molar mass,respectively.In addition,Mnand Dimgiven by[31,32]:

where Dikrefers to the diffusion coefficient of the component i,wiis the mass fraction and xkis the mole fraction.
4.2.Cracking kinetic equation
Based on a sophisticated literature review of articles on upgrading extra heavy crude oil through nanocatalysts[33,34],it was decided to consider the effect of nanocatalyst through Eq.(26).To simplify,sub-reactions were ignored and Eq.(26)was selected as the main reaction.Notably,the comparison of numerical results by experimental data confirmed this.

In the above reaction,a refers to extra heavy crude oil and b and c represent two types of light crude oil;in other words,by adding the nanocatalyst to material a,products b and c were generated as light crude oils.In a catalytic reaction,products depend strongly on such parameters as reaction temperature,nanocatalyst fraction,nanocatalyst type,and sample crude oil type.Accordingly,predicting properties of b and c requires detailed investigations based on experimental data.Nickel oxide and silica nanocatalysts were applied to predict the final products based on experimentaldata.In addition,viscosity was selected as the target parameter to examine the numerical results.
To predict the behavior of extra heavy crude oil,Eqs.(27)to(29)were used[35-37].

Also based on the experiment alresults in the absence of nanocatalysts,an equation for predicting the viscosity of extra heavy oilin the absence of nanoparticles was proposed.

With respect to experiments and according to equations reported in the literature(Eq.(31))[38],the average API gravity for upgraded oil was calculated by applying nickel oxide and silica nanocatalysts.In the experiments,extra heavy crude oil with different concentrations of NiO and SiO2nanocatalysts(0.5wt%,1wt%,and 1.5wt%for NiO and 0.5wt%,1.5wt%,and 3wt%for SiO2)was heated to 723 K.Then the sample was allowed to reach room temperature.After that,the final viscosity of the mixture was measured.In addition,with respect to the suggested reaction,CFD simulations were performed by guessing the API gravity of materials b and c with a trial-and-error algorithm.Eq.(31)was used to calculate related viscosities as a function of temperature.Finally,the Refutas equation was considered for calculating the final viscosity of the mixture consisting of materials a,b,and c[39].By carrying out the reaction,the viscosity of the mixture was decreased.Therefore,in the experimental procedure,the average viscosity of the mixture was discerned as a reaction yield criterion.Table 3 shows the calculated API gravity for products based on experimental data.


Table 3 Calculated APIgravity for products based on experimentaldata by use of equations reported in the literature[38].
To date,numerous equations have been presented for the reaction rate of upgrading extra heavy crude oil,yet none of them takes into account the effect of the selected nanocatalysts for extra heavy crude oil cracking.After performing some tests and comparing the results to the experimental results,Eq.(32)(presented by Lee et al.[40])was applied for the cracking reaction of upgrading extra heavy crude oil as it predicts the changes in properties well.

where K,k0,E0,and R are the reaction rate constant,frequency factor,and activation energy,respectively.In Eq.(32),k0is 7.978 × 10⁵·h-1and E0is 68.2495 kJ·mol-1.Conversely,it has been reported that in upgrading heavy and extra heavy crude oil,the concentration of the nanocatalyst has a salient effect on viscosity reduction[15,41].Therefore,a term was added to the reaction rate to consider the effect of nanocatalyst concentration(Eq.(34)).Thus,in Eq.(21),the term Riis given by

where ρpis the nanocatalyst density and f(ϕ)is a function of the nanocatalyst volume fraction.
4.3.Numerical method
Based on the batch reactor used for experiments,a three-dimensional reactor with a volume of 500 ml and an outlet diameter of 2.1 cm was spotted for the simulation and was meshed by tetrahedral elements as shown in Fig.3(a).Grids were created in the commercial software COMSOL 4.4,which is more capable of solving heat and mass transfer problems than other commercial software programs.Also,the differential equations were solved based on the finite element method.
Prior to the main simulations,grid independency tests were carried out to confirm that the numerical data was independent of the mesh.For this purpose,several grids with different sizes were produced.The tests were carried out at an initial temperature of 303 K,and water was selected as the domain material.It was assumed that the wall temperature of the reactor was 350 K considering the gravity force,and the single-phase model was applied to run the simulations.To compare the grids,the average temperature ofthe whole reactorwas calculated after 360 s.As shown in Table 4,increasing the number of elements caused the relative error between grids 2 and 3 to diminish to 0.79%.Thus,to decrease computational costs and save time,grid 2 with 180453 elements was selected for simulations.
To represent a better visualization of grid 2(Fig.2(b)),the highlighted part has been magnified.
4.4.Sensitivity analysis
An essential part of the simulation study is sensitivity analysis in which represents useful information about controlling parameters of the process and the interactions between them.In this study,a Box-Behnken design,a strategic method used to obtain the response surface model,was adopted as a beneficial tool for analyzing and optimizing the input parameters[42,43].To analyze the role of each parameter on the final results,the statistical models were obtained using Design-Expert 7.0 software.The main effective parameters influencing the process including nanocatalyst type,diameter,and concentration and extra heavy crude oil final temperature(the temperature reached by the reaction mixture through heating)were selected.It is noteworthy that nanoparticles were assumed to be spherical.Table 5 shows the input parameters for analyzing the final results achieved through the simulation model.For the effect of nanocatalyst size,a relatively wide interval was selected to better investigate the effect of nanocatalyst size.Furthermore,the final value of the nanocatalyst mass fraction was set to 3%,as Maghzi et al.[44]reported that3wt%is the optimal SiO2concentration in enhanced oil recovery processes.The initial value of the final oil temperature was se tto 623 K,because in the experiments it was observed that the cracking reaction began at about 623 K.The final value was set to 773 K to ensure that cracking reactions were performed.
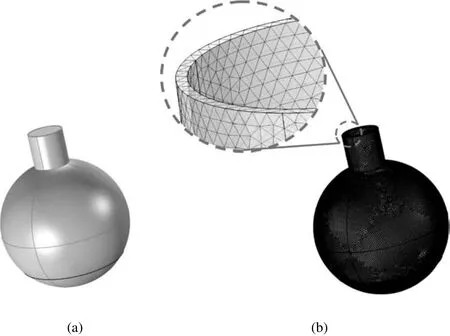
Fig.3.(a)Geometry of the batch reactor,and(b)the grid generated in this research.

Table 4 Results of the grid indecency check

Table 5 Box-Behnken parameters and related levels
5.Results and Discussion
5.1.Instrument uncertainties
To calculate the combined uncertainty,the average uncertainties induced by each instrument should be taken into account[45].In extra heavy crude oilupgrading experiments,the average uncertainties rising from heavy crude oil temperature measurements,oil volume,nanocatalyst amount,and oil viscosity measurements can be obtained as follows,respectively:
The uncertainties z,y,x,and w affect the combined uncertainty related to the entire measurements that can be calculated as:

where ucis combined standard uncertainty.By applying Eq.(35),the maximum standard uncertainty±1.12%can be obtained.(See Table 6.)
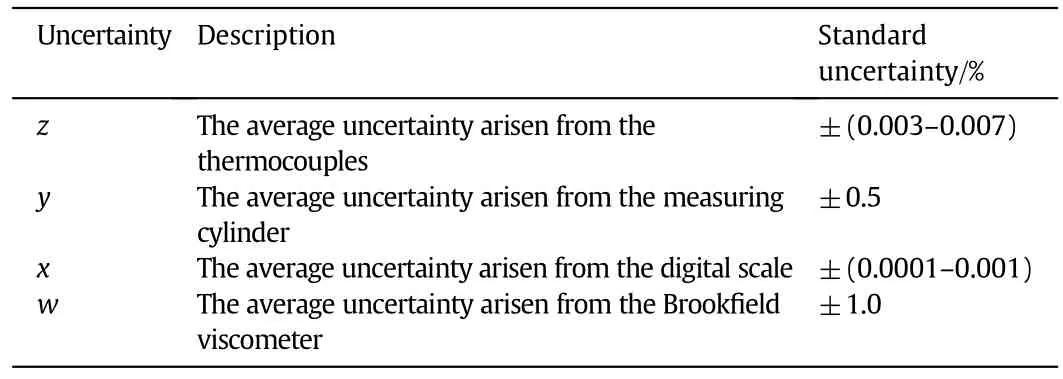
Table 6 Standard uncertainty related to the instruments
5.2.Model veri fication
To examine the validity of the simulated model,several tests were performed,and the reduction in viscosity of extra heavy crude oil under the effect of temperature in both the absence and the presence of the nanocatalyst was investigated.In the first section,the viscosity of the mixture was measured in the absence of the nanocatalyst at a given temperature without letting it cool.However,in the presence of nanocatalysts,the mixture was heated to 723 K and then cooled to room temperature.Finally,the viscosity of the mixture was measured atroom temperature.Table 7 indicates that there is an acceptable agreement between simulation results and experimental data.The findings revealed that the simulated model made better predictions in lower temperatures;however,the accuracy in higher temperatures is enough as it has a maximum error of 7.3%.The results demonstrated that temperature had a considerable effect on viscosity reduction of extra heavy crude oil,and increasing the temperature led to a decrease incrude oil viscosity.It is clear that increasing the temperature from315 to 343 K resulted in a 52.38%reduction in the sample oil viscosity;the reduction from 343 to 723 K,is about 99.5%,indicating that higher temperatures are more effective in reducing the viscosity of extra heavy crude oil.

Table 7 Comparison of numerical and experimental results in viscosity reduction of extra heavy crude oil under temperature
Table 8 depicts the experimental and numerical results obtained from upgrading extra heavy crude oil using NiO and SiO2nanocatalysts,and clearly a good agreement between them was achieved.From the table,it is evident that increasing the concentration of catalysts caused the relative error to decline.This may be related to the kinetic model.Regarding Table 8,itcan be seen that simulation results underestimated the experimental data,and there were maximum error rates of 9.16%and 7.73%between simulation results and experimental data for NiO and SiO2,respectively.On the other hand,this relative error became smaller when the concentrations of NiO and SiO2nanocatalysts wereincreased.By increasing the NiO nanocatalyst loading in the reactor,the viscosity of crude oil was reduced,and by improving the nanocatalyst mass fraction from 0.5wt%to 1.5wt%,a 75%reduction in the viscosity was observed.Moreover,it was obvious that increasing the SiO2nanocatalyst concentration had an inverse influence on the crude oil viscosity,whereas increasing the nanocatalyst concentration from 0.5wt%to 1.5wt%resulted in a 50%reduction in oil viscosity.This reduction was about 67%when the nanocatalyst concentration was increased from 1.5%to 3%.Adding the nanocatalyst to extra heavy oil in a thermal catalytic cracking affects upgrading considerably.

Table 8 Results of using NiO and SiO2 nanocatalyst for upgrading of extra heavy crude oil heated to 723 K and then cooled to the room temperature
5.3.Hydrodynamic,heat transfer,and kinetic reaction characteristics
Fig.4 shows the 2D velocity contour of the crude oil sample in the middle cross section from a transverse view in the TCC process using SiO2and NiO nanocatalysts with time.It is obvious that with the passage of time,the velocity of materials in the reactor increased.By applying the SiO2nanocatalyst,the magnitude of the wall velocity in the vicinity of the reactor was greater at 10 min because of the higher temperature of the reactor wall.At the beginning of the heating process,the regions adjacent to the reactor wall gained heat so that the density in these regions was reduced.Therefore,the density gradient led to a higher velocity magnitude due to the gravity force.With the passing of time,the central regions gained more heat,and the specified density gradient intensified the velocity in the central regions as well.According to the figure,the velocity magnitude in the central regions was higher at 15 and 20 min.The same procedure could be observed when the NiO nanocatalyst was applied for reducing the viscosity of extra heavy crude oil.
Fig.5 shows the 2D temperature contour of the crude oil sample in the middle cross section from the transverse view in the TCC process using the SiO2nanocatalyst with time.According to the figure,the temperature was highernear the wall as the reaction mixture was heated by an external source.The temperature gradient adjacent to the wall changed the crude oil density,and this led to the velocity gradient.The figure also clearly shows that with the passage of time,the hot mixture from the bottom of the reactor reaches the upper surfaces after 10 min because of the lower density,and this makes a circulation in the reactor.It is necessary to mention that a similar procedure was observed in the experiments.
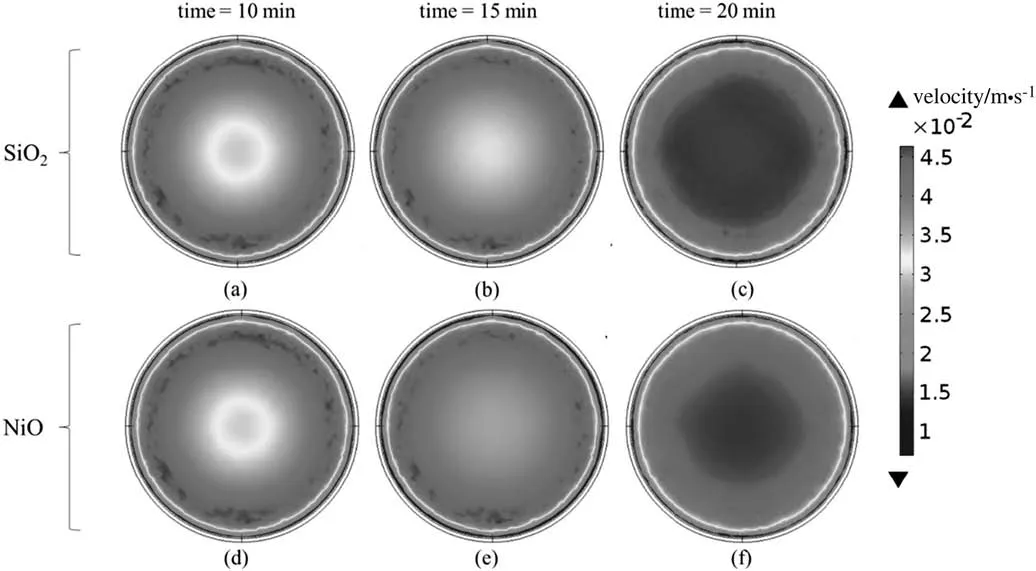
Fig.4.2D contour of crude oil velocity in the reactor under the thermal catalytic cracking process by use of SiO2 and NiO nanocatalysts in the middle cross section from transverse view.
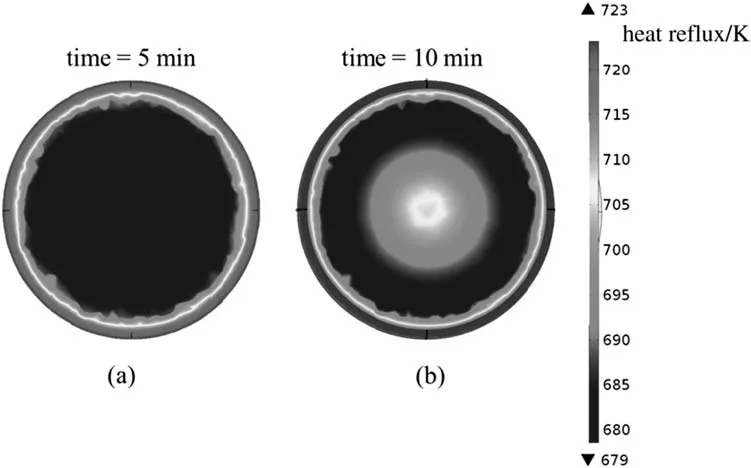
Fig.5.2D contour of total crude oil heat flux in the reactor under the thermal catalytic cracking process by use of SiO2 nanocatalyst in the middle cross section from transverse view.
Fig.6 depicts the 2Dmass fraction contour of material a(extra heavy crude oil sample)and materials b and c(upgraded oils)under the TCC process using the SiO2nanocatalyst in the middle cross section from the transverse view.From this figure,itis clear that in the central points of the reactor the mass fraction of material a was less.On the other hand,materials b and c had higher concentrations at the central regions,indicating that the cracking reaction took place more in the central regions than in the regions near the reactor wall.Also according to the figure,it is clear that the concentration of material b is higher than that of c,as it has lower API gravity.
Fig.7(a)and(b)represents the changes of species a,b,and c mass fraction during thermal catalytic cracking using the SiO2and NiO nanocatalysts with concentrations of 1.5wt%.The initial temperature of the crude oil sample was set to 623 K.Based on the experiments,it is believed that the cracking reaction began at 623 K.According to Fig.7(a),the reaction continued in time,leading to a reduction in the mass fraction of material a(extra heavy crude oil)until the changes faded out and the system became stable.At this time,the amount of material a reached 0.886,and the reaction is completed;this means that after 50 min,no cracking reaction occurred.Conversely,with the passage of time,the mass fraction of materials b and c as the products rose,and more material b,the product with lower API gravity,was produced.This is in logical agreement with the expectations.Also Fig.7(b)depicts the mass fraction profiles of materials a,b,and c during thermal catalytic cracking using the NiO nanocatalyst as a function of time.The mass fraction of material a decreased with time.In other words,the mass fractions of b and c as the lighter products increased.Compared to the SiO2nanocatalyst,the final mass fraction of products is less when the NiO nanocatalyst is applied.

Fig.6.2Dmass fraction contourof(a)material a,(b)material b and(c)material c in the reactor under the thermal catalytic cracking process by use ofSiO2 nanocatalyst in the middle cross section from transverse view after 15 min.
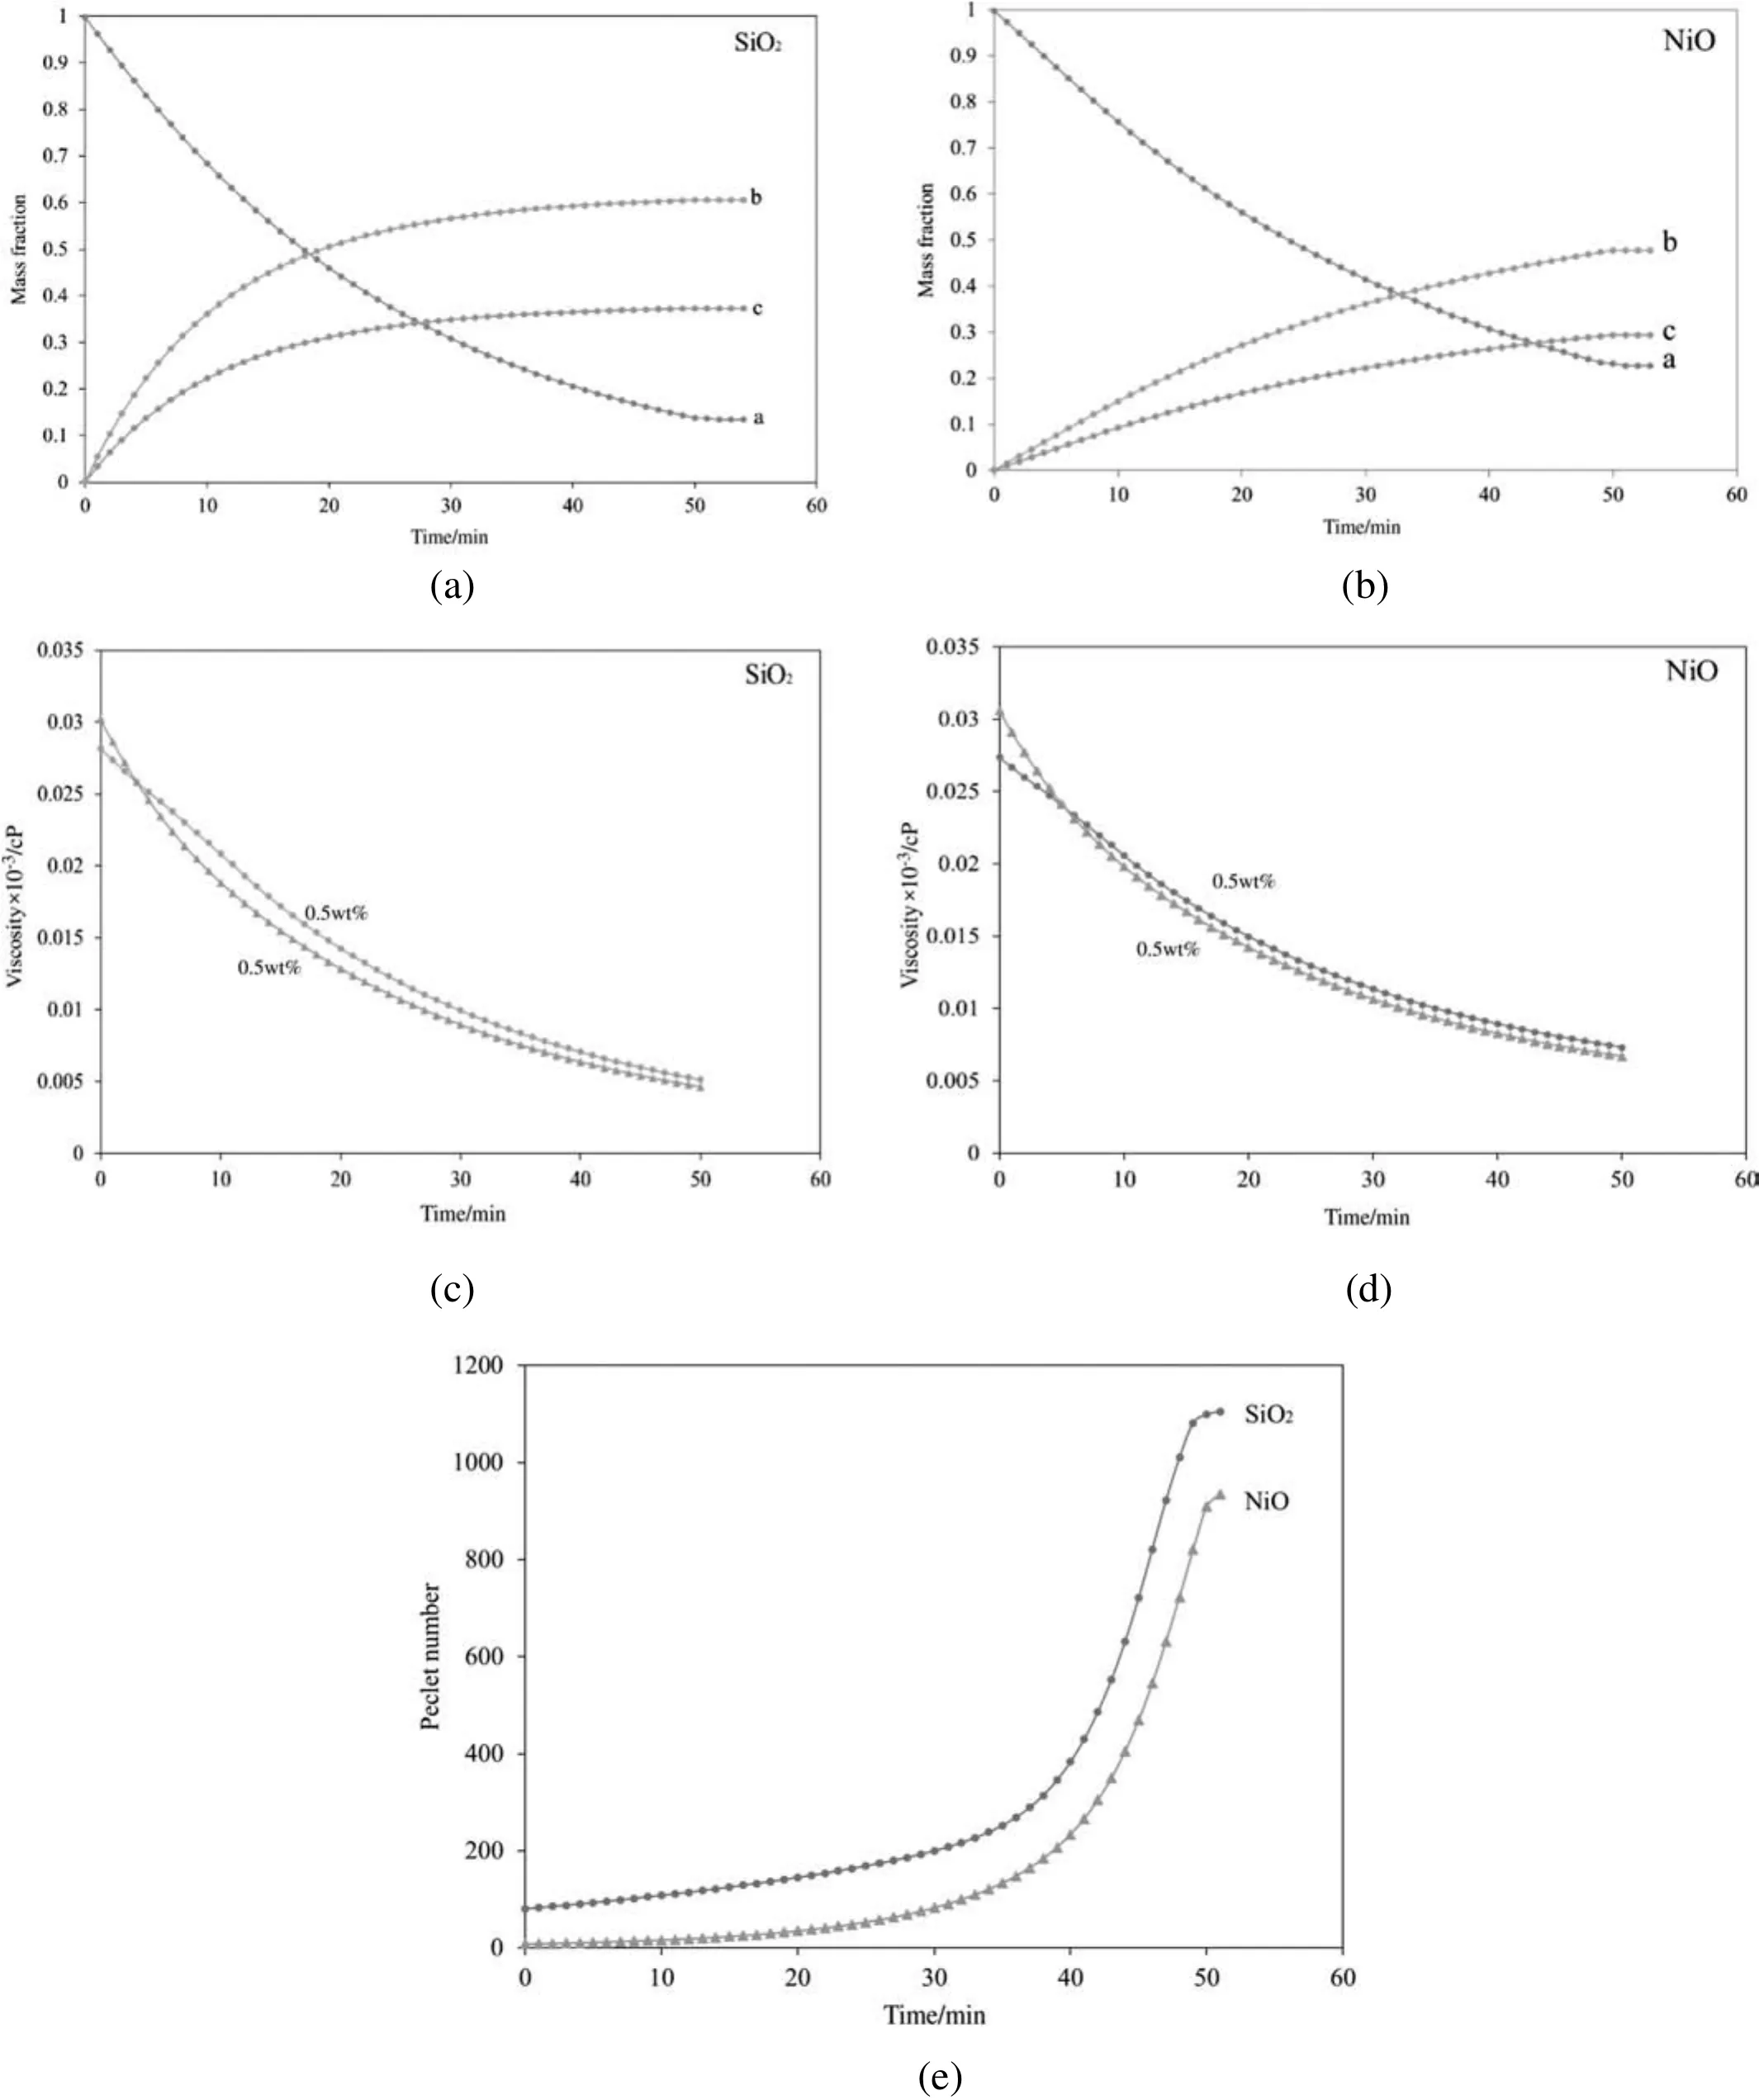
Fig.7.Changes of(a,b)mass fraction of materials a,b and c,(c,d)oil mixture viscosity and(e)Peclet number during thermal catalytic cracking using SiO2 and NiO nanocatalysts.
The changes in oil mixture viscosity during thermal catalytic cracking using SiO2and NiO nanocatalysts with 0.5%and 1.5%mass fraction are shown in Fig.7(c)and(d).The viscosity of the mixture was reduced as the temperature rose and the reaction continued with time.In this process,the wall temperature was higher than that of the oil mixture,facilitating the transfer of heat from the wall to the oil sample;thus,the cracking reaction performed with higher rates.In the beginning,the mixture with the larger amount of nanocatalyst had a bit higher viscosity.This is attributable to the fact that in the beginning,the yield of the reaction and the velocity of the mixture were both very low.It has been proven that adding nanoparticles to a base fluid increases the mixture's viscosity[46].In the beginning of the reaction,the catalytic behavior of the nanoparticles was insignificant as the cracking reaction had not started.Consequently,in the beginning,nanoparticles slightly exacerbated the viscosity of the extra heavy crude oil.However,with the passing of time,the cracking reaction continues,and the effects of nanocatalysts on the crude oil lead to a reduction in viscosity.Comparing Fig.7(c)and(d),it is concluded that SiO2nanoparticles are more effective and take part in the reaction sooner.
Fig.7(e)demonstrates the changes of the averaged Peclet number of oil mixture viscosity during the TCC process using SiO2and NiO nanocatalysts with a concentration of 1.5wt%.From the figure,it can be seen that the Pecletnumber of the oilmixture,the ratio ofconvective heat transfer to conductive heat transfer,increased with time.In the beginning,the amount of heat transferred in the convection regime was very low due to the high viscosity of the oil mixture.However,the amount of heat transferred by the convection regime increased with time,and it continued until stable conditions were achieved.Fig.7(e)also suggests that applying the SiO2nanocatalyst in reducing the viscosity of extra heavy crude oil represents a higher Peclet number than the NiO nanocatalyst,as it is claimed that SiO2nanocatalysts are more effective in this process.
5.4.Parametric analysis
To investigate the effects of in fluential parameters on upgrading extra heavy crude oil,the response surface method was used.The Box-Behnken design and the results related to viscosity(after completing the reaction)that were achieved numerically are presented in Table 9.Table 10 represents the ANOVA analysis of the applied model.The reduced cubic model was used to obtain statistical studies,and P-value<0.0001 implies that the model was significant(see Table 10).It is noteworthy that P-value<0.05 confirms the significance of the model[47,48].The high values of R2andindicate that the model is fitted well.The coefficient of variation(CV),which is the ratio of standarddeviation to the mean,represents the reproducibility of the model.If the CV of a model is less than 10%,the model is reproducible[49].In this study,the CV was equal to 2.64%,indicating it is a producible model.Also,a value of 116.003 for adequate precision,the ratio of signal to noise,corroborates the adequacy of the signal.It should be noted that values for adequate precision greater than 4 are desirable[50].In addition,Table 11 shows the analysis of variance for selected factors.Related P-values<0.05 indicate that the factors are significant.
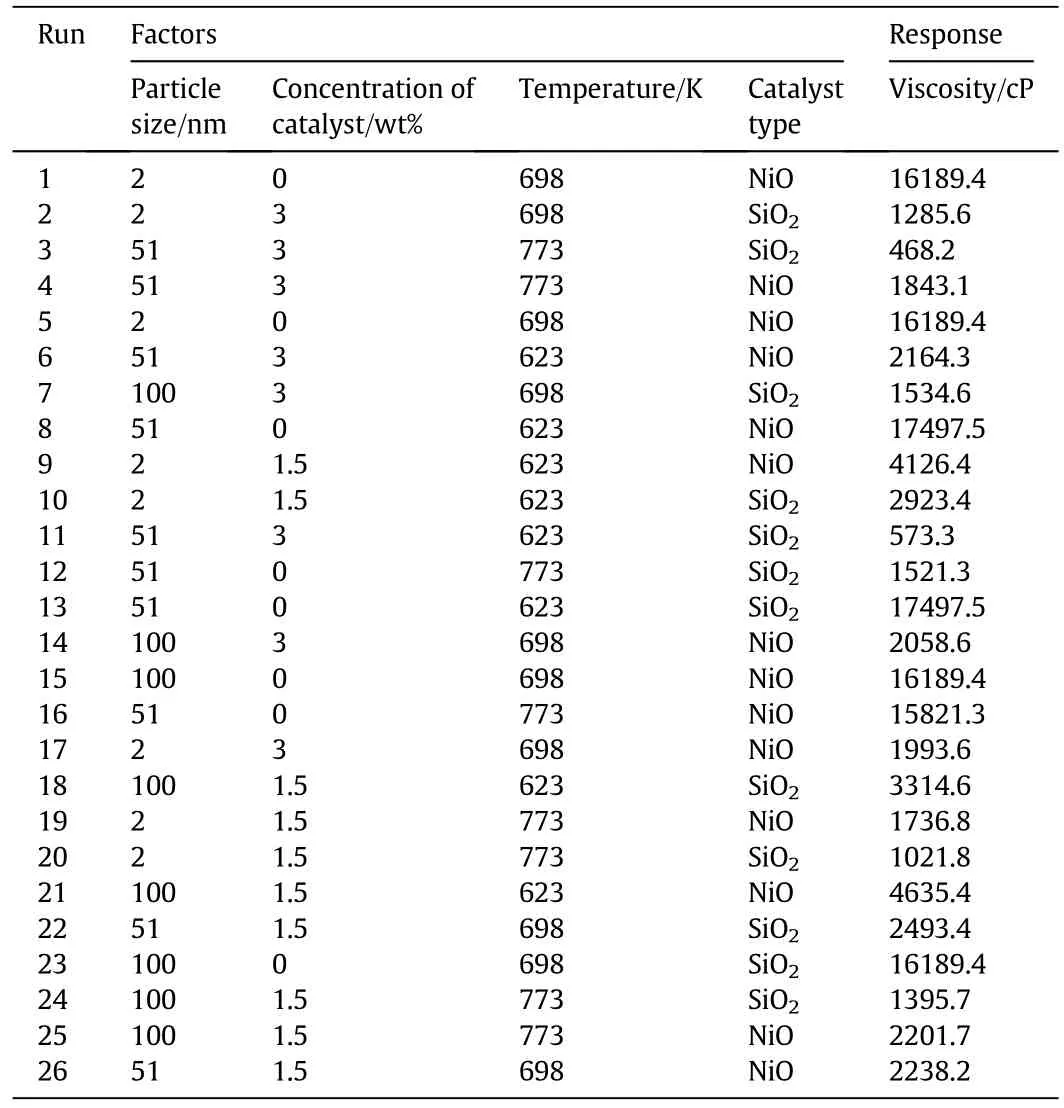
Table 9 Box-Behnken design and the crude oil viscosity results

Table 10 Analysis of variance

Table 11 The least square fit and parameters
By applying multiple regression analysis,a reduced cubic equation was used to fit the simulation results(mixture viscosity).Eqs.(36)to(38)represent the relation between crude oil viscosity and the four factors by adoption of the Box-Behnken design:
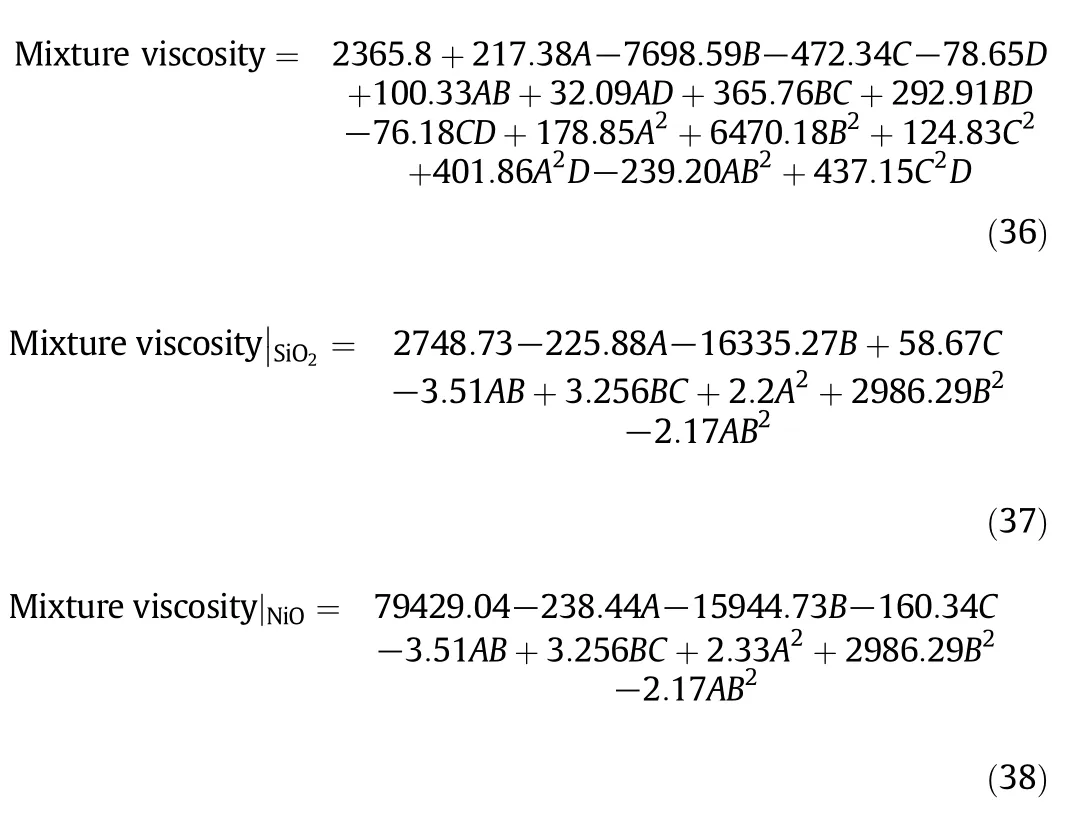
where A is particle size,B is concentration of catalyst(wt%),C is temperature and D refers to catalyst type.Conspicuously,models are reasonable approximations of the true functional relationship over relatively small regions of the independent variables'entire space[49].Fig.8 depicts the predicted values obtained by the statistical model versus actualdata achieved through the simulation model.The aggregation of points around the straight line confirms the robustness of the statistical model.
5.5.Effects of nanocatalyst concentration and particle size
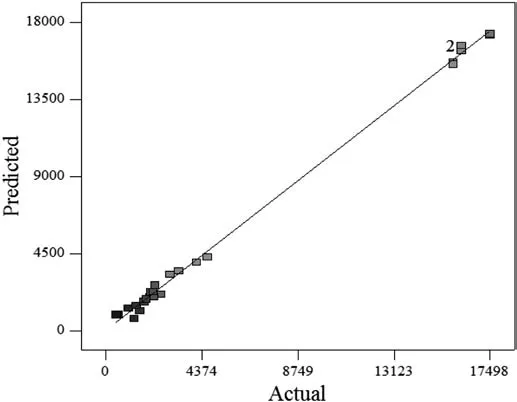
Fig.8.Predicted values versus actual results for crude oil viscosity.
Fig.9 shows the two-dimensional response surface of crude oil viscosity and the relationships between different factors at optimum values.Fig.9(a)and(b)illustrates the interaction of catalyst concentration and particle size at the specific temperature of 773 K using the SiO2and NiO nanocatalysts,respectively.It is obvious that at low catalyst concentrations,changing the particle size did not change the viscosity considerably.However,in higher ranges of catalyst concentration,the effect of particle size became important.At a catalyst concentration of 3%,increasing the particle size initially decreased crude oil viscosity,whereas further increases led to increases in crude oil viscosity.Materials on the nanometric scale have different properties compared to their bulk state because of their high specific surface area,and these lead to improvements in the chemical and physical enhancement.In fact,higher specific surface areas increased the particle and crude oil contact so that a better interaction between phases happens,and this leads to a reduction in viscosity.On the other hand,in higher nanocatalyst concentrations,a decrease in particle size augmented the tendency of particles to be agglomerate.Subsequently,crude oil viscosity increased.According to Fig.9(a)and(b),at a catalyst concentration of 2.3%with the SiO2nanocatalyst,the viscosity was reduced to about 410 cP(a 17.5%reduction)when the particle size was 51 nm.Under these conditions,the reduction is about 47.4%for the NiO nanocatalyst.Therefore,the effect of particle size is more signi ficant for the NiO nanocatalyst.From the figures,it is clear that at a constant particle size,increasing the nanocatalyst concentration reduces crude oil viscosity remarkably.For SiO2and NiO,maximum reductions of about 97.5%and 93%,respectively,were observed.Furthermore,at catalyst concentrations higher than about 2.3%,the crude oil viscosity begins to decrease due to the agglomeration of particles.
5.6.Effects of temperature and particle size
Fig.9(c)and(d)represents the interaction of temperature and particle size at a catalyst concentration of 3wt%using the SiO2and NiO nanocatalysts,respectively.An increase in temperature has a direct influence on the upgrading of extra heavy crude oil.At constant particle size,raising the temperature led to reductions in viscosity of about 59%and 38%for SiO2and NiO nanocatalysts,respectively.In upgrading extra heavy crude oil,the effect of temperature is substantial due to the presence of a chemical reaction.Regarding Eq.(38),temperature has a significant effect on energy and reaction kinetics,and by raising the temperature,the cracking reaction accelerates.Therefore,the amounts of products increase.In addition,at lower temperatures,decreasing particle size,enhancing the surface area per unit volume,reduces the viscosity of crude oil.However,at higher temperatures,the effect of agglomeration is more serious for smaller particles,and catalysts with a size of 20-30 nm represent better behaviors.
5.7.Effects of temperature and catalyst concentration
Fig.9(e)and(f)depicts the interaction of catalyst concentration and temperature at a particle size of 51 nm using the SiO2and NiO nanocatalysts,respectively.As discussed earlier,raising the temperature precipitated the cracking reaction and viscosity reduction.In all ranges of catalyst concentration,increasing the temperature led to a reduction in viscosity.However,adding the nanocatalyst may have different effects on crude oil viscosity.At a specified temperature,adding nanoparticles less than about 2.3wt%decreased viscosity considerably.At 773 K,adding 2.3%nanocatalyst to extra heavy crude oil reduced viscosity about 96.9%,whereas this reduction at 623 K was about 91%.Further amounts of the nanocatalyst increased oil viscosity as a result of agglomeration and aggregation.
5.8.Determination of optimum conditions
Optimization is a beneficial tool for determining a well-defined set of conditions that will meet all of the goals related to the process,which are combined into an overall desirability function[51].In statistical evaluations,the target is to optimize the desirability function.In this study,optimization was performed based on the minimization of crude oil viscosity.From an industrial point of view,it is desired to have energy costs at their least possible rate.Thus,temperature was targeted to be at623 K.The optimum conditions proposed by the statistical model were at particle size 24.93 nm and 2.28wt%with the SiO2nanocatalyst,and the minimum achieved viscosity was 465 cP,a 98.67%reduction.
The confirmation test was applied to verify the results obtained based on the Box-Behnken design[52].If a design does not meet the essential requirements,calculations must be revised until the criteria are met[53].In this study,a confirmation simulation was performed at the optimum levels of the given parameters.Results indicated a viscosity of 486.7 cP and a maximum relative error of 4.7%.The finding further revealed that the predicted data and simulation results are in good agreement.The investigations also showed that the SiO2nanocatalyst has a better effect than NiO on upgrading extra heavy crude oil.
6.Conclusions
In this study,the behavior of the process of upgrading extra heavy crude oil was presented using computational fluid dynamics.The illustrated model solved using the finite element method through taking appropriate governing equations into account through the application of COMSOL 4.4.A reaction scheme for the catalytic cracking of extra heavy crude oil was proposed,and an appropriate kinetic model was developed using experimental procedures as well as the equations reported in the literature.To examine the validity and accuracy of the simulation model,experiments for measuring the viscosity of crude oil were carried out.The findings revealed that there is an acceptable agreement between simulation results and experimental results.Also,investigations into hydrodynamics,heat transfer,and cracking reaction suggested that the proposed model could appropriately predict the process parameters.To investigate the main factors influencing the reduction in viscosity of extra heavy crude oil,statistical analysis was adopted.The results illustrated that type of nanocatalyst and nanocatalyst concentration are the most substantial parameters affecting the final results.In addition,a catalyst concentration of 2.3%was best for upgrading extra heavy crude oil,and a nanocatalyst size of about 51 nm was more efficient.The presented model and results obtained through sensitivity evaluations and experiments provide bene ficial information for the design and development of high performance upgrading processes.

Fig.9.Contour plots of the interactive effects for:concentration of catalyst and particle size at constant temperature 773 K using(a)SiO2 and(b)NiO nanocatalysts,temperature and particle size at constant catalyst concentration 3%using(c)SiO2 and(d)NiO nanocatalysts,temperature and Concentration of catalyst at constant particle size 51 nm using(e)SiO2 and(f)NiO nanocatalysts.
[1]Oil Market Report,International Energy Agency,2010.
[2]H.Alboudwarej,J.Felix,S.Taylor,R.Badry,C.Bremner,B.Brough,C.Skeates,A.Baker,D.Palmer,K.Pattison,Highlighting heavy oil,Oil field Rev.18(2)(2006)34-53.
[3]S.Sadrameli,Thermal/catalytic cracking of hydrocarbons for the production of olefins:A state-of-the-artreview I:Thermal cracking review,Fuel 140(2015)102-115.
[4]R.Ren,H.Liu,Y.Chen,J.Li,Y.Chen,Improving the Aqua the rmolys is Efficiency of Aromatics in Extra-Heavy Oil by Introducing Hydrogen-Donating Ligands to Catalysts,Energy Fuel 29(12)(2015)7793-7799.
[5]X.Meng,C.Xu,J.Gao,L.Li,Studies on catalytic pyrolysis of heavy oils:Reaction behaviors and mechanistic pathways,Appl.Catal.A Gen.294(2)(2005)168-176.
[6]J.-H.Lin,V.V.Guliants,Alumina-supported Cu-Ni and Ni-Cu core-shell nanoparticles:Synthesis,characterization,and catalytic activity in water-gas-shift reaction,Appl.Catal.A Gen.445(2012)187-194.
[7]K.Li,B.Hou,L.Wang,Y.Cui,Application of carbon nanocatalysts in upgrading heavy crude oil assisted with microwave heating,Nano Lett.14(6)(2014)3002-3008.
[8]E.E.Johnsen,H.P.Rønningsen,Viscosity of‘live’water-in-crude-oilemulsions:experimental work and validation of correlations,J.Pet.Sci.Eng.38(1)(2003)23-36.
[9]J.Sjöblom,N.Aske,I.H.Au flem,Ø.Brandal,T.E.Havre,Ø.Sæther,A.Westvik,E.E.Johnsen,H.Kallevik,Our current understanding of water-in-crude oil emulsions.:Recent characterization techniques and high pressure performance,Adv.Colloid Interf.Sci.100(2003)399-473.
[10]P.M.Rahimi,T.Gentzis,The chemistry of bitumen and heavy oil processing,Practical Advances in Petroleum Processing,Springer 2006,pp.597-634.
[11]S.V.Nayak,S.L.Joshi,V.V.Ranade,Modeling of vaporization and cracking of liquid oil injected in a gas-solid riser,Chem.Eng.Sci.60(22)(2005)6049-6066.
[12]J.Chang,F.Meng,L.Wang,K.Zhang,H.Chen,Y.Yang,CFD investigation of hydrodynamics,heat transfer and cracking reaction in a heavy oil riser with bottom airlift loop mixer,Chem.Eng.Sci.78(2012)128-143.
[13]Y.Behjat,S.Shahhosseini,M.A.Marvast,CFD analysis of hydrodynamic,heattransfer and reaction ofthree phase riser reactor,Chem.Eng.Res.Des.89(7)(2011)978-989.
[14]S.A.Sabet,Effects of microwaves radiation and nanocatalysts ion viscosity reduction of extra heavy crude oil,Department of chemical engineering,Tarbiat Modares University,2015.
[15]Y.H.Shokrlu,T.Babadagli,Viscosity reduction of heavy oil/bitumen using micro-and nano-metal particles during aqueous and non-aqueous thermal applications,J.Pet.Sci.Eng.119(2014)210-220.
[16]B.Gong,Methodology for technology evaluation under uncertainty and its application in advanced coal gasification processes,Massachusetts Institute of Technology,2011.
[17]H.C.Frey,E.S.Rubin,Evaluation of advanced coal gasification combined-cycle systems under uncertainty,Ind.Eng.Chem.Res.31(5)(1992)1299-1307.
[18]I.Pan,D.S.Pandey,Incorporating uncertainty in data driven regression models of fluidized bed gasification:A Bayesian approach,Fuel Process.Technol.142(2016)305-314.
[19]A.Krasławski,Review of applications of various types of uncertainty in chemical engineering,Chem.Eng.Process.Process Intensif.26(3)(1989)185-191.
[20]J.P.Holman,W.J.Gajda,Experimental methods for engineers,7,McGraw-Hill,New York,2001.
[21]R.Gharibshahi,A.Jafari,A.Haghtalab,M.S.Karambeigi,Application of CFD to evaluate the pore morphology effect on nano fluid flooding for enhanced oil recovery,RSC Adv.5(37)(2015)28938-28949.
[22]A.Jafari,T.Tynjälä,S.M.Mousavi,P.Sarkomaa,CFD simulation and evaluation of controllable parameters effect on thermomagnetic convection in ferro fluids using Taguchi technique,Comput.Fluids 37(10)(2008)1344-1353.
[23]A.Shahmohammadi,A.Jafari,Application of different CFD multiphase models to investigate effects of baffles and nanoparticles on heat transfer enhancement,Front.Chem.Sci.Eng.8(3)(2014)320-329.
[24]A.Jafari,P.Zamankhan,S.M.Mousavi,K.Pietarinen,Modeling and CFD simulation of flow behavior and dispersivity through randomly packed bed reactors,Chem.Eng.J.144(3)(2008)476-482.
[25]J.Buongiorno,Convective transport in nano fluids,J.Heat Transf.128(3)(2006)240-250.
[26]M.Z.Saghir,A.Ahadi,T.Youse fi,B.Farahbakhsh,Two-phase and single phase models of flow of nano fluid in a square cavity:Comparison with experimental results,Int.J.Therm.Sci.100(2016)372-380.
[27]A.Ochieng,M.S.Onyango,Drag models,solids concentration and velocity distribution in a stirred tank,Powder Technol.181(1)(2008)1-8.
[28]H.Azargoshasb,S.M.Mousavi,T.Amani,A.Jafari,M.Nosrati,Three-phase CFD simulation coupled with population balance equations of anaerobic syntrophic acidogenesis and methanogenesis reactions in a continuous stirred bioreactor,J.Ind.Eng.Chem.27(2015)207-217.
[29]D.C.Wilcox,Turbulence modeling for CFD,2,DCW industries La Canada,CA,1998.
[30]A.Brandenburg,P.J.Käpylä,A.Mohammed,Non-Fickian diffusion and tau approximation from numerical turbulence,Phys.Fluids(1994-present)16(4)(2004)1020-1027.
[31]L.Rebreanu,J.-P.Vanderborght,L.Chou,The diffusion coefficient of dissolved silica revisited,Mar.Chem.112(3)(2008)230-233.
[32]I.M.Head,D.M.Jones,S.R.Larter,Biological activity in the deep subsurface and the origin of heavy oil,Nature 426(6964)(2003)344-352.
[33]N.Rahimi,R.Karimzadeh,Catalytic cracking of hydrocarbons over modi fied ZSM-5 zeolites to produce light ole fins:A review,Appl.Catal.A Gen.398(1)(2011)1-17.
[34]R.Sahu,B.J.Song,J.S.Im,Y.-P.Jeon,C.W.Lee,A review of recentadvances in catalytic hydrocracking of heavy residues,J.Ind.Eng.Chem.27(2015)12-24.
[35]T.Ahmed,Reservoir Engineering Handbook,3,Gulf Professional Publishing,2006.
[36]O.Alomair,A.Elsharkawy,H.Alkandari,A viscosity prediction model for Kuwaiti heavy crude oils at elevated temperatures,J.Pet.Sci.Eng.120(2014)102-110.
[37]A.P.Szilas,Production and Transport of Oil and Gas:Gathering and transportation,Elsevier,1985.
[38]G.Petrosky Jr.,F.Farshad,Viscosity correlations for Gulf of Mexico crude oils,SPE Production Operations Symposium,Society of Petroleum Engineers,1995.
[39]R.E.Maples,Petroleum re finery process economics,Pennwell books,2000.
[40]L.S.Lee,Y.W.Chen,T.N.Huang,W.Y.Pan,Four-lump kinetic model for fluid catalytic cracking process,Can.J.Chem.Eng.67(4)(1989)615-619.
[41]Y.Hamedi Shokrlu,T.Babadagli,In-situ upgrading of heavy oil/bitumen during steam injection by use of metal nanoparticles:A study on in-situ catalysis and catalyst transportation,SPE Reserv.Eval.Eng.16(03)(2013)333-344.
[42]J.V.Mehrabani,M.Noaparast,S.M.Mousavi,R.Dehghan,A.Ghorbani,Process optimization and modelling of sphalerite flotation from a low-grade Zn-Pb ore using response surface methodology,Sep.Purif.Technol.72(3)(2010)242-249.
[43]S.L.C.Ferreira,R.E.Bruns,H.S.Ferreira,G.D.Matos,J.M.David,G.C.Brandão,E.G.P.da Silva,L.A.Portugal,P.S.dos Reis,A.S.Souza,W.N.L.dos Santos,Box-Behnken design:An alternative for the optimization of analytical methods,Anal.Chim.Acta 597(2)(2007)179-186.
[44]A.Maghzi,S.Mohammadi,M.H.Ghazanfari,R.Kharrat,M.Masihi,Monitoring wettability alteration by silica nanoparticles during water flooding to heavy oils in fivespot systems:A pore-level investigation,Exp.Thermal Fluid Sci.40(2012)168-176.
[45]M.Dogru,A.Midilli,C.R.Howarth,gasification of sewage sludge using a throated downdraft gasi fier and uncertainty analysis,Fuel Process.Technol.75(1)(2002)55-82.
[46]V.Y.Rudyak,S.L.Krasnolutskii,Dependence of the viscosity of nano fluids on nanoparticle size and material,Phys.Lett.A 378(26-27)(2014)1845-1849.
[47]J.Aminian Dehkordi,S.S.Hosseini,P.K.Kundu,N.R.Tan,Mathematical modeling of natural gas separation using hollow fiber membrane modules by application of finite element method through statistical analysis,Chem.Prod.Process.Model.11(1)(2016)11-15.
[48]S.S.Hosseini,J.Aminian Dehkordi,P.K.Kundu,Gas permeation and separation in asymmetric hollow fiber membrane permeators:Mathematical modeling,sensitivity analysis and optimization,Korean J.Chem.Eng.33(11)(2016)3085-3101.
[49]S.O.Rastegar,S.M.Mousavi,S.A.Shojaosadati,Bioleaching of an oil- fired residual:process optimization and nanostructure NaV 6 O 15 synthesis from the bioleachate,RSC Adv.5(51)(2015)41088-41097.
[50]S.Rastegar,S.Mousavi,M.Rezaei,S.Shojaosadati,Statistical evaluation and optimization of effective parameters in bioleaching of metals from molybdenite concentrate using Acidianus brierleyi,J.Ind.Eng.Chem.20(5)(2014)3096-3101.
[51]M.Ijadi Bajestani,S.M.Mousavi,S.A.Shojaosadati,Bioleaching of heavy metals from spent household batteries using Acidithiobacillus ferrooxidans:Statistical evaluation and optimization,Sep.Purif.Technol.132(2014)309-316.
[52]R.Ma fiGholami,S.M.Mousavi,S.M.Borghei,Process optimization and modeling of heavy metals extraction from a molybdenum rich spent catalyst by aspergillus niger using response surface methodology,J.Ind.Eng.Chem.18(1)(2012)218-224.
[53]S.M.Mousavi,S.Yaghmaei,A.Jafari,M.Vossoughi,Z.Ghobadi,Optimization of ferrous biooxidation rate in a packed bed bioreactor using Taguchi approach,Chem.Eng.Process.Process Intensif.46(10)(2007)935-940.
 Chinese Journal of Chemical Engineering2018年2期
- Chinese Journal of Chemical Engineering的其它文章
- Surface chemical characterization of deactivated low-level mercury catalysts for acetylene hydrochlorination☆
- Insight into fouling behavior of poly(vinylidene fluoride)(PVDF)hollow fiber membranes caused by dextran with different pore
- Protein adsorption onto diethylaminoethyl dextran modi fied anion exchanger:Effect of ionic strength and column behavior☆
- Gas emission source term estimation with 1-step nonlinear partial swarm optimization-Tikhonov regularization hybrid method☆
- Dissolution of antibiotics mycelium in ionic liquids:Performance and mechanism☆
- Effect of the operation parameters on the Fischer-Tropsch synthesis in fluidized bed reactors☆
