
Transport hindrances with electrodialytic recovery of citric acid from solution of strong electrolytes
2018-05-25 19:07AnushaChandraJogiGaneshDattatreyaTadimetiSujayChattopadhyay
Anusha Chandra ,Jogi Ganesh Dattatreya Tadimeti,Sujay Chattopadhyay ,*
1 Department of Polymer and Process Engineering,IIT Roorkee Saharanpur Campus,Saharanpur 247001,India
2 Department of Mechanical Engineering,Swarnandhra College of Engineering and Technology,Seetarampuram 534280,India
1.Introduction
Citric acid,CA(C6H8O7;2-hydroxy propane-1,2,3-tricarboxylic acid,molar mass:192.12 Da)is highly water soluble organic acid with strong antioxidant,chelating and buffering activities.These properties encourage 70%of its application as preservatives for food,beverage and pharmaceuticals[1-3].This is one of the most produced(1.4 million tons per annum)organic acids through fermentation route[1].Current demand in the world is projected over 5× 10⁸kg·a-1,which is expected to rise further.Major part of its production cost arises due to series of downstream processing(e.g.lime precipitation,solvent extraction, filtration,crystallization,distillation)used to recover CA from fer mentor[1,2,4].These multiple steps make the recovery process energy intensive,besides generation of large amount of solid/liquid wastes[4].
Membrane based separation involving micro filtration/ultra filtration followed by electrodialysis(ED)appeared to be quite promising for recovery of citric acid.Substantial reduction of downstream processing steps and high selectivity of ED membranes could drastically reduce production cost,besides minimizing waste generation[1,5].ED recovery of CA from its salt solutions were reported by different authors[6-9].Major focus was on understanding role of process parameters those influenced CA recovery from solution at higher pH.
ED recovery of CA was mostly reported at higher pH(~7.5)but a review by Papagianni[10]indicates that improved yield,reduced contamination and minimum byproduct(s)formation is achievable once fermenter is maintained at low pH(~2.0)using a new microbial strain.The yield dropped to 80%with pH rise from 2.0 to 4.5.This hints at possibility of future CA production being carried out at low pH followed by simultaneous recovery of CA from acidic broth.ED process at low pH will eliminate lime cycle/environmental issues and minimize downstream processing costs,which needs to be understood.No literature addresses CA recovery at low pH,possibly due to weak dissociation and poor conductivity ofCA which makes ED recovery quite challenging.Additionally,presence of strong electrolytes commonly found in broth(due to feed stock and micronutrients addition for microorganism growth)has not been investigated during ED recovery at low pH.
Zhang et al.[11]reported removal of inorganic anions is a feasible option over organic anions from a mixture of organic acids and salts.They also reported that selectivity of transporting species is a strong function of size,charge and functional groups.Adsorption of organic molecules over membrane during ED can alter membrane properties and separation efficiency but detailed understanding of these solute-membrane interactions have not been explored atlow pH.Therefore,we have tried to analyze fundamental facts/phenomena associated with solute-membrane interaction that caused transport hindrance to CA during ED recovery at low pH.
Various process parameters(potential, flow velocity,temperature,feed concentration and nature of electrolytes)in fluencing CA transport during ED were explored.Physicochemical changes(adsorption equilibrium,resistance variation and surface properties/topology)occurring with ion exchange membranes due to CA molecules under low pH were also investigated thoroughly.
2.Experimental Materials and Methods
2.1.Ion exchange membranes
Ion exchange membranes used in this study were of commercial grade heterogeneous cation exchange membranes(CEMs-sulfonated styrene divinyl benzene cross-linked copolymer)and anion exchange membrane(AEM-aminated styrene divinyl benzene cross-linked copolymer)obtained from Permionics India Ltd.,India.Membranes were used after repeated(three times)washing with 0.1 mol·L-1HCl and 0.1 mol·L-1NaOH alternatively and finally with distilled water.Repeated washing steps ensured removal of residual acid/alkali traces entered during synthesis.Detailed information about various physical and chemical properties of the membranes are listed in Table 1[12].
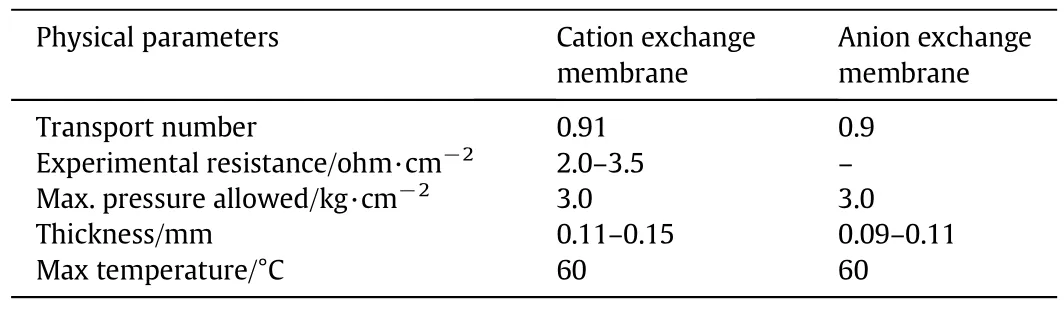
Table 1 Membrane Parameters as obtained from Permionics India Ltd.[12]
2.2.Electrodialysis setup
The experimental setup and stack arrangement used for ED application were shown in Fig.1[12]and Fig.2.The ED cellassembly was tailor made in the laboratory with an effective membrane area of 32 cm2and inert graphite electrodes were used to apply electric potential.The ED setup was operated in batch mode,where the feed solution was continuously recirculated.1000 ml solutions of each stream e.g.concentrate,feed and electrode rinsing solution(ERS)were taken in three glass vessels(Fig.1)and temperature of each solution was thermostatically controlled.Centrifugal pump with appropriate bypass arrangement for precise flow control was used for circulating each stream through the ED cell.Control valve(s)and rota meter(s)were fitted with each stream for precise flow rate.Each stream was prepared from deionized water(conductivity <10.0 μS).Series of operating parameters varied were listed in Table 2.For EDrecovery of CAatlow pH,pH~2 corresponds to unadjusted 0.1 mol·L-1CAsolution while pH for other feed concentrations were adjusted by adding 0.1 mol·L-1HCl/0.1 mol·L-1NaOH.
The ED stack was periodically cleaned by recirculating 0.05 mol·L-1HCl,followed by water wash and 0.05 mol·L-1NaOH solution after each set of experiment to ensure no fouling over the membrane.The whole stack was subsequently rinsed thoroughly with de-ionized water before it was put to further use.
2.2.1.Power supply
All experiments were performed under a fixed applied potential across the ED stack where,current was continuously monitored with time with the help of a built-in digital ammeter.Power supply was provided through a voltage stabilizer110/220 VACwith 50-80 Hz frequency.A stabilized output of 0-50 V DC was obtained from the source while the in line ammeter could measure currents in the range 0-2000 mA.
2.3.HPLC analysis of citric acid concentration
Citric acid solutions were prepared from analytical grade citric acid(Himedia,India)and deionized water.CA concentrations were always estimated through HPLC(High Performance Liquid Chromatography,Shimadzu)containing 5 μm,4.6 mm × 250 mm Inertsil ODS-4 column,DGU-20A5R degasser,SIL-20AHT auto sampler and SPD-M20A diode array detector(λ=214 nm).Methanol and aqueous solution of 0.1%H3PO4in 2:98(volume)were used as eluent and flow rate was maintained at 1 ml/min.HPLC was calibrated by injecting five known concentrations of citric acid solutions spanning the full range of concentrations required.Column and detector were maintained at 30°C.
2.4.pH measurement
Solution pH was measured using LI 614 pH(Elico India)analyzer with an accuracy of±1%and appropriate temperature correction facility to negate temperature effect.
2.5.Recovery of citric acid
Recovery(R)ofcitric acid fromfeed chamber can be calculated using Eq.(1)
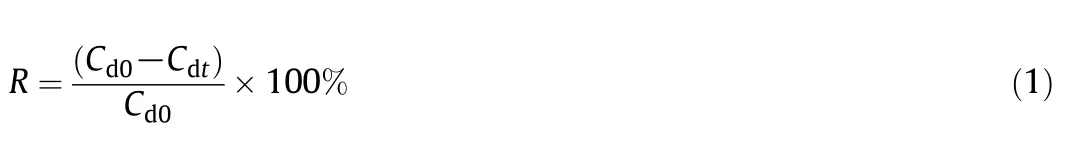
where,cdtand cd0—concentration of citric acid in feed chamber at time t and 0.
2.6.Current efficiency
Current efficiency indicates the extent of applied potential that could effectively transport ions.Ion transport(migration)is caused by the passage of electrical charges,expressed in Faraday.The amount of ions transferred was evaluated by measuring changes in the concentration of citrate ions(CAions)in the concentrate chamber[4].Current efficiency(η)is defined as

where,

Δn(=nct-nc0)is difference in the number of moles of citric acid in concentrate chamber attimet and at t=0 and QFis the amount of the electrical charges carried by the current.
By rearranging Eqs.(2)and(3),

where,Cct,Cc0—concentration of citric acid in concentrate chamber at time t and 0.
Vct,Vc0—volume in concentrate chamber at time t and 0,F—Faraday constant,N—number of cell pairs,I—current and t—time.
Current efficiency less than 100%implies losses of applied potential in various unwanted physical process running parallel in ED setup,therefore,potential was not fully utilized to transport[13].Common physicochemical processes e.g.water splitting,co-ion leakage,competitive ion(OH-)transport,membrane fouling,poor membrane selectivity,electro-osmosis,etc.[13-18]utilize a portion of applied potential and reduced the efficiency.Batch mode ED was carried out for 270 min and samples were collected at regular interval.Current efficiency(η)was estimated using Eq.(4)[4,15].

Fig.1.Batch recirculation electrodialysis process showing storage tanks,pumps,manual control valves,various chambers of the ED cell,electrodes,DC supply source,Voltmeter,ammeter and flow meters used in the experiment[12].
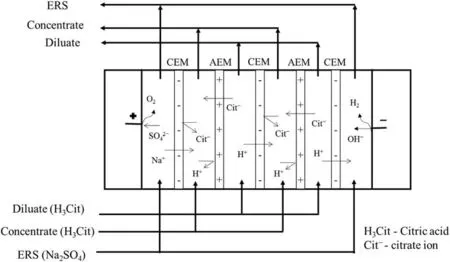
Fig.2.Cell arrangement during ED.
2.7.Energy consumption
Energy consumption per unit mass of citric acid was determined using Eq.(5),by considering applied voltage,the amount of acid transferred to concentration chamber and current change as function of time.In Potentiostatic mode the current values changed with time,therefore,total charge transferred(in coulombs)was estimated by integratingusing trapezoidal rule.
Energy consumption(E,kW·h·kg-1)can be calculated using Eq.(5)[9,12]

where,ε=applied potential across stack(V),I=current(A),M=molar mass of CA,Cct=concentration of citric acid in concentrate chamber at time t and V(or Vc0)=volume of CA.

Table 2Operating parameters chosen for electrodialysis experiments
2.8.Chronopotentiometry
Chronopotentiometry is an electrochemical technique which monitors variation in membrane potential,under a constant current density against time.It measures kinetics of transport processes,electro-catalysis in ion exchange membrane(IEM),ionic mobility/transport number,diffusion coefficient,membrane resistance,and concentration polarization[19-21].Voltage variation with time was noted from two-compartment cell(Fig.3)[22].The cell consisted of two equal volume(100 cm3)chambers(made of Plexiglas)and separated by AEM with an exposed area of 2.25 cm2.Potential difference across AEM was recorded through reference electrodes(Ag/AgCl)immersed in Luggin capillaries fitted close to membrane surfaces on either side.Chronopotentiometric measurement was carried out using potentiostat(Autolab PGSTAT 101)connected to ATMA-MMO Titanium electrodes purchased from Titanium Tantalum Products Ltd.India.
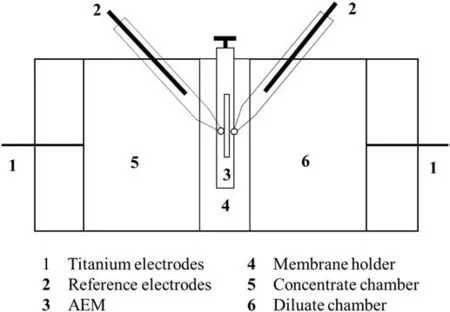
Fig.3.Cell for chronopotentiometry study.
2.9.Contact angle
Interactions of solute(CA)with membrane often in fluence ED separation possibly because of variation in surface hydrophilicity/hydrophobicity.Contact angle(θ)analysis helps us to know surface energies,hydrophobic/hydrophilic nature and wettability of a surface.Phoenix 300 SEO(Surface Electro Optics),a specially designed optical device fitted with a high speed charge-coupled device(CCD)camera.Sample stage was precisely adjusted as per necessity to obtain accurate sample position during measurement.Surface energy was estimated from surface tension,contact angle and standard correlations available in Surfaceware-7 software.
2.10.Adsorption isotherm estimation
Severalpieces of2.5 cm×2.5 cmsize of AEM were cut and each were separately equilibrated in 100 ml deionized water for 24 h to ensure removal of residual solvents.Each of this washed membrane was separately immersed in 100 ml citric acid solution of different concentrations(0.05,0.1,0.15 and 0.2 mol·L-1)and equilibrated for 24 h.Each sample was made in triplicate to obtain good estimate.Membranes were gently washed with deionized water to remove adhering solution and dried using tissue before those were separately placed 1 mol·L-1NaCl for 24 h.Adsorbed organic anions are expected to get exchanged with Cl-ions.Amount of desorbed anions from AEM were estimated from NaCl in HPLC.
2.11.AFM analysis
Atomic force microscope(AFM)is a state of the art analytical facility used to find topographical images of surface atnanoscale.Besides this,it is capable of assessing force components e.g.electrostatic,Van der Waal's,and magnetic.Force measurements were performed to find variation in surface properties due to adherence of solute.In this measurement,the tip attached to cantilever spring approaches the surface in normal direction and force curves(force vs.distance)were recorded from the tip deflection[23].Force was calculated by multiplying the cantilever deflection and spring constant.ScanAsyst mode of NanoScope analysis(version 1.4)and Dimension Icon AFM,Bruker,USA was used for force measurements.This is based on peak force tapping technique for analysis of force curve at every pixel of the image[24].Silicon nitride tip was used for these measurements and spring constant was estimated to be 0.4798 N·m-1.Force measurements were performed with each membrane sample equilibrated with CA solutions of four different concentrations(0.05 mol·L-1,0.1 mol·L-1,0.15 mol·L-1and 0.2 mol·L-1).
2.12.X-ray diffraction(XRD)
During ED of feed having electrolytes,various metal ions(Ca2+,Fe3+)were found to get adsorbed on the ion exchange sites of the electro membranes which drastically affect the transport process.XRD is a popular technique that can confirm presence of crystal/amorphous structure in the membrane.XRD analysis of membranes was done in Rigaku Ultima IV model with Cu(λ=0.15 nm)anode at scanning speed of4(°)·min-1was carried out to find traces of metals in the sample.The scan range was kept fixed between 5°-70°(2θ).
2.13.Energy dispersive X-ray spectroscopy(EDX or EDAX)
Energy dispersive X-ray spectroscopy(EDX)is an analytical technique used for elemental composition analysis of a sample.During ED recovery of CA in presence of strong electrolytes,adsorption of metals(Ca,Fe)on CEM can affect transport process.EDX analysis was used to show the existence of metal ions over CEM.Analysis was carried out using EDX(AMETEK EDAX)coupled with field emission scanning electron microscopy(FESEM,MIRA3 TESCAN)at a voltage of 12 kV and at magnifications of 132× and144×.
2.14.Determination of dissociation constants
The dissociation constants of citric acid at 25°C are[25]

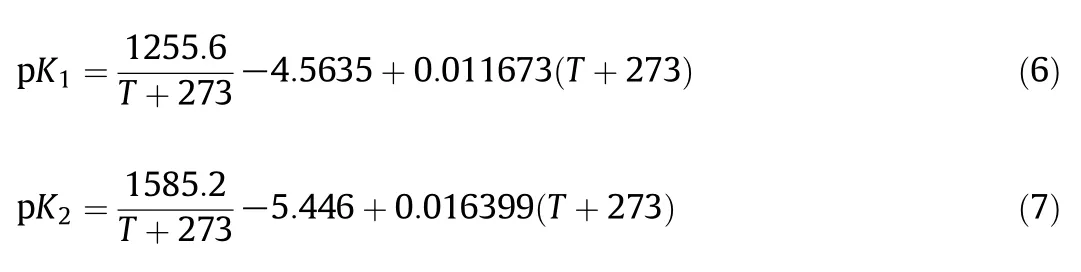
Citric acid dissociation constants with different temperature can be estimated from following correlations[25]

Ionic fraction of dissociated CA ions(citrate ions)can be calculated from Henderson-Hasselbalch equation

where[HA],[A-]represent concentrations of CA molecule and dissociated anion.
Here,in this work,CA at pH=2 is used.At this pH(pH<p K1),CA exists in mono-charged ionic form.Therefore,p K1is used to calculate ionic fractions of dissociated mono-charged citrate ions.
3.Results and Discussions
3.1.Effect of potential on recovery of CA
Both feed and concentrate streams(0.1 mol·L-1CA)were recirculated at 15.0 LPH through a batch ED setup in Potentiostatic modes,with potential e.g.10,15,17.5 and 20 V.Initially,current density dropped during first 30 min[Fig.4(a)]while it gradually increased during the remaining part of the experiment.Initial drop in current density is attributed to the development of diffusion boundary layer along the solution-IEM interface due to constant depletion of dissociated species in bulk as well as interface.A subsequent rise in current density during later stages could be due to onset of processes like water splitting and electro convection[26].In addition to transport of H+/OH-ions(water splitting),electro-convection destabilize diffusion boundary layer and provides additional salt ions to the membrane surface.This enhanced ion transport through membrane and resulted in subsequent current density rise.
It's interesting to note that the magnitude of initial drop in current density during initial 30 min got lowered with higher potential i.e.10.0 A·m-2(10 V)> 8.0 A·m-2(15 V)> 6.0 A·m-2(17.5 V)>1.0 A·m-2(20 V).This lowering in the magnitude of drop in current density during initial 30 min at higher potentials could be linked to water splitting and electro convection phenomena[26,27]where,the ion flux increased several folds possibly during over limiting situation.The extent of electro convection and water splitting at 10 V is relatively lesser compared to higher voltages.Thus,a significant rise in current density was not recorded at 10 V.At higher potential,these phenomena caused more available ions which reduced cell resistance[26]and increased R[Fig.4(b)].
Current efficiency at the end of ED experiment for different applied potentials was calculated from Eq.(4)and highest efficiency was attained at 15 V[Fig.4(c)].A higher contribution of electro-migration/convection than the waters plitting to the to talion flux atlowervoltages(10 V-15 V)possibly improved efficiency which subsequently reduced beyond 15 V.Several unwanted phenomena e.g.contribution by water splitting,co-ion leakage,and OH-ion transport to the total ion flux[14,15]possibly affected current efficiencies above 15 V.This observation can be supported from earlier reports published on recovery of formic acid and tartaric acids via electrodialysis,where highest efficiency was observed at an intermediate current density[15,27].At higher potential,accumulation of H+/OH-(waters plitting)ions nearmembrane surface opposed ion transport(called barrier effect[27,28])which resulted in lowering of CA transport through polarized boundary layers in feed compartment.Excessive accumulation of bulky CA ions will result in steric crowding with further lowering in CA transport and efficiency.
The energy consumption[estimated using Eq.(5)]required for CA recovery was presented in Table 3.Energy consumption increased between 0.33-1.6 kW·h·kg-1with potential rise(10 V-20 V)makes the process cost intensive.Therefore,an intermediate potential(15 V)with high current efficiency and lower energy requirement would be appropriate.

Table 3 Energy consumption(kW·h·kg-1)values for all sets of electro dialysis experiments
3.2.Effect of flow rates on recovery
Both current density[Fig.5(a)]and R[Fig.5(b)]got reduced with larger flow rates.At higher flow rates,although the boundary layer thickness(resistance to ion transport)reduced at the expense of pressure drop/pumping cost[29]but,a drop in R was recorded.Atlarger flow rates,lower residence time of the recirculating feed reduces effective membrane contact area and transport of bulky CA ions.Thus,drop in current density and R were observed with increase in flow rate,which is consistent with Nikbakht et al.[7].
Current efficiency estimates also showed an optimumvalue in an intermediate flow rate[15 LPH,Fig.5(c)].Energy consumption estimates gotlowered(0.84-0.78 kW·h·kg-1)with flow rates,due to low current density.Therefore,to obtain a feasible recovery process,the flow rate needs to be carefully chosen which could improve CA recovery with minimum energy consumption.
3.3.Effect of temperature on citric acid transport
Current density[Fig.6(a)],R[Fig.6(b)]and efficiencies[Fig.6(c)]increased with temperature.Possibly higher diffusivity,mobility and conductivities of CA at higher temperature facilitated transport[7].With rise in temperature,ion transfer rate is improved due to low solution and membrane[30]resistance.Using Eq.(6),the p K1valuesestimated were 3.13(25 °C),3.108(35 °C),3.102(40 °C)and 3.097(45 °C)indicating higher extent of dissociation with temperature(Table 4)which facilitated ion transport.Additionally,reduced solution viscosity from 1.05 mPa·s-1(25 °C)to 0.55 mPa·s-1(45 °C,Table 4)at higher temperatures facilitated CA ion recovery.Furthermore,measurement of electrical conductivity of solution at different temperatures(CM 183EC-TDS analyzer,Elico India)showed linear rise with temperature(Table 4).This reduced the solution resistance and favored ion transport.Thus,higher temperature facilitated easy transport of ions with improved efficiency but this enhanced energy consumption(0.82-1.1 kW·h·kg-1).

Fig.5.(a)Variation in current density with time under different flow rates;(b)R of citric acid from feed;(c)variation of current efficiency with flow rates.Feed and concentrate streams both containing 0.1 mol·L-1 citric acid were circulated through the ED stack.Feed flow rates were varied as 5 LPH,10LPH,15 LPH,20 LPH and 25 LPH.Electrodialysis was carried out for 270 min,under applied potential of 15 V at 25°C.
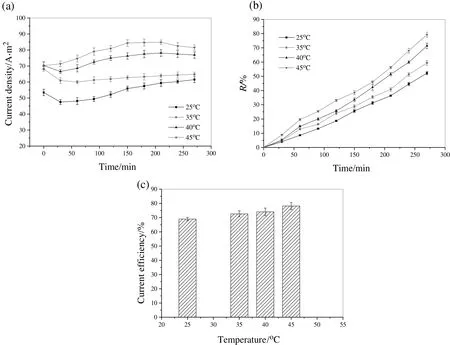
Fig.6.(a)Current density variation with time at different temperatures of ED operation;(b)R of citric acid from feed;(c)variation of current efficiency with temperature.Feed and concentrate streams both containing 0.1 mol·L-1 citric acid were circulated through the ED stack at 15 LPH.Electrodialysis was carried out for 270 min,under applied potential of 15 V at various temperatures of 25 °C,35 °C,40 °C and 45 °C.

Table 4 Values of different physical parameters
3.4.Role of initial feed concentration
Current density increased with rise in initial feed concentration[0.05-0.2 mol·L-1,Fig.7(a)].Drop in current density beyond 200 min with the lowest initial feed concentration was due to limited citrate ions(weak acid)which increased solution resistance under constant applied potential.Higher R of CA was noted with higher initial feed concentration[Fig.7(b)].Current efficiency[Fig.7(c)]increased in lower initial concentration range(0.05 mol·L-1to 0.1 mol·L-1)but didn't vary beyond 0.1 mol·L-1,while the calculated energy consumption increased from 0.76-0.91 kW·h·kg-1with rise in initial feed concentration from 0.05-0.2 mol·L-1.
Additionally,the molecular diffusion related driving force also plays a role in CA transport through membrane.As long as the feed concentration is lower(0.05 mol·L-1)than concentrate(0.1 mol·L-1)stream,molecular diffusion(concentrate to feed)acts opposite to the ion transport caused by applied potential(back diffusion,Fig.2)which reduced the resultant transport of CA.The resultant transport would be net effect of two opposing forces e.g.molecular diffusion and applied potential.Usually applied potential being more dominating over molecular diffusion it needs to overcome back diffusion factor to cause any transport.Current efficiency was minimum with 0.05 mol·L-1feed but it didn't increase beyond 0.1 mol·L-1in spite of favorable molecular diffusion/applied potential.Possibility of steric hindrance(bulky CA),poor dissociation(weak acid)and lower diffusivity at higher concentration impeded CA transport.This observation is consistent with results of Rock straw and Scamehorn[31],where steric crowding due to higher concentration influenced ionic mobility/transport through solution.Muller and Stokes[32]reported lowering of CA diffusivities with increase in concentration.Besides steric crowding,adsorption of organic acids,formation of electric double layer and subsequent accumulation inside free volume of membrane matrix should also be looked into[33].Formation of electrical double layer at the solution-membrane interface might affect electrochemical properties of membrane and this phenomena created repulsion to incoming ions[11].A quantitative estimation of this adsorption phenomenon was carried out through(i)contact angle/surface energy,(ii)CA adsorption equilibrium,(iii)Chronopotentiometry/ion transport kinetics and(iv)AFM analysis for surface topology.

Fig.7.(a)Current density variation with different citric acid concentration used as feed stream;(b)R of citric acid with various feed concentration;(c)variation of current efficiency with initial feed concentration.Feed solution containing citric acid of 0.05 mol·L-1,0.1 mol·L-1,0.15 mol·L-1,0.2 mol·L-1,while concentrate stream of 0.1 mol·L-1 CA were circulated through ED stack at 15 LPH for 270 min,under applied potential of 15 V at 25°C.
3.4.1.Contact angle and surface energy estimates of AEM
The amount of intermolecular forces(attractive,repulsive etc.)over a surface gives a measure of its surface energies.Surface energy is often used to define wettability of a surface.Strong attractive forces would cause a drop to spread over the surface which is a measure of surface wettability.The angle(measured through liquid)between solid and liquid-vapor interface is known as contact angle.This gives information about wettability of the solid.Surfaces with low wetting indicate high contact angle and low surface energy.
Young's equation is used to explain relationship between surface energy of a solid(σs),contact angle of liquid(θ),surface tension of liquid(σl)and inter facial tension between liquid and solid(σsl).

A combined plot of contact angle,surface tension and surface energy were plotted against feed concentrations[Fig.8(a)].A nonlinear rise in contact angle with feed concentration was observed,while both surface tension/surface energies attained maxima at 0.1 mol·L-1[Fig.8(a)].At lower CA concentration,electrostatic forces(attraction)between CA and AEM surface dominated over repulsive forces between adsorbed CA molecules and molecules(inside drop)approaching towards surface.This resulted in spreading of drop over AEM surface(i.e.,high surface energy)and lowering of contact angle.On the contrary at higher concentration,larger accumulation of CA molecules suppressed residual attractive forces of AEM surface,and increased repulsive forces between approaching CA molecules(inside drop)and AEM surface.These repulsive forces reduce spreading of liquid drop on solid surface,which resulted in high contact angle,less surface energy/surface tension athigher concentration.Various interactions occurring can be schematically shown in Fig.8(b-c).
3.4.2.Adsorption of CA over AEM
Equilibrium adsorption of CA over AEM(Fig.9)and role of solute concentration over adsorption phenomena were carried out.Increased adsorption of CA over AEM at higher concentration are attributed to electrostatic forces(attraction)between CA molecules and AEM surface,while CA-CA interactions(repulsion)among adsorbed molecules would lead to desorption from AEM surface.A membrane kept in contact with feed solution for long duration shows attainment of equilibrium when rate of adsorption and desorption are same.The adsorption isotherm:Y(moles of CA/gm of membrane)versus C(concentration of CAin equilibrating solution)plot follows Freundlich behavior:

Fig.8.(a).Contactangle and surface energy changes occurring with concentration of citric acid over AEM.(b)Schematic indicating contact angle measurement of citric acid solution over AEM;(c)Various forces acting between adsorbed CA-AEM(attractive)while repulsive forces are between adsorbed CA-approaching drop containing CA molecules and forces among CA molecules adsorbed over AEM.

k,n are experimentally determined constants.
By applying logarithms on both sides,

By plotting lg Y versus lg C,k=0.00143 and 1/n=0.3892.
This study confirms non uniform distribution of active site over AEM surface,which leads to random adsorption behavior(Freundlich)of CA molecules.This shows active sites of AEM are irregularly spaced and possibly they are existing as clusters at different locations which is a common behavior with all heterogeneous membranes.Adsorption of CA over those active sites severely limits ion transport and the membrane becomes highly resistive.This supports our findings of efficiency drop at higher feed concentration(>0.1 mol·L-1).
3.4.3.Resistance using chronopotentiometry

Fig.9.Adsorption isotherm of different concentrations of citric acid over AEM:CA in membrane versus CA in equilibrating solution.

Fig.10.Effect of feed concentration(0.05,0.1,0.15 and 0.2 mol·L-1)in dilute chamber on AEM resistance by chronopotentiometry.
Application of constant current density(67 A·m-2)through the Chronopotentiometric cell(Fig.3)containing equilibrated(different feed solutions)membranes indicate that the starting potentials,ε0(Fig.10)are dependent on feed concentrations:0.05 mol·L-1(0.94 V),0.1 mol·L-1(1.23 V),0.15 mol·L-1(1.42 V)and 0.2 mol·L-1(1.62 V).Initialhighε0is attributed to more resistance to ion transport contributed by both solution and membrane phases.In solution size,mobility(diffusivity)of solute is inversely related to concentration due to steric crowding[32]while in membrane,higher accumulation/adsorption of molecules decides the effective resistance that hindered CA transport.Therefore,net transport occurs,once ion overcomes both solution and membrane phase resistance.
3.4.4.AFM analysis
AFM can quantitatively estimate various forces(i.e.,van der Waal,attractive nature;tip and sample electron orbitals overlap,repulsive nature;and electrostatic forces due to adsorption/dissociation of IEM surface group)[34]between tip and sample.
Fig.11(a)shows variation of force with distance(Z)noted with 0.05 mol·L-1CA adsorbed over AEM.Schematic of a typical force vs distance curve[Fig.11(a)]:Approach(blue)and retract(red).Initially repulsive forces were dominant,when tip and sample were distant apart and as they approached nearer,an upward bending of cantilever was noticed.At a specific position,when gradients of spring and repulsive force are lower than gradient of the van der Waal attraction,the tip started hopping over surface.Further closeness of sample caused cantilever deflection and a continuous diagonal line appeared when the tip touched the sample.Finally,the tip was retracted back to its original position.When the sample was moved away from the tip,the tip sticks to the surface up to large distances.This was caused due to van der Waal force and by adhesion.Due to this hysteresis,repulsive forces become more difficult to estimate on retract than during the approach.

Fig.11.(a).Force curve obtained from AFM analysis for a feed concentration of0.05 mol·L-1 CA adsorbed on AEM.(b).Force curves of AEM for different concentrations of CA in feed chamber using AFM.
Force measurements with each equilibrated AEM sample were plotted in Fig.11(b).Membranes equilibrated with higher concentration of CA showed reduced electrostatic interactions(van der Waal forces).Magnitude of adhesive force(i.e.extent of force decay)with different AEM samples was shown in Table 5.IEM samples equilibrated with DI(deionized)water showed strong adhesion(Sample 1)compared to the remaining samples.Counter polarity of tip and AEM surface besides high dielectric constant and polarity of water relative to CA molecules resulted in strong adherence of tip to AEM surface.
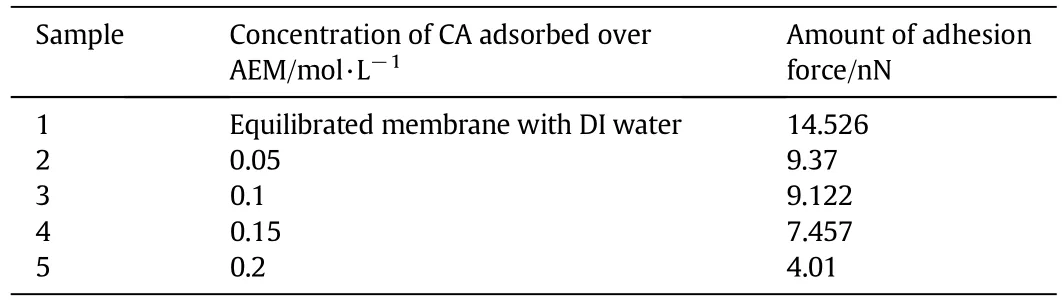
Table 5 Amount of adhesion force(or extent of force decay)for all samples

Fig.12.(a)Current density change with concentrate stream composition;(b)R of CA with variation in concentrate stream composition;(c)Current efficiencies measured with concentrate stream composition.All measurements were done with 0.1 mol·L-1 CA as feed solution while concentrate stream compositions were varied(0.1 mol·L-1 CA,NaCl,CaCl2,FeCl3),both streams were circulated through ED stack(15 LPH,15 V,25°C).

Fig.13.Schematic diagram of tri-valention(Fe3+)adsorption on CEM,creating hindrance to ion transport during ED,when concentrate chamber is having 0.1 mol·L-1 FeCl3 and 0.1 mol·L-1 CA solution in dilute chamber.
Variation in magnitude of force with different CA concentrations was mainly due to change in van der Waal attraction and there was no detectable repulsive force acting between tip and sample.Surface charge over AEM showed electrostatic(attractive/repulsive)behavior.Butt[34]explained that surface charge phenomena of silicon nitride tip might be a reason for the attractive electrostatic forces,as silicon nitride carries a mild negative charge.Electrostatic forces between negatively charged tip and counter-ionic AEM resulted in attractive forces.

Fig.14.Chronopotentiometric analysis for transient resistance variation of AEM in presence of 0.1 mol·L-1 electrolytes(NaCl,CaCl2,FeCl3,and CA)solution.
Higher adsorption of CA molecules with increased concentration reduced residual surface charge over AEM surface and this resulted in lowering of adhesive forces.Electrostatic repulsion between adsorbed CA molecules also affected adhesive behavior.
3.5.Electrolytes in concentrate stream
Nature of electrolyte(s)and their concentration significantly affected performance of batch ED[35].Fig.12(a-c)show current density,R and current efficiency behavior when 0.1 mol·L-1CA/NaCl/CaCl2or FeCl3were circulated as concentrate stream,while feed was maintained at 0.1 mol·L-1CA for all measurements.Ignoring the exception withFeCl3,current densities[Fig.12(a)]and R[Fig.12(b)]were noted to be higher with stronger electrolytes(NaCl,CaCl2)compared to weak electrolyte CA.Highervalentions,Fe3+(tri-valention)gets strongly adsorbed over CEM compared to mono/bi-valent cations which increased membrane resistance several folds[35,36].Thus,the presence of Fe3+in the concentrate stream will hinder H+ion transport through CEM(diluate to concentrate,Fig.13)which will simultaneously reduce anion(citrate ions/OH-)transport through AEM to maintain electro-neutrality.
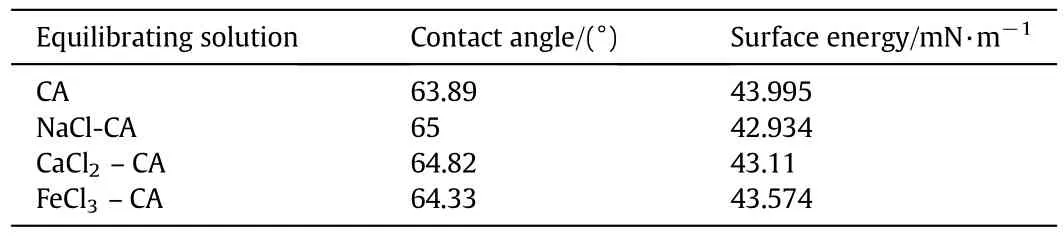
Table 6 Contact angle and surface energy measurements of AEM equilibrated with different salt solutions
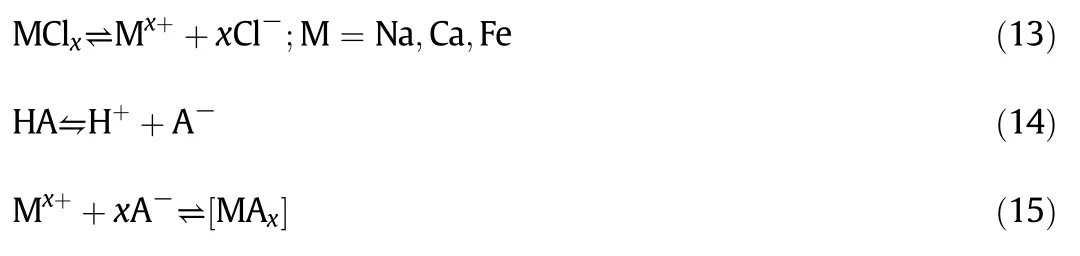
In addition,metal-citrate complexation[Eqs.(13)-(15)]between the citrate ion and available metal ions in concentrate compartment(Fig.2)will result in lower solution conductivity and a drop in current density.
Ionic resistance for different electrolytes responsible for CA transport was estimated from Chronopotentiometry analysis.
3.5.1.Chronopotentiometry analysis

Fig.15.(a)Current density change with different feed compositions;(b)R of citric acid with each feed composition;(c)current efficiency measured after 270 min of ED recovery from different feed compositions.All measurements were carried out with feed(0.1 mol·L-1 CA containing 0.1 mol·L-1 NaCl,CaCl2,FeCl3)while concentrate stream was maintained at 0.1 mol·L-1CA;both streams were circulated through ED stack at 15 LPH,15 V,25 °C.
Ion transport kinetics through AEM gets affected due to continuous change in solution resistance and can be understood using Chronopotentiometry analysis(Fig.14).CA of 0.1 mol·L-1was used in cathode compartment,while composition of anode compartment was varied as 0.1 mol·L-1CA/NaCl/CaCl2or FeCl3.Current density of 67 A·m-2(equivalent to ED process)was applied through the Chronopotentiometry assembly(Fig.3)for each measurement.
Voltage variations with time are distinctly different(Fig.14)with each electrolyte.Remarkable observations are(i)slow rise in voltage for each membrane tested,(ii)initial(ε0)and final(εmax)voltage readings and their differences were different for each equilibrated membrane.Voltage difference(Δε= εmax- ε0)gives a measure of concentration polarization developed at membrane-solution interface due to mobility difference of CA in solution and AEM matrix[21].Slow rise in voltage readings(Fig.14)were attributed to slow growth of polarization layer due to(i)limited CA ions(weak acid)and(ii)lower diffusivity of CA ions.Similar trend of increased potential with acetate anion was reported earlier by Ray et al.[21].Highest εmaxwith CA as electrolyte was obvious due to increased resistance.
OverallOhmic resistance based on initialvoltage reading(ε0)followed the sequence:NaCl(0.16 V)<CaCl2(0.5 V)<FeCl3(0.73 V)<CA(1.23 V).Number of Cl-ions per unit volume(Eq.(13))increases in the order:NaCl<CaCl2<FeCl3for equimolar solution.These ions electrostatically adhere to AEM surfaces and reduce residual charges hindering citrate anion transport through AEM(i.e.ε0values followed above order of increasing resistance).
With application of constant current,ions start moving through AEM and create concentration polarization where concentration gradient is created and voltage drop increases with time.Easy attainment of saturation at lower voltage with NaCl and CaCl2indicates quick formation of concentration polarization due to easier transport of these ions and lower membrane resistance.With CA and FeCl3the saturation voltages are higher than NaCl/CaCl2due to higher membrane resistance with these electrolytes.

Fig.16.Comparison of R of CA in presence and absence of electrolytes:(a)NaCl,(b)CaCl2 and(c)FeCl3.
In addition,contact angle and surface energy estimation was carried out to understand metal ions-membrane interactions and their effect in analyzing membrane resistance.For this analysis,AEMwas equilibrated with 0.1 mol·L-1concentration of different inorganic salts and 0.1 mol·L-1CA as testing liquid.Contact angle decreased and surface energy increased(Table 6)with inorganic metal ions in the order as:NaCl>CaCl2>FeCl3.Reduced contact angles indicate spreading of CA over AEM due to stronger attraction of CA-metal ions,i.e.,interactions of metal-CA ions increases as charge of metal ions increases.Thus,adsorption of metalions over membranes increased membrane resistance and reduced effective transport through them.
3.6.Electrolytes in feed stream
Feed stream containing strong electrolyte(NaCl/CaCl2/FeCl3)showed higher current densities(CA<NaCl<CaCl2<FeCl3)compared to no electrolyte case[Fig.15(a)]under an applied constant potential.Steep rise in current density during initial 30-100 min was attributed to higher conductivities:NaCl-16.78mS;CaCl2-18.31mS;FeCl3-48.16mS compared to mere 2.9mS with CA alone.Similar steep rise and subsequent drop in current density was also reported by Prochaska and Woźniak-Budych[37]during ED of the feed containing NaCl/fumarate solution.Initial higher conductivity indicates availability of more free ions(Cl-ions)in solution.High mobility of Cl-ions facilitated ion transport through feed solution and increased current density,which got reduced after~100 min.With applied potential,Cl-ions starts depleting from feed stream which resulted in conductivity lowering.Final conductivity values of feed solution(s)were:NaCl-3.41mS;CaCl2-12.6mS;and FeCl3-6.08mS.Complete dissociation of NaCl/CaCl2/FeCl3,high mobility,small size of Cl-helped it to compete easily with bulky citrate anions.Relatively higher transport of inorganic anions compared to bulky organic anions were also reported by Zhang et al.[11].
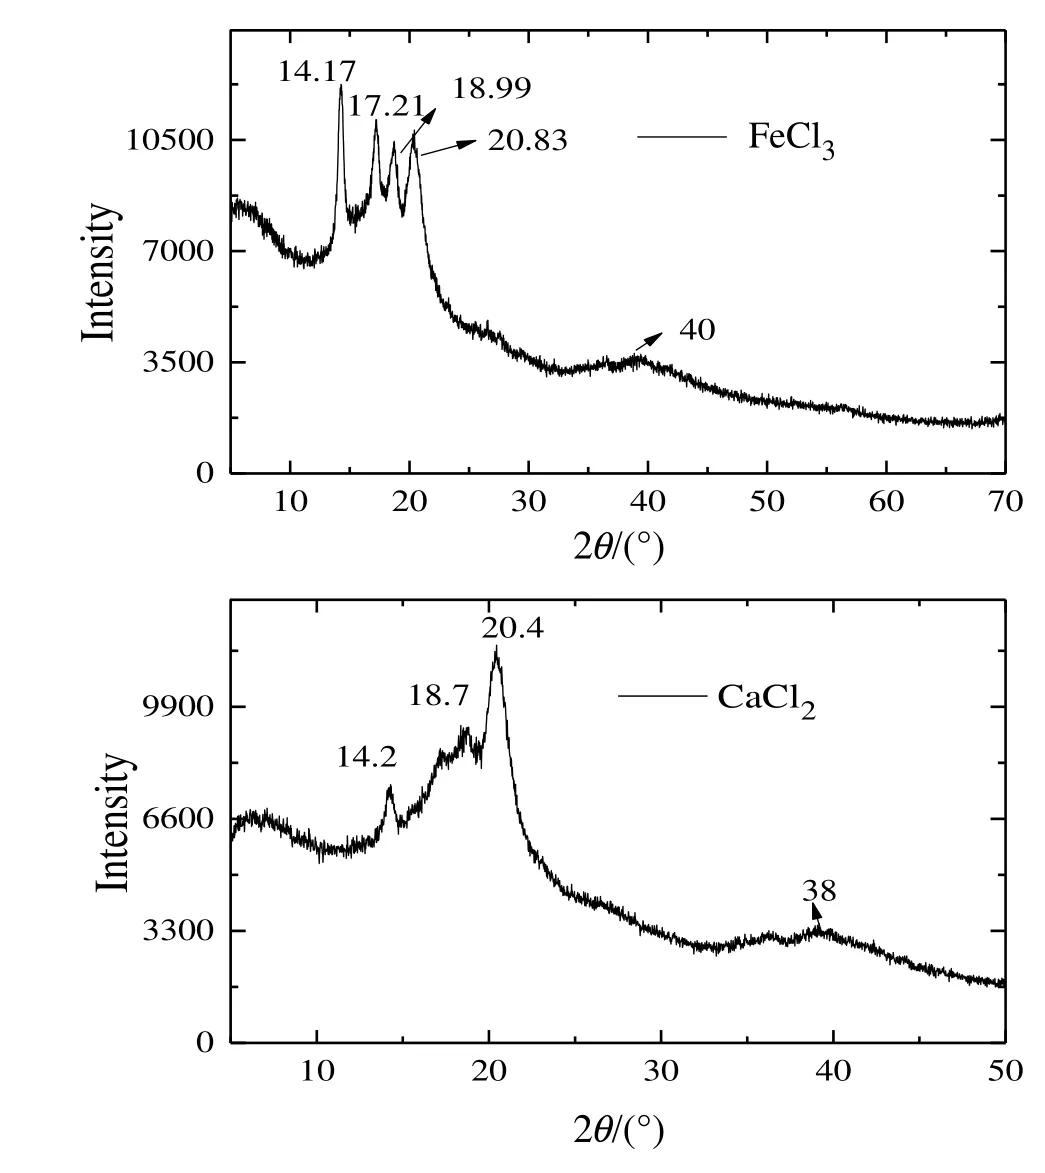
Fig.17.XRD spectra of CEM after ED operation carried out with FeCl3 and CaCl2 streams.
Overall R and current efficiencies were higher with no electrolyte cases compared with electrolytes in feed.The R[Fig.15(b)]followed the following order:CA-50.4%>NaCl-23.4%>FeCl3-9.6%≤CaCl2-8.8%.In absence of strong electrolytes,applied potential was utilized effectively to transport only CA while,in presence of strong electrolytes it was used for transporting both Cl-and CA ions.Inorganic anions were transported first followed by transport of organic anions which resulted in lower current efficiencies for NaCl-16%,CaCl2-18%and FeCl3-5%[Fig.15(c)].
Rapid drop in current density with CaCl2compared to NaCland FeCl3was interesting and it possibly hints a complex phenomenon,where a stable chelated complex(citrate-metal,e.g.calcium citrate[38])formation might reduce solution conductivity/current density.This insoluble complex when deposited over membrane surface can abruptly drop ion transport.Possibility of metal chelates(Mx.CA)with carboxylic acids and their deposition were also reported by Zhang et al.which resulted drop in current density[11].Thus lower current efficiency values were noted with NaCl,CaCl2and FeCl3than compared to CA.Energy consumption values calculated for CA,CA+NaCl,CA+CaCl2and CA+FeCl3were 0.82 2.15,0.8 and 2.7 kW·h·kg-1.

Fig.18.EDX analysis of CEM after ED operation carried out with CaCl2 and FeCl3 streams.
CA recovery(%)in presence/absence of electrolytes was compared separately for each electrolyte case as in Fig.16(a-c)indicating a reduced transport of CA in presence of electrolyte.Any possibility of metal ion(Mx+)adsorption over CEM[35](in the ED cell,Fig.2),was analyzed using XRD.Fig.17 shows the existence of ferric oxide(Fe2O3)and Fe(OH)3at 14.17°,17.21°,18.99°,20.83°and 40°and CaO and Ca(OH)2at 14.2°,18.7°,20.4°,38°.These salts hydrates also increased membrane overall resistance and reduced R.EDX analysis of the used(after experiment)CEM showed presence of Ca,Fe(Fig.18)which possibly increased resistance of the membrane and reduced R.
4.Conclusions
Citric acid recovery using batch ED atlow pH(~2)was carried out at constant applied potential.Ion transport was monitored from current density values with time.Maximum current efficiency was achieved with potential(~15 V), flow rate(15 LPH)and feed concentration(0.1 mol·L-1).Although current efficiency increased with temperature,mechanical stability and ion selectivity of membrane limits its applicability.Drop in current efficiency beyond 0.1 mol·L-1feed was critically analyzed from:(i)contact angle,(ii)Chronopotentiometry,(iii)adsorption equilibrium and(iv)AFM.More accumulation of CA molecules induce repulsive forces between approaching CA molecules(inside drop)and AEM surface which resulted in higher contact angle i.e.lower surface energy.Membrane resistance rose with adsorption of CA molecules and affected transport.Reduced adhesive forces with feed concentration also confirmed accumulation of CA molecules.
Efficiencies were much lowered with electrolytes in feed[16%(NaCl),18%(CaCl2)and 5%(FeCl3)]compared to their presence in concentrate stream[42%(NaCl),43%(CaCl2)and 27%(FeCl3)].Accumulation of increasing number of Cl-ions over AEM reduced counter-ionic charges and increased membrane resistance NaCl<CaCl2<FeCl3.Existence of Fe2O3,Fe(OH)3,CaO and Ca(OH)2over CEM was confirmed through XRD analysis and existence of Ca,Fe over CEM was confirmed through EDX analysis.These salts and salt hydrates increased membrane resistance and drastically reduced current efficiencies with higher valency metal ions.
Nomenclature
CctConcentration of citric acid in concentrate chamber at time t,mol·L-1
Cc0Concentration of citric acid in concentrate chamber at time 0,mol·L-1
CdtConcentration of citric acid in feed chamber at timet,mol.L-1
Cd0Concentration of citric acid in feed chamber at time 0,mol·L-1
E Energy consumption,kW·h·kg-1
F Faraday constant,96500 C·mol-1
I Current,A
M Molar mass of citric acid,g·mol-1
N Number of cell pairs
T Temperature,°C
t time,s
Vc0Volume in concentrate chamber at time 0,m3
VctVolume in concentrate chamber at time t,m3
ε Applied potential across stack,V
η Current efficiency
Acknowledgements
Financial support to execute the experimental work is gratefully acknowledged to IIT Roorkee(No.IITR/SRIC/244/FIG-Sch-A)and UAY Project(ICSR/UAY/2016/SN dt.04/01/2017),India.
[1]C.R.Soccol,L.P.S.Vandenberghe,C.Rodrigues,A.Pandey,New perspectives for citric acid production and application,Food Technol.Biotechnol.44(2006)141-149.
[2]H.Feleke,Small-Scale Citric Acid Production on Solid State Fermentation Using Aspergillus niger,Addis Ababa University,Ethiopia,2010.
[3]N.A.Amenaghawon,F.A.Aisien,Modelling and simulation ofcitric acid production from corn starch hydrolysate using Aspergillusniger,Environ.Nat.Resour.Res.2(2012)73-85.
[4]L.-P.Ling,H.-F.Leow,M.R.Sarmidi,Citric acid concentration by electrodialysis:Ion and water transport modelling,J.Membr.Sci.199(2002)59-67.
[5]G.S.Luo,X.Y.Shan,X.Qi,Y.C.Lu,Two-phase electro-electrodialysis for recovery and concentration of citric acid,Sep.Purif.Technol.38(2004)265-271.
[6]S.Novalic,F.Jagschits,J.Okwor,K.D.Kulbe,Behaviour of citric acid during electrodialysis,J.Membr.Sci.108(1995)201-205.
[7]R.Nikbakht,M.Sadrzadeh,T.Mohammadi,Effect of operating parameters on concentration of citric acid using electrodialysis,J.Food Eng.83(2007)596-604.
[8]X.Tongwen,Y.Weihua,Citric acid production by electrodialysis with bipolar membranes,Chem.Eng.Process.Process Intensif.41(2002)519-524.
[9]X.Tongwen,Y.Weihua,Effect of cell configurations on the performance of citric acid production by a bipolar membrane electrodialysis,J.Membr.Sci.203(2002)145-153.
[10]M.Papagianni,Advances in citric acid fermentation by Aspergillus niger:Biochemical aspects,membrane transport and modeling,Biotechnol.Prog.25(2007)244-263.
[11]Y.Zhang,L.Pinoy,B.Meesschaert,B.Van der Bruggen,Separation of small organic ions from salts by ion-exchange membrane in Electrodialysis,AIChE 57(2011)2070-2078.
[12]J.G.D.Tadimeti,A.Chandra,S.Chattopadhyay,Optimum concentrate stream concentration in CaCl2 removalfrom sugar solution using electrodialysis,Chem.Eng.Process Technol.6(2015)1-13.
[13]L.Madzingaidzo,H.Danner,R.Braun,Process development and optimisation of lactic acid puri fication using electrodialysis,J.Biotechnol.96(2002)223-239.
[14]Y.Wang,N.Zhang,C.Huang,T.Xu,Production of monoprotic,diprotic,and triprotic organic acids by using electro dialysis with bipolar membranes:Effect of cell configurations,J.Membr.Sci.385-386(2011)226-233.
[15]G.S.Luo,S.Pan,J.G.Liu,Use of the electrodialysis process to concentrate a formic acid solution,Desalination 150(2002)227-234.
[16]J.S.J.Ferrer,S.Laborie,G.Durand,M.Rakib,Formic acid regeneration by electro membrane processes,J.Membr.Sci.280(2006)509-516.
[17]H.J.Lee,M.K.Hong,S.D.Han,S.H.Cho,S.H.Moon,Fouling of an anion exchange membrane in the electrodialysis desalination process in the presence of organic foulants,Desalination 238(2009)60-69.
[18]V.Silva,E.Poiesz,P.van der Heijden,Industrial wastewater desalination using electrodialysis:Evaluation and plantdesign,J.Appl.Electrochem.43(2013)1057-1067.
[19]J.-H.Choi,S.-H.Kim,S.-H.Moon,Heterogeneity of ion-exchange membranes:The effects of membrane heterogeneity on transport properties,J.Colloid Interface Sci.241(2001)120-126.
[20]X.T.Le,P.Viel,D.P.Tran,F.Grisotto,S.Palacin,Surface homogeneity of anion exchange membranes:A chronopotentiometric study in the overlimiting current range,J.Phys.Chem.B 113(2009)5829-5836.
[21]P.Ray,V.K.Shahi,T.V.Pathak,G.Ramachandraiah,Transport phenomenon as a function of counter and co-ions in solution:Chronopotentiometric behavior of anion exchange membrane in differ ent aqueous electrolyte solutions,J.Membr.Sci.160(1999)243-254.
[22]M.Hossain,L.Wu,Y.Li,L.Ge,T.Xu,Preparation of porous poly(vinylidene fluoride)membranes with acrylate particles for electrodialysis application,Sep.Purif.Technol.150(2015)102-111.
[23]H.J.Butt,B.Cappella,M.Kappl,Force measurements with the atomic force microscope:Technique,interpretation and applications,Surf.Sci.Rep.59(2005)1-152.
[24]ScanAsyst:Expert AFM Made Easy,(n.d.).https://www.bruker.com/ fileadmin/user_upload/8-PDF-Docs/Surface Analysis/AFM/Brochures/ScanAsyst-atomic-forcemicroscopy-imaging-mode-brochure-B071-B0.pdf.
[25]E.Vera,J.Sandeaux,F.Persin,G.Pourcelly,M.Dornier,J.Ruales,Modeling of clari fied tropical fruit juice deacidi fication by electrodialysis,J.Membr.Sci.326(2009)472-483.
[26]J.Balster,M.H.Yildirim,D.F.Stamatialis,R.Ibanez,R.G.H.Lammertink,V.Jordan,M.Wessling,Morphology and microtopology of cation-exchange polymers and the origin of the overlimiting current,J.Phys.Chem.B 111(2007)2152-2165.
[27]T.V.Eliseeva,E.V.Krisilova,V.P.Vasilevsky,E.G.Novitsky,Electrodialysis of solutions of tartaric acid and its salts,Pet.Chem.52(2013)609-613.
[28]V.A.Shaposhnik,T.V.Eliseeva,Barrier effectduring the electrodialysis ofampholytes,J.Membr.Sci.161(1999)223-228.
[29]K.Praneeth,D.Manjunath,S.K.Bhargava,J.Tardio,S.Sridhar,Economical treatment of reverse osmosis reject of textile industry ef fluent by electrodialysis—Evaporation integrated process,Desalination 333(2014)82-91.
[30]G.Q.Chen,F.I.I.Eschbach,M.Weeks,S.L.Gras,S.E.Kentish,Removal of lactic acid from acid whey using electrodialysis,Sep.Purif.Technol.158(2016)230-237.
[31]D.A.Rockstraw,J.F.Scamehorn,Use of electrodialysis to remove acid,salt,and heavy metal mixtures from aqueous solutions,Sep.Sci.Technol.32(1997)1861-1883.
[32]T.A.Müller,R.H.Stokes,The mobility of the undissociated citric acid,Trans.Faraday Soc.53(1957)642-645.
[33]M.Kang,S.Cho,S.Kim,Y.Choi,S.Moon,Electrodialytic separation characteristics of large molecular organic acid in highly water-swollen cation-exchange membranes,J.Membr.Sci.222(2003)149-161.
[34]H.Butt,Measuring electrostatic,vander waals,and hydration forces in electrolyte solutions with an atomic force microscope,Biophys,J.Biophys.Soc.60(1991)1438-1444.
[35]J.G.D.Tadimeti,S.Chattopadhyay,Physico-chemical local equilibrium in fluencing cation transport in electrodialysis of multi-ionic solutions,Desalination 385(2016)93-105.
[36]A.Chapotot,G.Pourcelly,C.Gavach,Transport competition between monovalent and divalent cations through cation-exchange membranes.Exchange isotherms and kinetic concepts,J.Membr.Sci.96(1994)167-181.
[37]K.Prochaska,M.J.Woźniak-Budych,Recovery of fumaric acid from fermentation broth using bipolar electrodialysis,J.Membr.Sci.469(2014)428-435.
[38]S.Thijssen,Citrate anticoagulation in hemodialysis,in:C.Angelo(Ed.),Prog.Hemodial.-From Emergent Biotechnol.To Clin.Pract.,InTech 2011,pp.217-226(http://www.intechopen.com/books/progress-in-hemodialysis-from-emergentbiotechnology-to-clinical-practice).
 Chinese Journal of Chemical Engineering2018年2期
- Chinese Journal of Chemical Engineering的其它文章
- Experimental investigation on CO2-light crude oil interfacial and swelling behavior
- Biosynthesis of 4-hydroxyphenylpyruvic acid from L-tyrosine using recombinant Escherichia coli cells expressing membrane bound L-amino acid deaminase☆
- Process development for producing a food-grade glucose solution from rice straws
- Carbon dioxide induced degradation of diethanolamine during absorption and desorption processes
- Biodegradation of natural and synthetic estrogens in moving bed bioreactor
- Molten waste plastic pyrolysis in a vertical falling film reactor and the in fluence of temperature on the pyrolysis products☆