
The built environment correlates of objectively measured physical activity in Norwegian adults:A cross-sectional study
2018-04-26 07:39AneKristinsenSolbrSigmundAlfredAnderssenIngrMortenHolmeElinKolleBjrgeHermnHnsenMureenAshe
Ane Kristinsen Solbr*,Sigmund Alfred Anderssen,Ingr Morten Holme,Elin Kolle,Bjrge Hermn Hnsen,Mureen C.Ashe
aDepartment of Sports Medicine,Norwegian School of Sport Sciences,Oslo 0806,Norway
bFaculty of Teacher Education and Sport,Western University of Applied Sciences,Sogndal 6851,Norway
cCentre for Hip Health and Mobility,Vancouver,BC V5Z 1M9,Canada
dDepartment of Family Practice,University of British Columbia,Vancouver,BC V6T 1Z3,Canada
1.Introduction
Built environments that are designed to provide accessible,attractive,and convenient locales promote regular physical activity(PA).1-7Factors such as access to key destinations(e.g.,shops,services,work,etc.),safety from traffic,degree of urbanization(population density or size of municipality),and quality of the environment(general activity-friendliness)are related to adults’total PA.2,3,5-7However,built environments vary across countries and regions and may be cultural and locally determined.3,7In particular,Norway has great variability in its geographic,natural,and built environment features.However,there are few studies that examine the association between objectively measured PA and built environment features in Norway.Thus,characterizing the association between Norwegian adults’activity patterns with perceptions of their built environments could provide insights into person-environment fit and unravel possible person-level characteristics that can inform future public health initiatives to promote PA.
A substantial body of literature highlights the benefits of regular PA in preventing non-communicable diseases.8-10Worldwide,physical inactivity(i.e.,not meeting recommended guidelines for PA11)is estimated to cause 6%-10%of the major non-communicable diseases and 9%of premature deaths.This makes inactivity similar to the established risk factors of smoking and obesity.Despite this knowledge,a large proportion of the world’s population remains physically inactive.12-15In Norway,only 32%of the population meets the recommended guidelines for PA.16
There are,however,considerable variations in PA levels and health within Norway.17-20In particular,for decades,the county of Sogn&Fjordane,located in the west part of Norway,has experienced one of the lowest levels of risk for myocardial infarction.17,21In addition,the county’s residents have higher levels of PA18,19and longer life expectancy20compared with other regions in Norway,despite the fact that the built environment—where the majority of the population lives—has been particularly designed to enhance PA only to a limited degree.As of 2017,Sogn&Fjordane has a population of approximately 110,000 inhabitants,and people mainly live in small urban areas or are scattered over a wide rural area.The population density for the region is 5.9 inhabitants/km2,compared with 13.2 inhabitants/km2throughout Norway.Sogn&Fjordane is situated in the middle of Fjord Norway,and contains some of the wildest and most beautiful scenery in Norway.The area has dramatic scenery including glaciers,mountain ranges,lakes,waterfalls,and fjords.22
Based on the knowledge of the influence of built environments on PA,the limitation of the built environment to enhance PA,and the beneficial health status and PA levels identified in Sogn&Fjordane,the primary aim of this study was to explore perceived built environment features and characterize their associations with objectively measured PA levels in Norwegian adults.The secondary aim was to explore the differences in these correlates between Sogn&Fjordane and the rest of Norway.
2.Materials and methods
2.1.Participants
In 2008-2009 we mailed a representative sample of 2462 men and women from 13 out of 19 counties in Norway,who were born between 1954-1956 and 1967-1969,to invite them to participate in the Physical Activity among Adults and Older People Study.This included a major sub-sample ofn=1096 adults from the county of Sogn&Fjordane andn=1366 adults from the rest of Norway.In the event of nonresponse,we contacted participants by phone and mail.Fifty-one invitations were returned because of an unknown address or death;therefore,the eligible sample consisted of 2411 men and women from across Norway.In total,1032 adults participated in the study,and 972 adults(40%)provided data with at least 1 built environment variable,which included 590 adults from Sogn&Fjordane and 382 adults from the rest of Norway.Average age of participants was 46.9±6.5 years(mean±SD)and 43.8%of participants were men.We described the study population in greater detail elsewhere.12,18
Data collection occurred between May 2008 and December 2009.When we received the signed informed consent form,we mailed participants the study questionnaires,an accelerometer(to objectively measure PA),and a prepaid envelope(to return the data and accelerometer).The study was approved by the Regional Committee for Medical Research Ethics,the Norwegian Social Science Data Services AS,and the Norwegian Tax Department.
2.2.Measures
2.2.1.PA
We used the ActiGraph GT1M accelerometer(ActiGraph LLC,Pensacola,FL,USA)to capture participants’patterns of PA over 7 days.We initialized the accelerometer and analyzed data using ActiLife(ActiGraph).We instructed participants to wear the monitor above their right hip during all waking hours for 7 consecutive days,except during water activities and showering.We set the epoch length to 10 s and reintegrated data into 60 s epochs.We excluded all night activity(between 00:00 and 06:00)and all periods of at least 60 min of consecutive 0 counts,with an allowance for interruptions of 1-2 min of counts above 0.12Participants with at least 10 h of PA data for at least 4 days were included in the analyses.23We present PA as total PA(mean counts per minute per day,cpm)and moderate-to-vigorous physical activity(MVPA)(≥2020 cpm,MVPA,min/day).24We used SAS-based software program(SAS-Institute Inc.,Cary,NC,USA)and CSA Analyzer(csa.svenssonspork.dk)for accelerometry data reduction.
2.2.2.Built environment
We used the empirical literature on built environment factors as a guide for including outcomes that are associated with PA in various settings and populations.6,25We asked participants to self-report the size of home municipality(number of residents)and provide their home address.We used a perceived community attribute using a 7-item scale,where participants indicated on a 4-point Likert scale the extent to which they agreed or disagreed with statements describing their community such as(1)safety of recreation areas and park;(2)access to PA facilities or locations;(3)organized opportunities for PA;(4)access to shops;(5)walking and biking facilities;(6)pedestrian street safety;and(7)crosswalks and signal lights.26,27The measures showed good internal consistency(α=0.79).We calculated a community perception score using the mean of at least 6 out of 7 items.We measured perceived walkability using a 4-item scale on which participants indicated their walking time from home to a(1)grocery store;(2)recreational area,park,or trail;(3)gym,swimming pool,sport center,or outdoor sport facility;and(4)forest or open field or mountain.We calculated a perceived walkability score by the mean of at least 3 out of 4 items.Participants self-reported commuting to work was assessed using the categories(1)car or motorbike(called motorized transport);(2)public transport;(3)biking;(4)walking;and(5)not applicable.We collapsed the categories biking and walking into 1 variable(called active transport),and excluded data from participants who responded “not applicable”.
2.2.3.Other variables
Participants self-reported age,sex,education level(less than high school,high school,university<4 years,or university≥4 years),current work status(later categorized into working and not working),smoking status(yes or no),height,and weight.We calculated body mass index(BMI)as self-reported weight(kg)divided by self-reported height squared(m2).Participants rated their perceived health as very good,good,either,poor,or very poor and later collapsed into either,good,and poor,and entered into the analyses.We measured PA self-efficacy using a 5-item scale,previously validated by Fuchs and Schwarzer,28((1)I am tired;(2)I feel depressed;(3)I am concerned;(4)I am angry,and(5)I feel stressed),on which the participants indicated on a 7-point Likert scale the extent to which they were confident(not at all confidenttovery confident)in their ability to perform planned PAs in the face of potential barriers.We calculated a self-efficacy score by the mean of at least 3 out of 5 items.27The measures showed good internal consistency(α=0.91).
2.3.Statistical analysis
We described participants’characteristics,stratified by sex and geographic area(Sogn&Fjordanevs.the rest of Norway),using mean±SD or as frequencies and proportions.We used Student’sttest for independent groups and χ2tests for proportions to identify differences between sexes and geographic areas.We used multiple linear regression to determine the association between objectively measured PA(dependent variables)and potential correlates(independent variables),and adjusted all associations for sex,BMI,education level,smoking,perceived health,and mean daily walk time.Preliminary analyses were conducted to ensure that there was no violation of the assumptions of linear regression.We created an interaction variable “sex/(location of residence)× independent variable”and included it in the model with the other variables.If there was a significant interaction with sex or location of residence,we presented sex-specific and geographic-area-specific associations separately.
We present results as regression coefficients(β),pvalues,and 95%confidence interval(CI).Residuals were normally distributed in the models.We then classified potential correlates by tertiles(below tertile 1:low score;between tertiles 1 and 2:medium score;above tertile 2:high score).Analyses of covariance were used to test the interaction(location of residence×tertiles of potential correlates)in relation to PA levels(dependent variable),adjusted for the potential confounders mentioned above(Fig.1).For the categorical variables the interaction variable(location of residence×potential correlates)was used.We used SPSS Version 20.0(IBM Corp.,Armonk,NY,USA)to conduct all analyses.The significance level was set top<0.05.
3.Results
3.1.Sample characteristics
We provide a summary of participants’characteristics in Table 1.Approximately 80%of the participants in both areas reported their health to be good.The majority of the participants were employed:96%in Sogn&Fjordane and 95%in the rest of Norway.In Sogn&Fjordane approximately 53%of adults were overweight or obese,compared with 48%of adults in the rest of Norway.Approximately 17.2%of adults in Sogn&Fjordane smoked,compared with 19.5%of adults in the rest of Norway(there were no statistically significant differences).
The residents of Sogn&Fjordane lived in less-populated municipalities(99.2%vs.14.6%living in municipalities with 10,000 inhabitants or fewer,p≤0.001)and reported lower community perception scores(3.1vs.3.4,p≤0.001).
Compared with the rest of Norway,adults in Sogn&Fjordane were significantly more physically active(43.1±26.5 min/dayvs.34.4±23.0 min/day of MVPA,p≤0.001).Commuting to work,such as biking or walking,differed significantly(p≤0.001)between regions:adults in Sogn&Fjordane were more likely to use active transport(20.7%vs.15.3%)and less likely to use public transport(1.6%vs.7.3%).
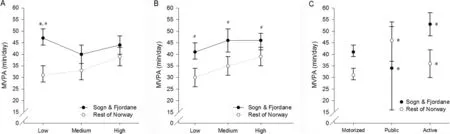
Fig.1.Associations between moderate-to-vigorous physical activity(MVPA)(min/day)and(A)community perception score,(B)perceived walkability score,and(C)types of transport for commuting,by location of residence.All associations are adjusted for sex,body mass index,education level,smoking,perceived health,and mean daily wear time.*p<0.05,compared with the other 2 tertiles or types in the same location;#p<0.05,compared with the same tertile in the other location.
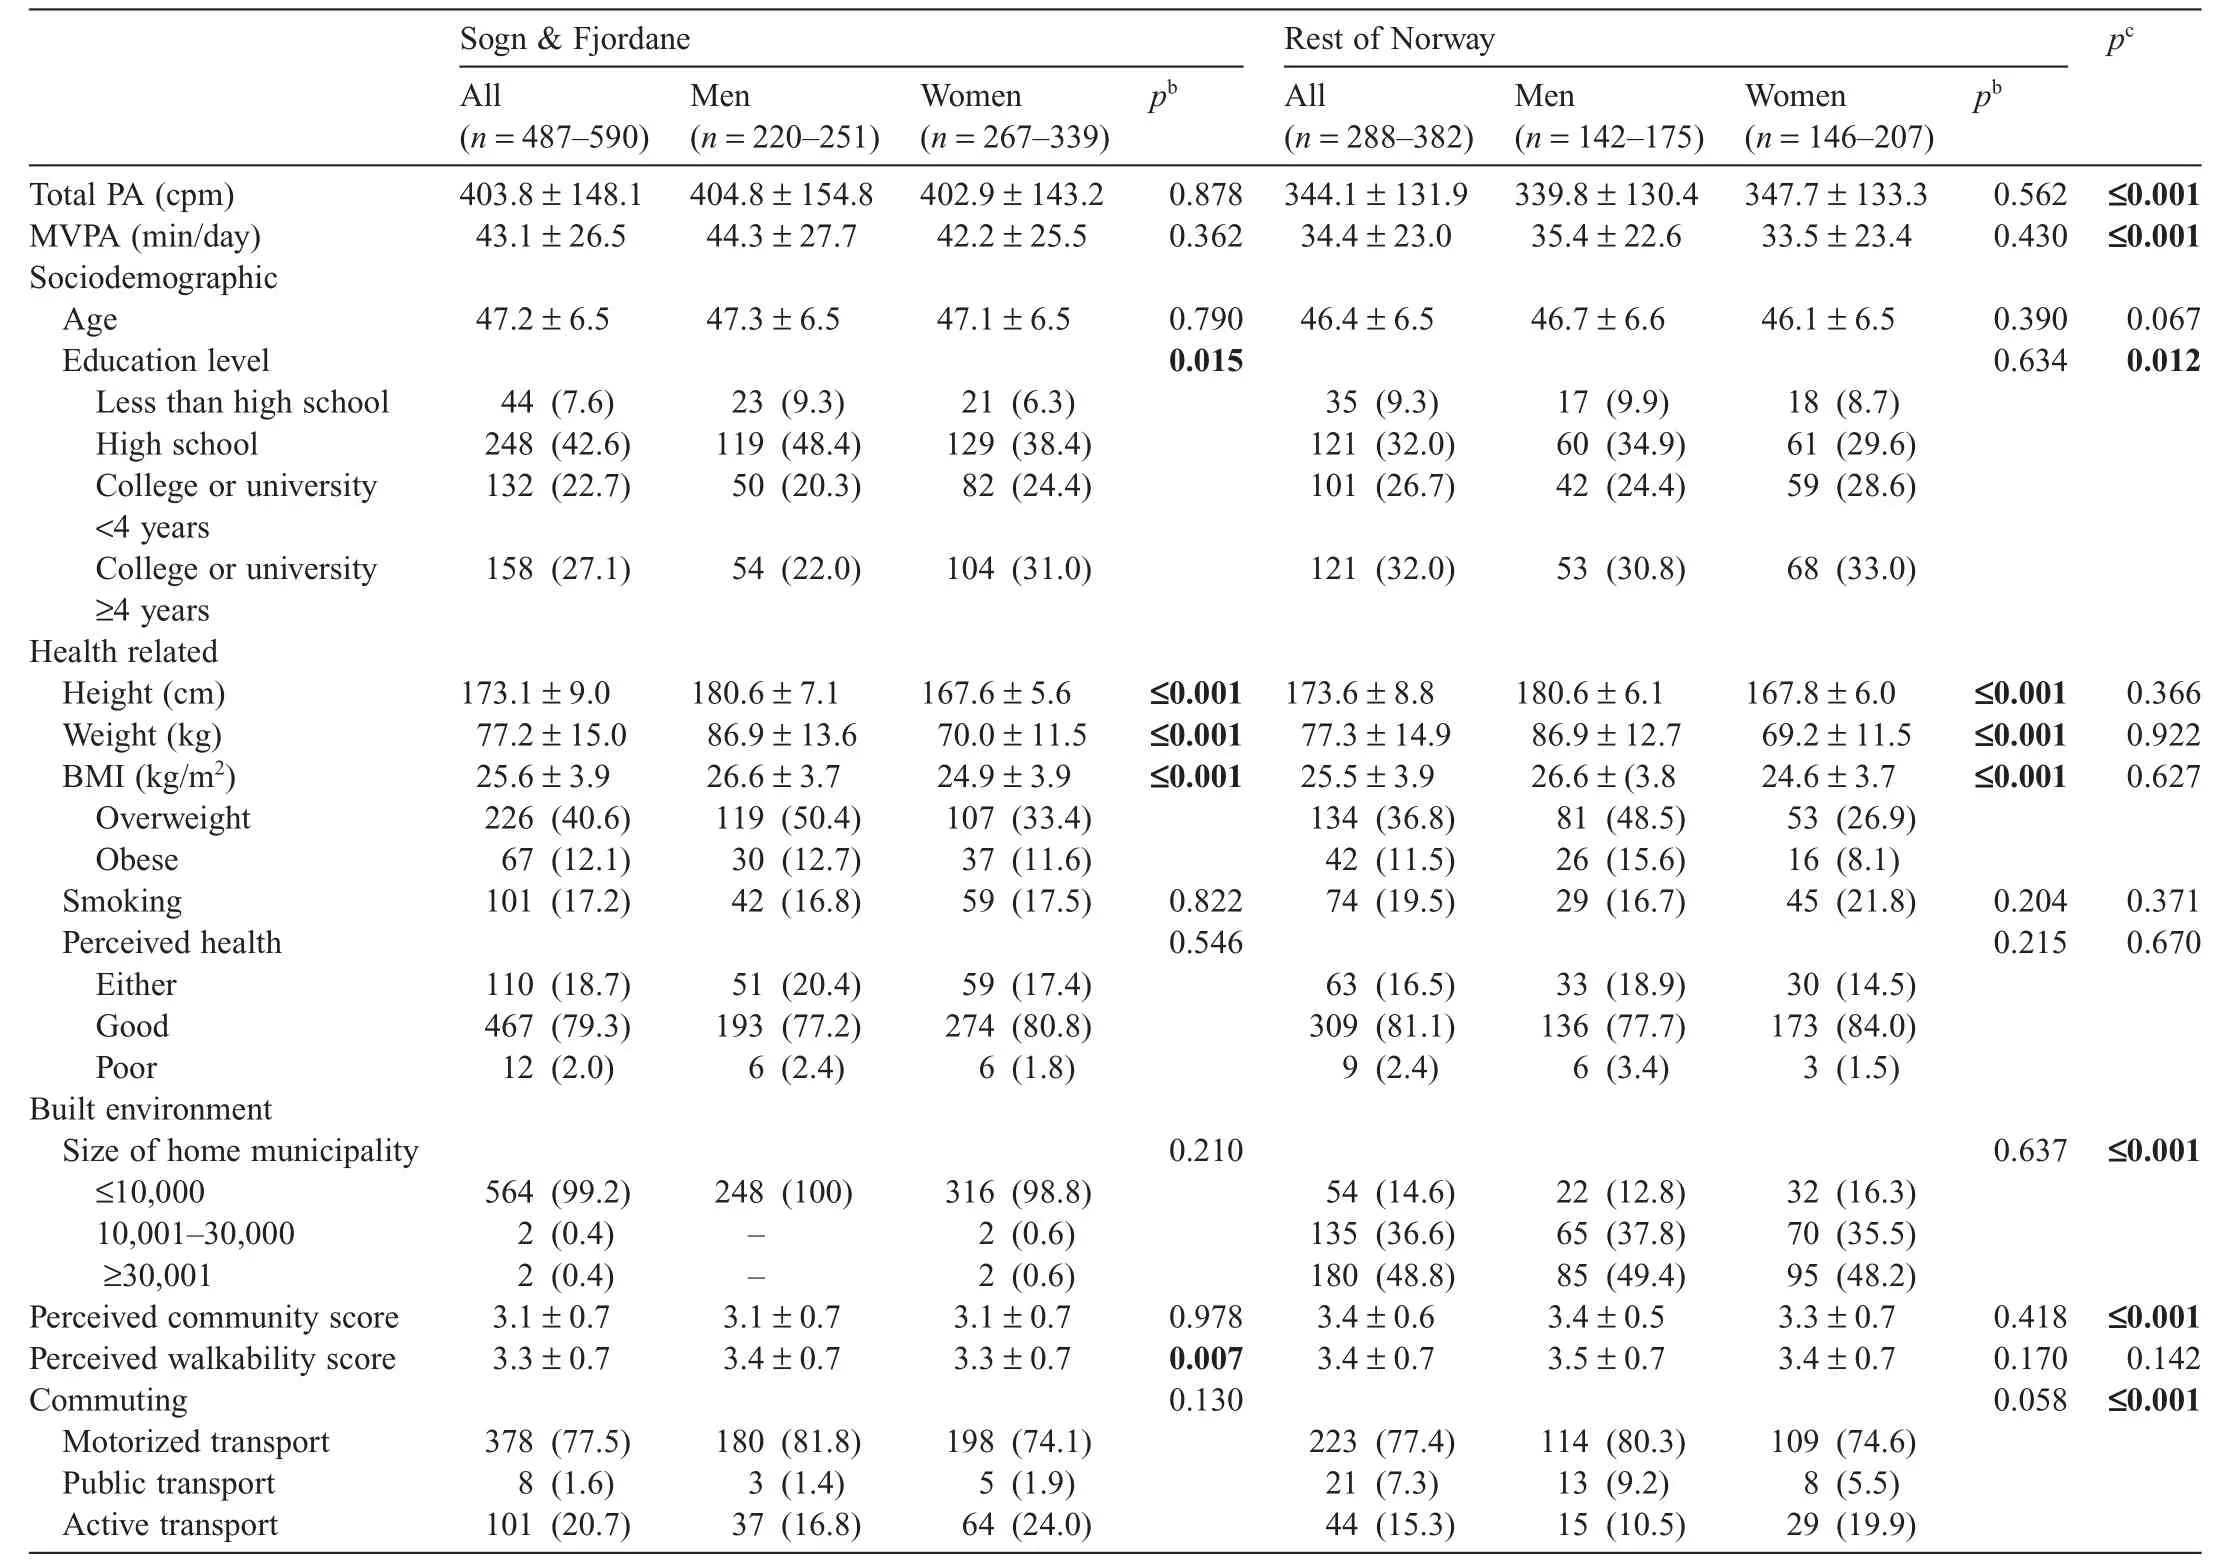
Table 1Characteristics of the participantsa(mean±SD or n(%)).
3.2.Built environment correlates of PA
We noted sex-specific associations for the community perception score(p≤0.001 for both total PA and MVPA outcomes)and perceived walkability(p≤0.001 for MVPA).Living in Sogn&Fjordane,the community perception score(for men only),the perceived walkability score(for MVPA for women only),and active transport for commuting were associated with total PA and MVPA(allp≤0.002)(Table 2).
Adjusted for sociodemographic and health-related factors,the built environment correlates included in the model accounted for 14.8%of the variance in total PA and 15.7%of the variance in time spent in MVPA(Table 2).Adding selfefficacy to the model did not change the associations noticeably(data not shown).
3.3.Geographic differences in the built environment correlates of PA
Geographic-area-specific associations were found for the community perception score(p=0.029 for total PA andp=0.045 for MVPA),and public transport for commuting(p=0.027 for MVPA).The community perception score was associated with total PA and MVPA in the rest of Norway(β=-24.75,95%CI:-42.84 to-6.67,p=0.007 for total PA;β=-4.07,95%CI:-7.24 to-0.90,p=0.012 for MVPA)but not in Sogn&Fjordane.Public transport for commuting was associated with MVPA in Sogn&Fjordane(β=12.16,95%CI:1.20 to 23.12,p=0.03 compared with motorized transportation)but not in the rest of Norway.
Investigating a set of built environment variables and their associations with PA established location of residence,the community perception score,the perceived walkability score,and active transport for commuting as correlates for PA.We providea visual representation of the associations between MVPA and the correlates for Sogn&Fjordane and the rest of Norway in Fig.1.An interaction with location of residence was observed for the community perception score(p=0.018)and commuting(p=0.035).The figures indicate that the participants in Sogn&Fjordane who reported the lowest third of the community perception scores had substantially higher MVPA levels compared with those who reported higher community perception scores and compared with the rest of Norway(Fig.1A).Although active transport was associated with higher MVPA compared with motorized transport for commuting for both locations of residence(Fig.1C),public transport was associated with the highest MVPA levels in the rest of Norway,whereas the opposite pattern was observed in Sogn&Fjordane.For the perceived walkability score(Fig.1B),the same pattern was observed for both locations of residence:MVPA increased with higher scores.However,the MVPA levels were higher in Sogn&Fjordane compared with the rest of Norway.The same patterns as for MVPA were observed for total PA(data not shown).
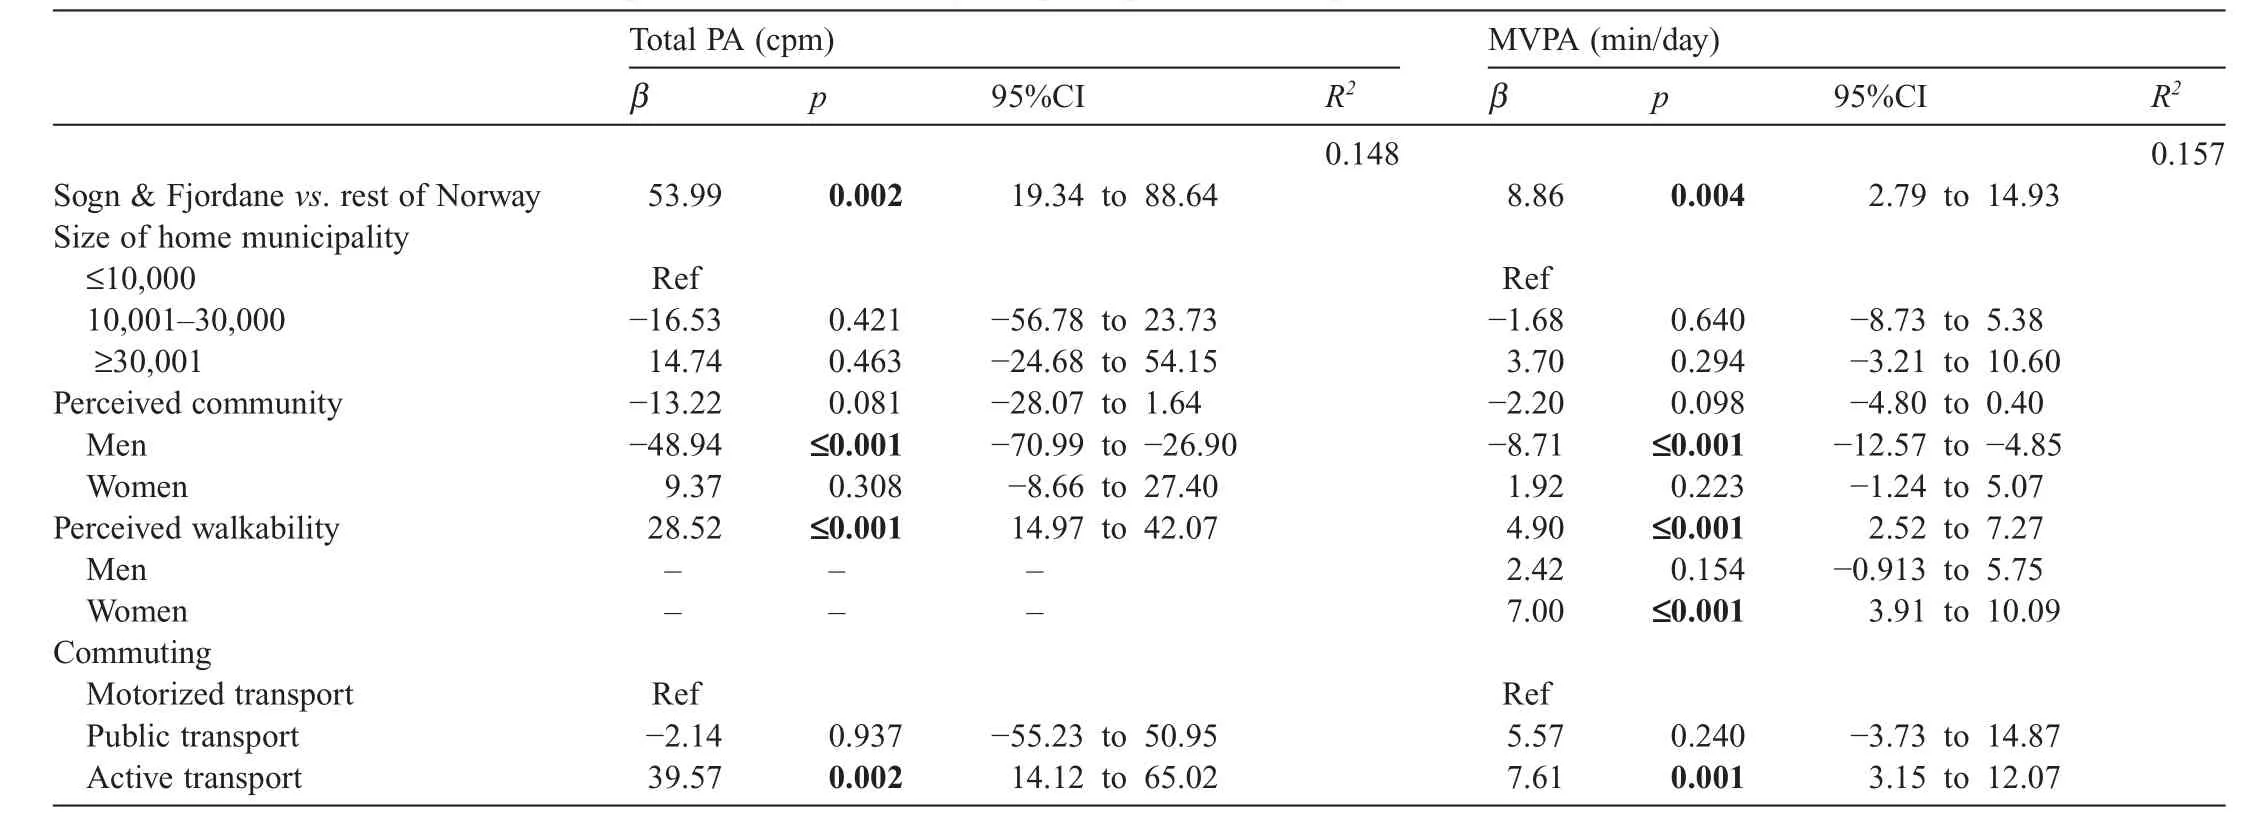
Table 2Built environment correlates of total PA(cpm)and MVPA(min/day)for participants with complete dataset(n=886).
4.Discussion
The results from this study suggest that total PA and time spent in MVPA are positively associated with living in Sogn&Fjordane,higher perceived walkability scores,and active transport for commuting.Higher community perception scores were negatively associated with PA among men but not women.Geographic differences in the PA correlates were observed;for instance,the community perception score was negatively associated with total PA and MVPA in the rest of Norway,where the majority of the sample lived in municipalities with more than 10,000 inhabitants.However,the association was not found in Sogn&Fjordane,a county where the population was more physically active and where most of the sample lived in municipalities with fewer than 10,000 inhabitants.MVPA was substantially higher among the participants in Sogn&Fjordane who reported the lowest third of the community perception scores compared with the rest of Norway.In contrast,public transport for commuting was positively associated with MVPA in Sogn&Fjordane but not in the rest of Norway.Compared with motorized and active transport for commuting,MVPA was highest for those who reported using public transport for commuting in the rest of Norway,whereas it was lowest in Sogn&Fjordane.
Although early findings suggest ambiguous associations between perceived environment and PA,5,29convincing evidence for a positive association between perceptions of the community and PA has been found in more recent European studies.3This is contrary to our observations,in that higher community perception scores were associated with lower amounts of PA for men in the rest of Norway.Hansen et al.27found no association between the same community perception measure and PA in a Norwegian population-based sample and argued that the reasonably high mean score was not able to discriminate sufficiently.Our mean scores are equally high,however,the narrow age range in our sample may explain the divergent results for part of the sample.The majority of our study population was employed,which could have influenced this association.Moreover,cultural aspects may have an impact.Throughout Norway,there is easy access to nature and recreation areas close to where people live,which could have encouraged PA.However,perhaps because the competing availability of activities led to sedentary behavior in the rest of Norway,a substantial proportion of the population did not appear to use these facilities.In contrast,however,the substantially higher MVPA levels observed in those who reported the lowest community perception scores in Sogn&Fjordane compared with those who reported higher scores and compared with the rest of Norway suggest that correlates other than perceptions of community may influence PA.For example,the population in Sogn&Fjordane may choose to be active,or need to be active(for transportation),despite their neighborhood surroundings.
Walkability has been suggested to be positively related to total PA and active transport.3A Swedish study30found that individuals who lived in highly walkable neighborhoods walked 50 min/week more for active transportation and had 3.1 min/day more MVPA compared with those who lived in less walkable neighborhoods.Our findings extend this work in that the people who reported higher perceived walkability had higher levels of PA in both Sogn&Fjordane and the rest of Norway.As expected,we found a positive association between active transport for commuting and PA.This emphasizes the importance of encouraging active transport within communities.The higher proportion of those who used active transport in Sogn&Fjordane compared with the rest of Norway is contrary to previous studies that found a positive association between degree of urbanization and biking for transportation.3However,although the population density is low and many people live scattered over a wide area in Sogn&Fjordane,many people live in small urban areas,which enables active transport.The association observed between public transport for commuting and MVPA in Sogn&Fjordane but not in the rest of Norway could possibly be explained by public transport patterns and availability.Compared with more urban areas,the public transport system in Sogn&Fjordane is poorly developed,which may explain why only 1.6%of the population used public transport for commuting.Furthermore,people who used public transport in Sogn&Fjordane were less physically active compared with those who used motorized transportation,whereas the opposite was observed in the rest of Norway.In Sogn&Fjordane,highly educated people may have to commute to other municipalities for work.Most likely owing to the poorly developed public transport system,these people used motorized transport.Considering the well-established association between education level and leisure time PA,2,31,32this may explain the difference in association between public transport and MVPAin Sogn&Fjordane and the rest of Norway.However,when interpreting these results,the small proportion of participants who reported using public transport should be considered.
Even though we cannot categorize Sogn&Fjordane as rural and the rest of Norway as urban,location of residence as a correlate for PA may be supported by studies suggesting that people living in less urbanized areas in Europe tend to be more physically active.3In addition,the presence of hills in a neighborhood and enjoyable scenery have been found to be associated with more activity,33although a possible negative association has been suggested for biking for transport and hilliness.3Community environment,walkability,and degree of urbanization have all been suggested as being related to PA;however,they have all been shown to be unrelated to recreational PA.3The county of Sogn&Fjordane has higher levels of PA but lower environmental scores compared with the rest of Norway.Except for the fact that a higher proportion of the population in Sogn&Fjordane used active transport for commuting,we do not know if there were any significant differences in the types of PA they engaged in.However,there are most likely other explanations for the significantly higher PA levels in Sogn&Fjordane that we did not discover.
Our findings confirm previous suggestions that the built environment has a modest yet significant association with PA.1-4However,the contribution of these potential changes to community participation may be great because favorable modifications to community settings may produce small changes in the behaviors of entire populations.Therefore,identifying environments that produce positive changes in PA are important.
Strengths of our study include the use of a large,nationwide,population-based sample within a narrow age range.Additionally,the objective assessment of PA provides more detailed information of total PA and time spent in MVPA and is less prone to bias from misreporting or social desirability compared with self-reported PA.34,35
However,a number of limitations need to be taken into account when interpreting the results.First,with the crosssectional design,we cannot state any causal relationships based on our data.Furthermore,the response rate might be considered low,which increases the risk for selection bias.36However,analyses of the nonresponses for part of the sample found prevalence rates of overweight or obese and other noncommunicable diseases similar to other national estimates.27Therefore,we believe that the results of this study have a general validity that corresponds to the results from similar studies.The correlates included in our models explained a small proportion of the variance in total PA(14.8%)and MVPA(15.7%).Self-reported exposure variables may be prone to measurement errors,which may attenuate any observed associations.37People’s perceptions of their environments may be more influenced by their behavior than their actual or objective environments.5,38For walkability,an objective Walk Score39can be obtained online;however,the scores are not yet supported in Norway(Jacobson,A.,Walk Score,personal e-mail communication).Self-reported measures of the built environment customized to Norwegian conditions and culture are also scarce.Because inter-continental differences in the relationship between physical environment and PA have been identified,3the use of scales that were adapted for other countries and continents may have biased our data.For example,questions about traffic lights and safety may be irrelevant for parts of the population,whereas more questions about access to mountain and recreational areas would have been appropriate.Therefore,validated subjective and objective measures of Norwegian built environments are needed in future research.Finally,limitations associated with measuring PA by accelerometry should be acknowledged.For example,accelerometry has known limitations in assessing PA during specific types of activities,and data reduction challenges do exist.40
5.Conclusion
Total PA and MVPA levels were partly associated with built environment factors such as location of residence,perceptions of community,walkability,and active transport.Geographic differences in the PA correlates were observed for community perception and public transport,and thus,locally customized environmental population approaches aimed at increasing PA levels may be essential complements to individual behavior and lifestyle strategies.
The authors would like to thank the test personnel at the 10 institutions involved in the study for their work during the data collection:Finnmark University College,Hedmark University College,NTNU Social Research AS,University of Agder,University of Nordland,University of Stavanger,Telemark University College,Vestfold University College,Sogn&Fjordane University College,and Norwegian School of Sport Sciences.This work was supported by the Sogn&Fjordane County Council,Sparebanken Vest-Visjon Vest,the Norwegian Directorate of Health,Norwegian School of Sport Sciences,and Sogn&Fjordane University College.
Authors’contributions
AKS participated in the design of the study,drafted the manuscript,and performed the statistical analysis and data interpretation;SAA was the lead investigator,participated in the design of the study,and contributed to the statistical analysis;IMH,EK,and BHH participated in the design of the study and contributed to the statistical analysis;MCA was the senior author,participated in the design of the study,and contributed to the statistical analysis.All authors have read and approved the final version of the manuscript,and agreed with the order of presentation of the authors.
Competing interests
The authors declare that they have no competing interests.
1.Heath GW,Parra DC,Sarmiento OL,Andersen LB,Owen N,Goenka S,et al.Evidence-based intervention in physical activity:lessons from around the world.The Lancet2012;380:272-81.
2.Bauman AE,Reis RS,Sallis JF,Wells JC,Loos RJ,Martin BW,et al.Correlates of physical activity:why are some people physically active and others not?The Lancet2012;380:258-71.
3.Van Holle V,Deforche B,Van Cauwenberg J,Goubert L,Maes L,Van de Wegh N,et al.Relationship between the physical environment and different domains of physical activity in European adults:a systematic review.BMC Public Health2012;12:807.doi:10.1186/1471-2458-12-807
4.Hanson HM,Ashe MC,McKay HA,Winters M.Intersection between the built and social environments and older adults’mobility:an evidence review.National Collaborating Centre for Environmental Health;2012.
5.Wendel-Vos W,Droomers M,Kremers S,Brug J,van Lenthe F.Potential environmental determinants of physical activity in adults:a systematic review.Obes Rev2007;8:425-40.
6.Saelens BE,Handy SL.Built environment correlates of walking:a review.Med Sci Sports Exerc2008;40(7 Suppl.):S550-66.
7.Sallis JF,Cerin E,Conway TL,Adams MA,Frank LD,Pratt M,et al.Physical activity in relation to urban environments in 14 cities worldwide:a cross-sectional study.The Lancet2016;387:2207-17.
8.Lee IM,Shiroma EJ,Lobelo F,Puska P,Blair SN,Katzmarzyk PT.Effect of physical inactivity on major non-communicable diseases worldwide:an analysis of burden of disease and life expectancy.The Lancet2012;380:219-29.
9.Haskell WL,Lee IM,Pate RR,Powell KE,Blair SN,Franklin BA,et al.Physical activity and public health:updated recommendation for adults from the American College of Sports Medicine and the American Heart Association.Circulation2007;116:1081-93.
10.Warburton DE,Charlesworth S,Ivey A,Nettlefold L,Bredin SS.A systematic review of the evidence for Canada’s Physical Activity Guidelines for Adults.Int J Behav Nutr Phys Act2010;7:39.doi:10.1186/1479-5868-7-39
11.Tremblay MS,Aubert S,Barnes JD,Saunders TJ,Carson V,Latimer-Cheung AE,et al.Sedentary Behavior Research Network(SBRN)—terminology consensus project process and outcome.Int J Behav Nutr Phys Act2017;14:75.doi:10.1186/s12966-017-0525-8
12.Hansen BH,Kolle E,Dyrstad SM,Holme I,Anderssen SA.Accelerometer-determined physical activity in adults and older people.Med Sci Sports Exerc2012;44:266-72.
13.Hagstromer M,Troiano RP,Sjostrom M,Berrigan D.Levels and patterns of objectively assessed physical activity—a comparison between Sweden and the United States.Am J Epidemiol2010;171:1055-64.
14.Baptista F,Santos DA,Silva AM,Mota J,Santos R,Vale S,et al.Prevalence of the Portuguese population attaining sufficient physical activity.Med Sci Sports Exerc2012;44:466-73.
15.Hallal PC,Andersen LB,Bull FC,Guthold R,Haskell W,Ekelund U,et al.Global physical activity levels:surveillance progress,pitfalls,and prospects.The Lancet2012;380:247-57.
16.Helsedirektoratet.Physical activity and sedate time among adults and elderly in Norway—National surveying 2014-2015.(Fysisk aktivitet og sedat tid blant voksne og eldre i Norge—Nasjonal kartlegging 2014-2015).Oslo:Helsedirektoratet;2015.[in Norwegian].
17.Bjartveit K,Foss OP,Gjervig T,Lund-Larsen PG.The cardiovascular disease study in Norwegian counties.Background and organization.Acta Med Scand Suppl1979;634:1-70.
18.Solbraa AK,Mamen A,Resaland GK,Steene-Johannessen J,Ylvisåker E,Holme IM,et al.Level of physical activity,cardiorespiratory fitness and cardiovascular disease risk factors in a rural adult population in Sogn&Fjordane.Nor J Epidemiol2011;20:179-88.
19.Graff-Iversen S,Selmer R,Sørensen M,Skurtveit S.Occupational physical activity,overweight,and mortality:a follow-up study of 47,405 Norwegian women and men.Res Q Exerc Sport2007;78:151-61.
20.Norwegian Institute of Public Health.PublicHealthPro file(Folkehelsebarometeret).Available at:http://khp.fhi.no/;2013[accessed 04.01.2013].[in Norwegian].
21.Wøien G,Øyen O,Graff-Iversen S.22 years of cardiovascular surveys in Norwegian counties.Is the development in risk factors satisfactory?(22 år med hjerte-og karundersøkelser i norske fylker:Bør vi være tilfreds med den utviklingen risikofaktorene har hatt?)Nor J Epidemiol1997;7:255-66.[in Norwegian].
22.Sogn&Fjordane County Council.County statistics(Fylkesspegelen).Available at:https://statistikk.fylkesatlas.no/;2017[accessed 08.08.2017].[in Norwegian].
23.Gorman E,Hanson H,Yang P,Khan K,Liu-Ambrose T,Ashe M.Accelerometry analysis of physical activity and sedentary behavior in older adults:a systematic review and data analysis.Eur Rev Aging Phys Act2013;11:1-15.
24.Troiano RP,Berrigan D,Dodd KW,Masse LC,Tilert T,McDowell M.Physical activity in the United States measured by accelerometer.Med Sci Sports Exerc2008;40:181-8.
25.Brownson RC,Baker EA,Housemann RA,Brennan LK,Bacak SJ.Environmental and policy determinants of physical activity in the United States.Am J Public Health2001;91:1995-2003.
26.Stokols D,Allen J,Bellingham RL.The social ecology of health promotion:implications for research and practice.Am J Health Promot1996;10:247-51.
27.Hansen BH,Ommundsen Y,Holme I,Kolle E,Anderssen SA.Correlates of objectively measured physical activity in adults and older people:a cross-sectional study of population-based sample of adults and older people living in Norway.Int J Public Health2014;59:221-30.
28.Fuchs R,Schwarzer R.Self-efficacy towards physical exercise:reliability and validity of a new instrument(Selbstwirksamkeit zur sportlichen Aktivität:reliabilität und Validität eines neuen Messinstruments).Zeitschrift für Differentielle und Diagnostische Psychologie1994;15:141-54.[in Norwegian].
29.Duncan MJ,Spence JC,Mummery WK.Perceived environment and physicalactivity:a meta-analysis of selected environmental characteristics.Int J Behav Nutr Phys Act2005;2:11.doi:10.1186/1479-5868-2-11
30.Sundquist K,Eriksson U,Kawakami N,Skog L,Ohlsson H,Arvidsson D.Neighborhood walkability,physical activity,and walking behavior:the Swedish Neighborhood and Physical Activity(SNAP)study.Soc Sci Med2011;72:1266-73.
31.Trost SG,Owen N,Bauman AE,Sallis JF,Brown W.Correlates of adults’participation in physical activity:review and update.Med Sci Sports Exerc2002;34:1996-2001.
32.Hamer M,Kivimaki M,Steptoe A.Longitudinal patterns in physical activity and sedentary behaviour from mid-life to early old age:a substudy of the Whitehall II cohort.J Epidemiol Community Health2012;66:1110-5.
33.King AC,Castro C,Wilcox S,Eyler AA,Sallis JF,Brownson RC.Personal and environmental factors associated with physical inactivity among different racial-ethnic groups of U.S.middle-aged and older-aged women.Health Psychol2000;19:354-64.
34.Warren JM,Ekelund U,Besson H,Mezzani A,Geladas N,Vanhees L.Assessment of physical activity—a review of methodologies with reference to epidemiological research:a report of the exercise physiology section of the European Association of Cardiovascular Prevention and Rehabilitation.Eur J Cardiovasc Prev Rehabil2010;17:127-39.
35.Dyrstad SM,Hansen BH,Holme IM,Anderssen SA.Comparison of self-reported versus accelerometer-measured physical activity.Med Sci Sports Exerc2014;46:99-106.
36.Søgaard AJ,Selmer R,Bjertness E,Thelle D.The Oslo Health Study:the impact of self-selection in a large,population-based survey.Int J Equity Health2004;3:3.doi:10.1186/1475-9276-3-3
37.Hutcheon JA,Chiolero A,Hanley JA.Random measurement error and regression dilution bias.BMJ2010;340:c2289.doi:10.1136/bmj.c2289
38.Gebel K,Bauman A,Owen N.Correlates of non-concordance between perceived and objective measures of walkability.Ann Behav Med2009;37:228-38.
39.Walk Score®.Walkability,real estate,and public health data.Available at:http://www.walkscore.com/professional/research.php;2014[accessed 18.03.2014].
40.Matthews CE,Hagstromer M,Pober DM,Bowles HR.Best practices for using physical activity monitors in population-based research.Med Sci Sports Exerc2012;44(1 Suppl.1):S68-76.
 Journal of Sport and Health Science2018年1期
- Journal of Sport and Health Science的其它文章
- Research highlights from the Status report for step it up!The surgeon general’s call to action to promote walking and walkable communities
- Environments favorable to healthy lifestyles:A systematic review of initiatives in Canada
- The association of various social capital indicators and physical activity participation among Turkish adolescents
- Feasibility of using pedometers in a state-based surveillance system:2014 Arizona Behavioral Risk Factor Surveillance System
- Matched or nonmatched interventions based on the transtheoretical model to promote physical activity.A meta-analysis of randomized controlled trials
- Collegiate athletes’mental health services utilization:A systematic review of conceptualizations,operationalizations,facilitators,and barriers