
Liquid-Liquid Equilibrium for Extraction of Benzene from 1-Hexene Using Two Different Solvents
2018-04-24 06:09YanLiSongyuanXinKunLinyun
中国炼油与石油化工 2018年1期
Lü Yan; Li Songyuan; Xin Kun; Lin yun
(1. The State Key Lab of Chemical Engineering, College of Chemical Engineering, East China University of Science and Technology, Shanghai 200237; 2. Department of Chemical Engineering and Chemistry, Eindhoven University of Technology, De Zaale, Eindhoven, the Netherlands)
1 Introduction
Aromatic hydrocarbons are of great importance as industrial raw materials, the demand for which is ever increasing in recent years. In petrochemical industry, the fluid catalytic cracking (FCC) unit is still a main unit to transform heavy oil fractions into gases, gasoline or diesel.However, the light cycle oil (LCO) obtained from FCC unit contains nearly 80% of aromatics including 20% of monoaromatics[1]but has a low cetane number. Hydrogenation process are always necessary to convert aromatics to naphthenes before blending it into the diesel pool.Nevertheless, to improve the property of diesel fuel, high pressure and high temperature are needed which increase the energy consumption[2].
On the other hand, extraction process is widely used at re fineries to separate aromatics, such as the extraction process adopted for separating benzene and toluene from the reformate. However, the traditional solvents used in the extraction process has some limitations, because sulpholane[3]is only suitable if the content of aromatic components are more than 20%, and 1-cyclohexyl-2-pyrrolidone[11]has a high capacity but low selectivity for aromatics.
Dimethyl sulfoxide (DMSO) is considered to be superior in extracting aromatics from olefins owing to its high solubility and selectivity of olefins, low extraction temperature, less equipment corrosion and low toxicity.It would be desirable to separate aromatics from LCO by extraction in an attempt to bypass the hydrogenation process. Besides, furfural is a selective solvent for separating the saturated compounds from unsaturated compounds used in refining gas, reformate, and diesel fractions[4],featuring high selectivity towards aromatic compounds[5].Thus, DMSO and furfural come into our consideration to serve as alternative extractants for obtaining aromatics from ole fins.
To sum up, the experimental liquid-liquid equilibrium data were determined under 101.3 kPa for three systems, including the 1-hexene+benzene+DMSO system operating at 298.15 K and 318.15 K, and the 1-hexene+benzene+furfural system operating at 298.15 K. The separation ef ficiency was evaluated by two factors, namely the distribution coef ficient (K) and the separation factor(S). The Non-Random Two Liquids (NRTL)[6]and the Universal Quasi-Chemical (UNIQUAC)[7]activity coef ficient models were used to correlate the experimental data.To the best of our knowledge, the ternary LLE data of 1-hexene+ benzene+ DMSO/furfural systems were rarely reported up to now.
2 Experimental
2.1 Chemicals
The detailed information of reagents used in this work are shown in Table 1. Benzene and dimethyl sulfoxide were purchased from MACLIN (Shanghai, China), while 1-hexene and furfural were provided by ALADDIN(Shanghai, China). Gas chromatography (GC) was employed to con firm the purity of all chemicals and no peaks of impurity were detected. No further purification of these chemical reagents was adopted as well.
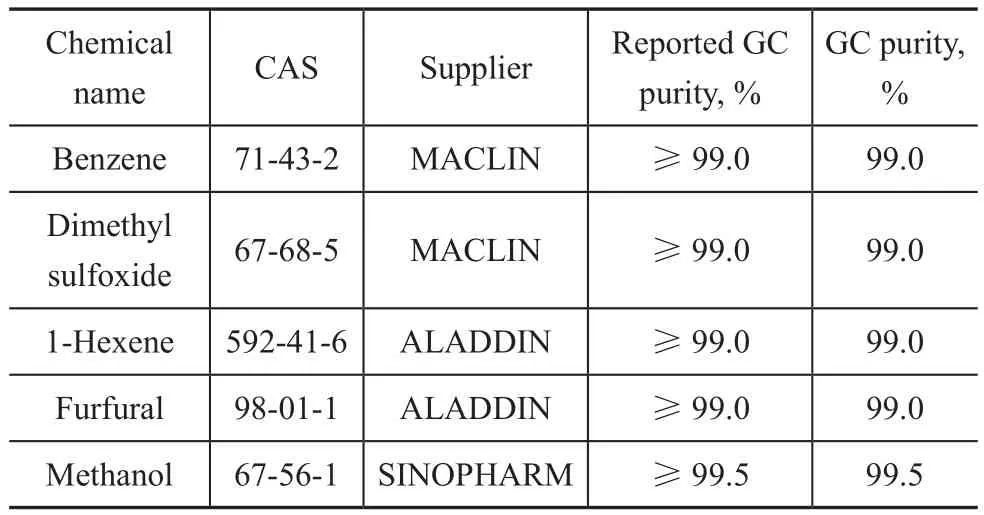
Table 1 Details of chemical reagents used in this work
2.2 Experimental setup and methods
The LLE measurements for ternary systems {1-hexene+benzene+DMSO}, and {1-hexnen+ benzene+ furfural} were carried out at T = 298.15 K and 318.15 K and at p = 101.3 kPa. To establish the phase equilibrium, a 100 mL glass equilibrium still was employed, which had been presented in the previous work and its reliability had been proven[10].A magnetic stirrer and a circulating water bath were used.The mixtures were well stirred for at least 1 h prior to being subject to settling for at least 3 h. The settling time had been investigated, showing that 3 h were suf ficient for the ternary mixture to reach the phase equilibrium.
The mixture was separated into two clear phases after the equilibrium was established, viz.: a 1-hexene rich phase in the upper layer, and a solvent rich phase in the lower layer. The liquid samples from both phases were carefully withdrawn by syringes, respectively, and were detected by gas chromatograph (SHIMADZU GC2014) equipped with a capillary column Rxi-5ms (0.32 mm × 30 m) and a flame ionization detector. The carrier gas consisting of helium was introduced at a rate of 89.1 mL/min. The injector temperature was set at 503.15 K, and the detector temperature was set at 513.15 K. During a GC analysis, the column temperature at first was maintained at 323.15 K for 1.75 min, and then raised to 423.15 K at a temperature increase rate of 30 K/min. The sampling analysis was repeated for at least 3 times, and the mean value was used in this work. The internal standard method was used and methanol was chosen as the internal standard in order to obtain quantitative results during analysis. The feed composition was varied at different desired temperature to obtain a series of LLE data.
2.3 Uncertainty calculation
BIPM[8]had introduced two categories of uncertainty calculation: “A” and “B”. To assess the uncertainty of each quantity q, Type A had been chosen in this work, with the corresponding equations listed below:
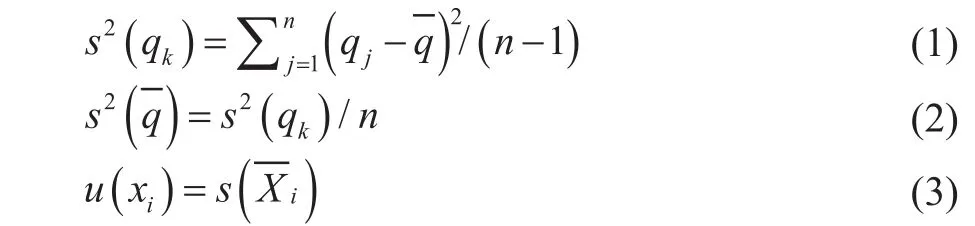
The experimental standard deviation (s(qk)), which explains the dispersion of the observed values qkto their meancan be calculated from Equation 1. For a quantity Xi, the estimate xi=and the standard uncertainty u(Xi) =
2.4 Separation ef ficiency calculation
The distribution coef ficient (K) and the separation factor(S), which are calculated from the tie-line data, can describe the separation ef ficiency of solvents[10]. They are de fined as follows:
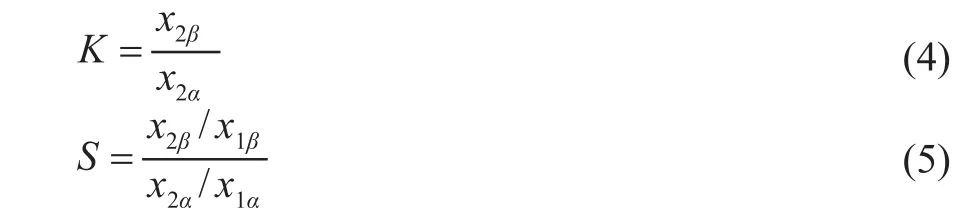
where, α and β represent the 1-hexene rich phase and the solvent rich phase, respectively, while 1 and 2 denote the diluent (1-hexene in this research) and the solute (benzene in this research), respectively.
2.5 Reliability of the data
The Othmer-Tobias equation[12](Equation 6) and the Bachman equation[13](Equation 7) are used to evaluate the reliability of LLE tie-line data in this paper. The equations are listed below:
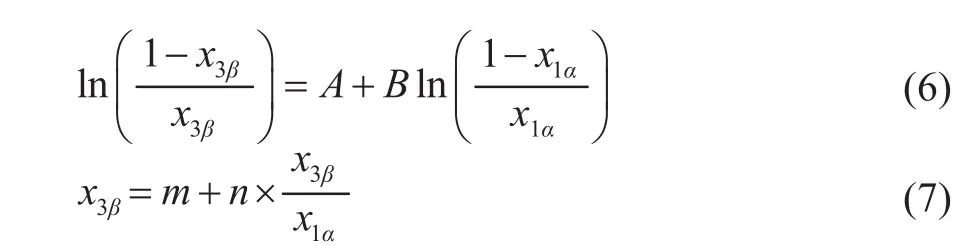
where A and B, m and n are the parameters of Othmer-Tobias equation and Bachman equation, respectively, and they can be determined by using the linear least-square method. Hence x1αis the mass fraction of 1-hexene in the 1-hexene rich phase, and x3βis the mass fraction of solvent in the solvent rich phase. The correlation factors R2reflects the reliability and consistency of the related experimental data.
3 Results and Discussion
3.1 Experimental data
The LLE data of the ternary systems {1-hexene+benzene+DMSO} at T = 298.15 K and 318.15 K, and {1-hexnen+benzene+furfural} at T = 298.15 K are listed in Table 2 with all concentrations expressed in mass fraction. The bimodal curves of these three ternary mixtures together with their feed compositions are presented in Figure 1-3.As shown in these graphs, the feed points agreed with the tie lines perfectly, indicating that in the process of experiment, the mass balance had been satis fied and the experimental data were reliable. Meanwhile, the parameters of the Othmer-Tobias and the Bachman equations are reported in Table 3. The linear correlation indicates a good satisfactory quality of the experimental data.

Figure 1 Ternary phase diagram for 1-hexene+benzene+DMSO system at 298.15 K
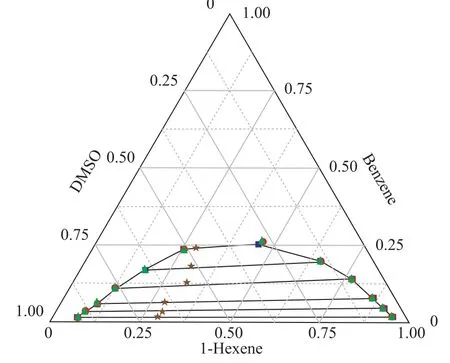
Figure 2 Ternary phase diagram for 1-hexene+benzene+DMSO system at 318.15 K
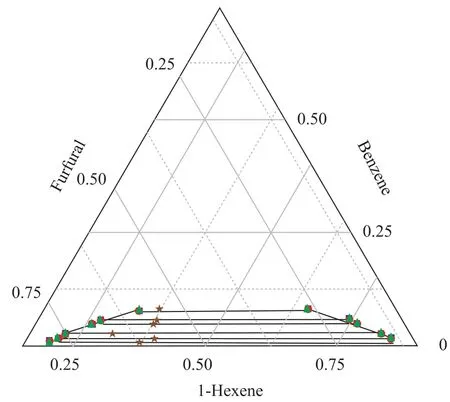
Figure 3 Ternary phase diagram for 1-hexene+benzene+furfural system at 298.15 K
The ternary LLE of the {1-hexene + benzene + solvents}systems behave as Type 1 according to Sørensen[9], which means that the mixtures consist of two miscible systems{1-hexene + benzene} and {benzene + solvents}, and one immiscible/partially miscible system {1-hexene +DMSO/furfural}. As shown in Figures 1 and 2, when the temperature increased from 298.15 K to 318.15 K, the bimodal curve of {1-hexene+benzene+DMSO} system moved to the chart axes, which means that the biphasic area decreased. The same phenomenon occurred extremely noticeable in the furfural solvent system: when the tem-perature increased to 318.15 K, the biphasic area shrank to disappear.
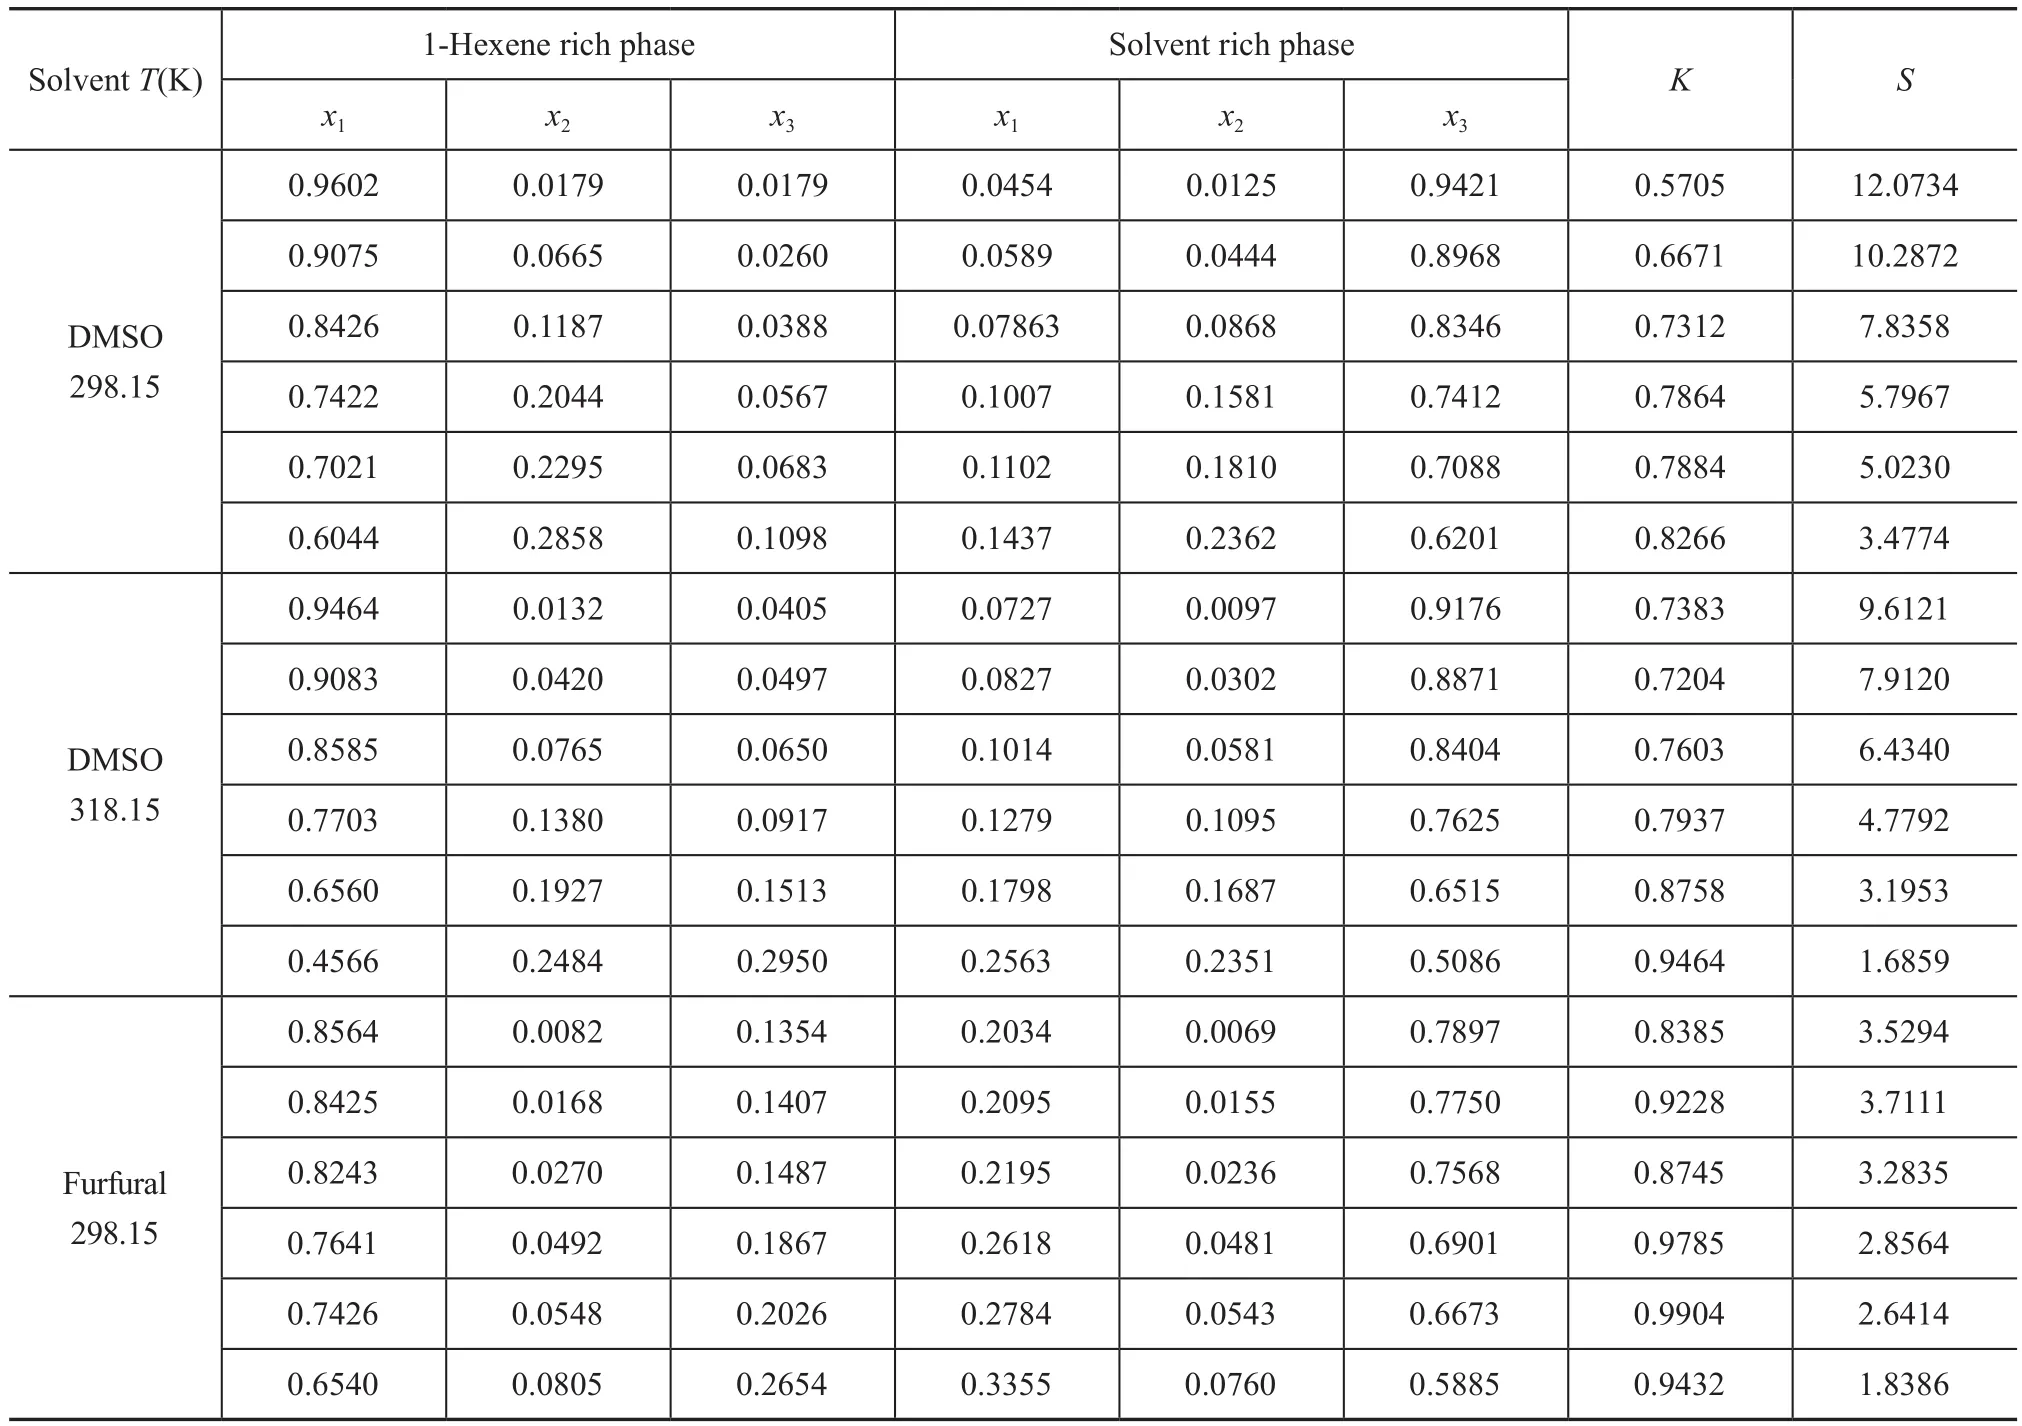
Table 2 Experimental LLE data (mass fraction) for 1-hexene (1) + benzene (2) + solvent (3) system at 298.15 K and 318.15 K and atmosphere pressure
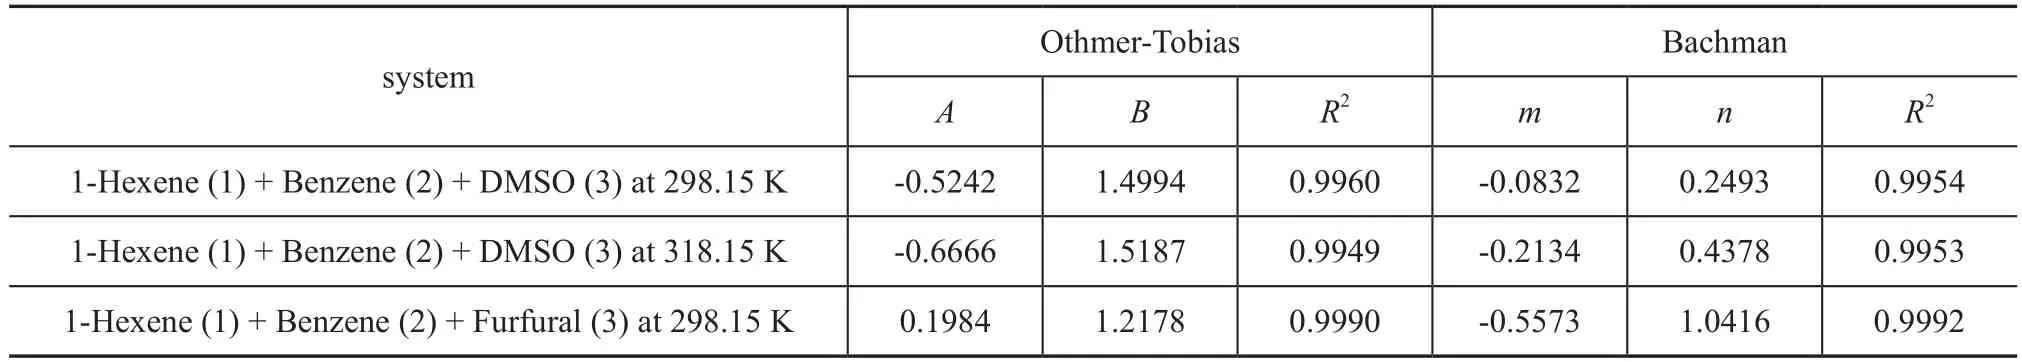
Table 3 Parameters of the Othmer-Tobias and the Bachman equations for 1-hexene (1) + benzene (2) + solvent (3) system at desired temperature
The K and S values calculated from the LLE data are listed in Tables 2. The S values decreased generally as the concentration of benzene increased. This is because when the concentration of benzene increased, the two-phase region shrank, denoting that the separation capacity of solvent was reduced. However, the S value was not perfectly in an inverse proportion of benzene concentration.There was a variation of S values as the benzene concentration increased from 0.0069 to 0.0155 (mass fraction)when furfural was used as the solvent, and a relatively high mutual solubility of furfural and 1-hexene might be the cause. The experimental separation factors versus the mass fraction of benzene in the solvent rich phase at different temperatures are demonstrated in Figure 4.Obviously, DMSO had a preferential extraction ability,bacause the S values of DMSO were greater than those of furfural. Moreover, the extraction process was possible,since the S values in all cases were more than one.
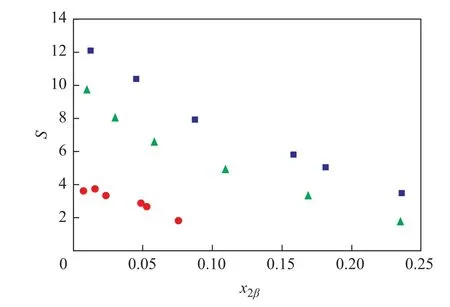
Figure 4 Experimental separation factor (S) versus the benzene mass fraction (x2β) in the solvent rich phase for the ternary system: 1-hexene (1) + benzene (2) +solvent (3)
The distribution coef ficient is relevant to the solubility of solutes, which has an impact on the slope of tie lines[10].Generally, K values in this work were on the rise with an increasing concentration of benzene and the changing trend of the slope factors of tie lines showed the same tendency. However, upon adopting the similar concentration of benzene, a higher value of K was achieved when furfural was used as the solvent, which meant that furfural had a better separation capability than DMSO. This is because furfural has a relatively high solubility with 1-hexene than DMSO. But for the ternary LLE systems, the greater the size of the two-phase region, the larger the final concentration of benzene would be. To sum up, DMSO was more suitable than furfural for extracting benzene from 1-hexene.
4.2 Data correlation
In this work, the LLE data of {1-hexene + benzene + solvents} systems were correlated by NRTL and UNIQUAC models, with the data regression results presented in Table 4. The calculated LLE data from both models are plotted in Figures 1-3. In general, all the RMSD values were less than 1.0%, denoting that both models fit in with the experimental data quite well.
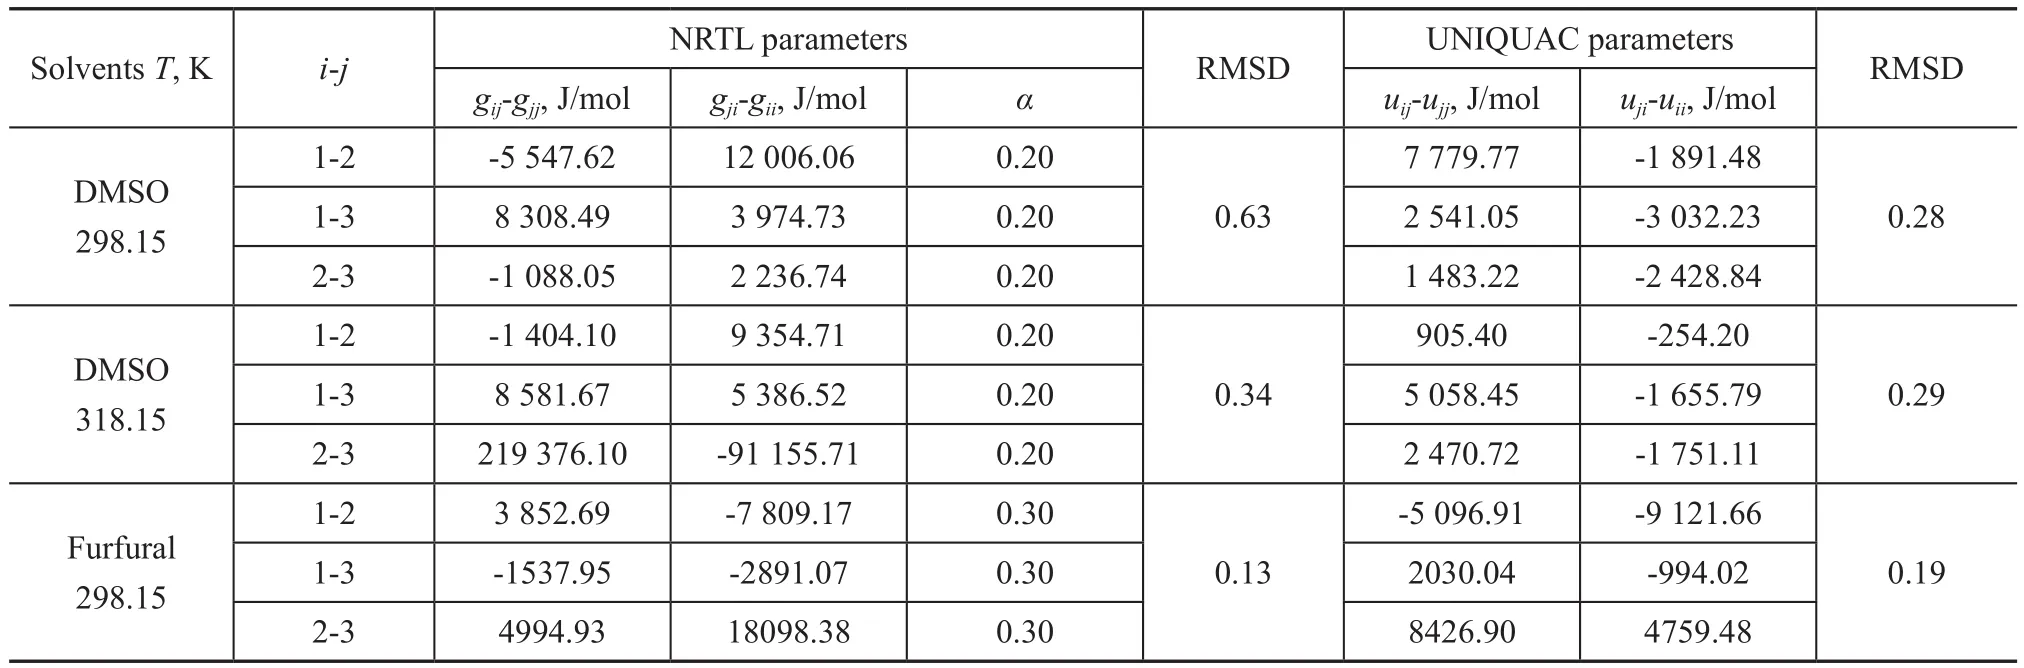
Table 4 Binary energy parameters of NRTL and UNIQUAC models for the system 1-hexene (1) + benzene (2) + solvents (3)
5 Conclusions
The LLE systems {1-hexene+benzene+DMSO} at 298.15 K and 318.15 K, together with {1-hexene+benzene+furfural} at 298.15 K under a pressure 101.3 kPa were investigated in this paper. Results indicated that benzene had a relatively high solubility in DMSO or furfural than in 1-hexene. It should be noted that all of the separation factors were greater than one, implying that it was feasible to extract benzene from 1-hexene by DMSO or furfural. Moreover, whith an rising benzene concentration, the distribution coef ficients tended to increase, yet the separation factors tended to decrease. To
sum up, owning to a low mutual solubility with 1-hexene, coupled with large separation factors, and larger two-phase region, DMSO was more ideal for benzene separation. Furthermore, both the Othmer-Tobias equation and the Bachman equation con firmed the reliability of the obtained experimental tie-line data. According to correlation outcome for the NRTL and the UNIQUAC models, all the experimental data were successfully correlated, and the corresponding optimum interaction parameters of both models were also obtained.
Acknowledgement:The authors are graceful to the financial supports provided by the National Natural Science Foundation of China (No.21177038).
[1] Mao Anguo, Gong Jianhong. Molecular-based study on FCC LCO to light aromatics [J]. Petroleum Processing and Petrochemicals, 2014, 45(7): 1–5 (in Chinese)
[2] Đukanović Z, Sandra B G, Vesna J Č, et al. Hydrotreating of straight-run gas oil blended with FCC naphtha and light cycle oil[J]. Fuel Processing Technology, 2013, 106(2): 160–165
[3] Bahadur I, Singh P, Kumar S, et al. Separation of aromatic solvents from the reformate fraction of an oil refining process using extraction by a designed ionic liquid [J].Separation Science & Technology, 2014, 49(12): 1883–1888
[4] Sangarunlert W, Piumsomboon P, Ngamprasertsith S.Furfural production by acid hydrolysis and supercritical carbon dioxide extraction from rice husk [J]. Korean Journal of Chemical Engineering, 2007, 24(6): 936–941
[5] Antonio D L, Rodríguez L, Sánchez P, et al. Extraction of aromatic compounds from heavy neutral distillate lubricating oils by using furfural [J]. Separation Science and Technology, 1993, 28(15/16): 2465–2477
[6] Renon H, and Prausnitz J M. Local compositions in thermodynamic excess functions for liquid mixtures [J].AIChE Journal, 1968, 14(1): 135–144
[7] Abrams D S, Prausnitz J M. Statistical thermodynamics of liquid mixtures: A new expression for the excess Gibbs energy of partly or completely miscible systems [J]. AIChE Journal, 1975, 21(1): 116–128
[8] BIPM, IFCC, IUPAC, et al. Evaluation of measurement data—guide for the expression of uncertainty in measurement: JCGM 100: 2008 [S]
[9] Sørensen J M, Magnussen T, Rasmussen, P, et al. Liquidliquid equilibrium data: Their retrieval, correlation and prediction Part I: Retrieval [J]. Fluid Phase Equilibria,1979, 2(4): 297–309
[10] Xin Kun, Song Yuhe, Dai Fangfang, et al. Liquid–liquid equilibria for the extraction of furfural from aqueous solution using different solvents [J]. Fluid Phase Equilibria,2016, 425: 393–401
[11] Fazlali A, Askari-Mehrabadi M, Mohammadi A H.Extraction of aromatics from petroleum naphtha reformate by solvent: UNIFAC modelling and optimization of solvent consumption [J]. Journal of Chemical Thermodynamics,2012, 53(10): 30–35
[12] Othmer D, Tobias P. Liquid-liquid extraction data - The line correlation [J]. Industrial & Engineering Chemistry,1942, 34(6): 693–696
[13] Bachman I. Tie lines in ternary liquid systems [J].Industrial & Engineering Chemistry, 1940, 14(1): 38–39
- 中国炼油与石油化工的其它文章
- Synthesis of Core-Shell HZSM-5@SBA-15 Composite and Its Performance in the Conversion of Methanol to Aromatics
- Effects of Gasoline with Ester Additives on the Swelling Behavior of Rubbers
- Fabrication of the Core-Shell Structured ZSM-5@Mg(Al)O and Its Catalytic Application in Propane Dehydrogenation
- ZSM-5/MAPO Composite Catalyst for Converting Methanol to Ole fins in a Two-Stage Unit with a Dimethyl Ether Pre-Reactor
- Oxidation of Dibenzothiophene in Model Diesel Using Hydroperoxide Generated via In-Situ Reaction of Octane with Oxygen
- Controllable Synthesis of Mixed-Phase TiO2 with Small Anatase and Rutile Particle and Its Enhanced Photocatalytic Activity