
Effects of Gasoline with Ester Additives on the Swelling Behavior of Rubbers
2018-04-24 06:08WangPengfeiYangHeSongHaiqingZhangJianrong
中国炼油与石油化工 2018年1期
Wang Pengfei; Yang He; Song Haiqing; Zhang Jianrong
(SINOPEC Research Institute of Petroleum Processing, Beijing 100083)
1 Introduction
Because of the potential toxicity of MTBE[1-4]for human being and the underground water, the Environmental Protection Bureau (EPA) of California in the US had banned the use of MTBE as anti-knock additive to gasoline in 2004. Some researchers have started to find other compound to replace MTBE. These investigations put emphasis on some ester compounds such as ethyl acetate (EA),methyl acetate (MA) and dimethyl carbonate (DMC).They have several advantages over MTBE. Firstly, they are not toxic. Secondly, they have pleasant odor. Thirdly, they do not produce aldehydes, ketones, and carbon monoxide (formed at high oxidation state). In addition,the theoretical investigation[5-10]indicated that the performance of gasoline-ester blends measured in terms of the RON, MON, RVP, and distillation curve was better in comparison with the MTBE-gasoline blends.
The increasing use of polymeric materials in the vehicle industry not only has reduced the steel consumption, but also the weight of vehicles. Different polymeric materials have been used in manufacturing the bumpers, the instrument panels, the door trims, the door handles, the radiator fans, the fuel tanks, the fuel filters, and other components of the fuel system. Elastomers are one of the most important groups of materials used in the fuel systems because of their intrinsic properties, chemical resistance, durability, and dimensional stability. According to this fact, it is especially important to study the elastomer/fuel compatibility when the ester additives that are organic solvents with high polarity are blended in gasoline, because they might speed up the aging and fracturing process of the polymeric materials and cause swelling problems.
The objective of this paper is to study the effect of the swelling problem caused by the ester-gasoline blends.The changes in weight and volume of three elastomers,including the nitrile butadiene rubber, the fluorocarbon rubber and Silastic, were studied in different fuel blends.
2 Experimental
2.1 Experimental Materials
2.1.1 Fuel used in the immersion tests
Experimental gasoline samples: 12 different gasoline samples were prepared by blending the RON 93 unleaded gasoline with four different volume fractions of the additives, viz.: 1%, 3%, 5% and 10% of dimethyl carbonate,ethyl acetate or methyl acetate, respectively. Several
2.1.2 Elastomer materials
Three kinds of rubber materials including NBR (nitrile-butadiene rubber), FKM ( fluorocarbon rubber), and Silastic were chosen for the experimental study. All the rubber samples were provided by the Taiwan OTP China operations. The size of all the rubber samples was that of the O-type ring measuring 38 mm (inside radius) × 3.5 mm (wire diameter).
2.2 Experimental setup
The measurement method was performed according to the test method GB/T 1690―2010. Test specimens were weighed and placed into a quartz test tube containing approximately 100 mL of the fuel so that the test specimens were completely immersed. The test specimens were periodically removed from the fuel and wiped with paper to remove the excess fuel from the sample surface. By measuring the mass and volume changes of the O-type ring rubber samples, which were soaked in different fuel samples for different time duration at the ambient temperature, the different in fluence of ester blended gasoline on the swelling property could be easily observed between the base gasoline and the ester blended gasoline. All the three O-type ring rubber samples were soaked in different gasoline samples at ambient temperature for three weeks,during which their mass/volume changes were measured at the 1st, 3rd, 5th, 7th, 14th, and 21thday, respectively. The test specimens were periodically removed from the fuel and cleaned with paper to remove the excess fuel from the sample surface before being weighed. The weight gain was calculated using the following equation:

where Msis the weight of the sample after swelling and Mdis the weight of dry sample before swelling.
The volume gain was calculated using the following equation:

in which Vsis the volume of the sample after swelling and Vdis the volume of dry sample before swelling.
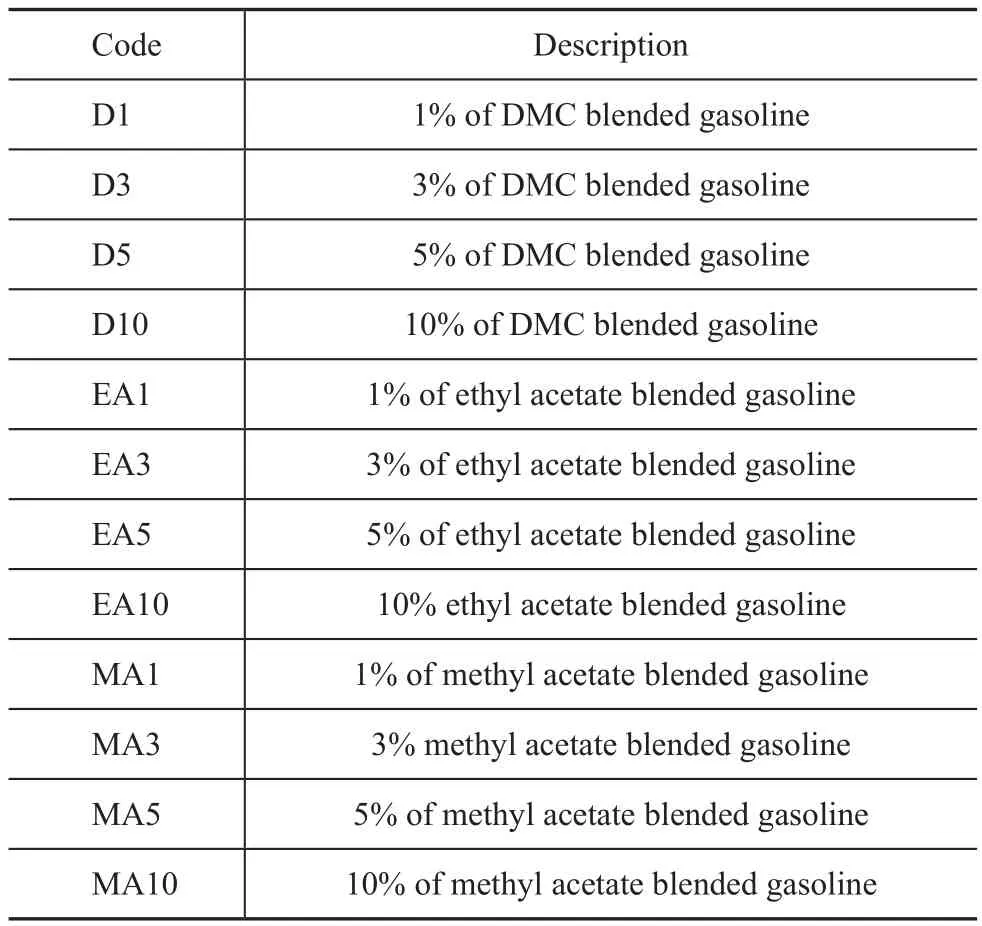
Table 1 Identification codes for the fuel
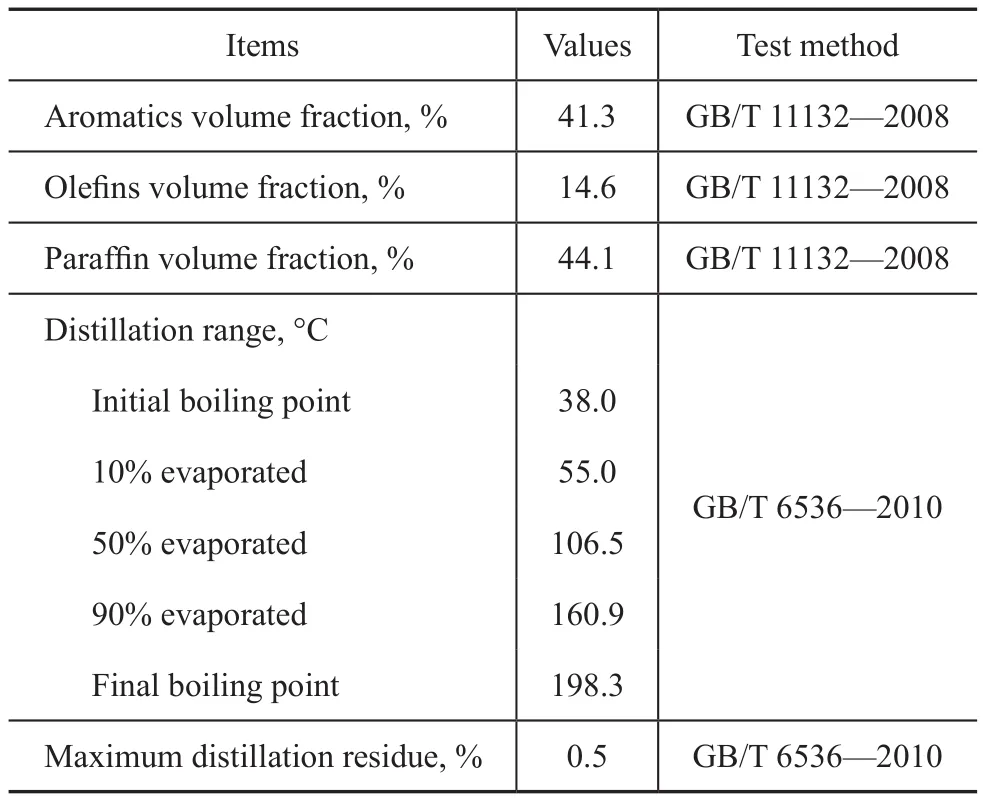
Table 2 Physicochemical properties of the RON 93 unleaded gasoline
3 Results and Discussion
3.1 Sorption and desorption in different additiveblended gasoline
3.1.1 Weight change
Figure 1 shows the changes in the weight of silastic after being exposed in different ester blended fuels and base gasoline for a period of 21 days at ambient temperatures.Figure 1a shows that after immersion tests the weight of silastic samples increased by over 105%. The weight of silastic samples increased a lot after the first day. With the increase of immersion time, the weight of those samples that were soaked in the DMC blended fuel changed a little as compared with the previous measurement results during the whole immersion tests. However, the final weight gain of the silastic sample soaked in the DMC blended fuels and the base gasoline was quite close to each other.Figure 1b and Figure 1c show the test results of silastic immersion in the ethyl acetate blended gasoline and methyl acetate blended gasoline, respectively. The weight of silastic sample in the MA10 increased more than other samples, with the change process being similar to Figure 1a. The results depicted in Figure 1 indicated that the concentration and the kind of ester additives would in fluence the swelling process a little.
The experimental data presented in Figure 2 brie fly summarize the change in weight of FKM after the immersion tests. For the samples exposed in the DMC blended gasoline (Figure 2a), the weight of FKM in D10 increased by 18%,which was the highest value. The weight of FKM samples in neat gasoline increased by only 2%. The swelling degree of FKM depended heavily on the DMC concentration. Judging from the weight gain curves, the immersion process could be divided into two parts. One part was a weight increase process, and the other part was a process in which the weight increase gradually leveled off. Figure 2b and Figure 2c show the similar results of FKM immersion tests in the ethyl acetate and methyl acetate blended gasoline, respectively. But for the samples exposed in the MA blended fuel, the sorption process came to equilibrium faster than the other two cases. The results shown in Figure 2 indicated that the concentration of ester additives could influence the swelling process more obviously.
As for the NBR samples, the weight gain in the blended gasoline is shown in Figure 3. As regards the samples exposed in the DMC blended gasoline (Figure 3a), the weight of NBR in D10 increased by 34%,which was the highest value. The weight of NBR samples in neat gasoline increased by only 20%. The experimental results indicated that the NBR samples would swell when the concentration of ester additive eventually reached 3%. An unusual change was observed in the weight change of the NBR samples during the immersion tests.The weight gain decreased with an increasing experimental time. We suggested that the immersion process of NBR samples should include two parts. One was the sorption process, and the other was the swelling process.The sorption process happened at the beginning of the test, and then the sorption and desorption reached a balance. The swelling process existed throughout the whole experimental period. Figure 3b and Figure 3c show the similar results of NBR immersion tests in the ethyl ac-etate and methyl acetate blended gasoline samples, respectively.
Figure 1 The weight changes of silastic rubber samples exposed to different fuels with ester additives

Figure 2 The weight changes of FKM rubber samples exposed to different fuels with ester additives
3.1.2 Volume change
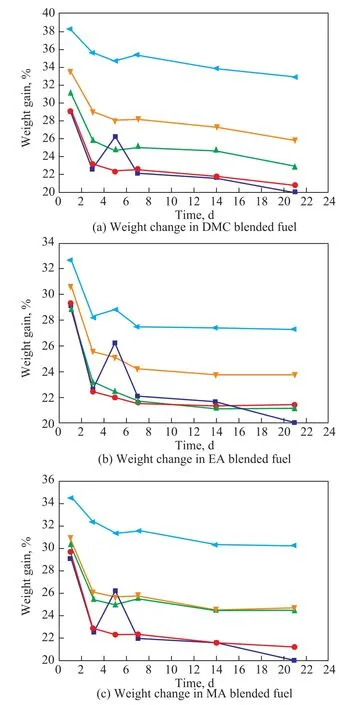
Figure 3 The weight changes of NBR rubber samples exposed to different fuels with ester additives
Figure 4 shows the swelling processes of silastic in different ester blended gasoline. The samples of the silastic exposed to different gasoline samples demonstrated a volume increase, which was up to 165%–180%. For the samples immersed in the DMC blended gasoline (Figure 4a),the silastic specimens showed the biggest volume gain during the first 2 or 3 days and then exhibited reductions in volume after 5 days. These reductions may have been caused by the dissolution of soluble components such as plasticizers, stabilizers or additives contained in the elastomer. The similar results are shown in Figure 4b and Figure 4c. All the three results showed that the concentration of ester compounds effected a little on the swelling behavior of the oil-resistant elastomer.
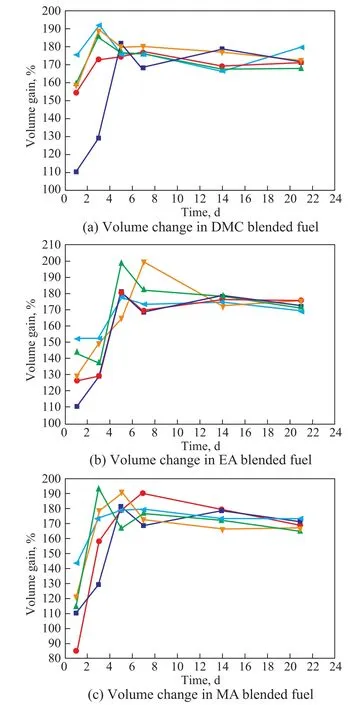
Figure 4 Sorption and desorption processes of silastic in the ester blended gasoline
It can be seen from Figure 5a that the FKM specimens exposed to different ester blended gasoline samples exhibited a volume increase. The volume increase of the FKM immersed in D10 was up to 30%, which was much higher than other samples exposed to other gasoline samples. The similar results are identified in Figure 5b and Figure 5c. The final results showed that the swelling degree of FKM specimens was basically proportional to the DMC concentration. Higher concentration of ester could affect the swelling behavior of FKM elastomer to a greater extent.
The swelling process of NBR in different ester blended gasoline samples is presented in Figure 6. During the immersion tests the NBR samples showed a different swelling trend as compared with other elastomers exposed to the same gasoline sample. As shown in Figure 6a, the volume gain of samples in neat gasoline, D1,and D3 were similar between each other but the vol-ume gain of sample in D10 was much higher than other samples. The volume gain of sample in D1 was smaller than that in neat gasoline. According to the test data, a small amount of DMC in gasoline could speed up the dissolution of soluble components instead of swelling.The similar results are exhibited in Figure 6b and Figure 6c. Similarly, higher concentration of ester compounds could affect more heavily the swelling behavior of the oil-resistant elastomer.
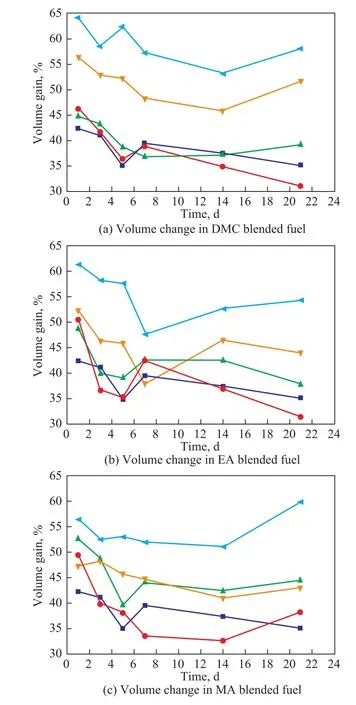
Figure 6 Sorption and desorption processes of NBR in the ester blended gasoline
3.2 Mulliken charge analysis of ester compounds
By using the Mulliken charge calculation of ester compounds, the hydrogen bond position could be predicted more directly. The Mulliken charge was calculated by Gaussian 09 and Gaussian View 5.0. The DFT functional analysis was chosen as the calculation method and rb3lyp/6-31g was chosen as the quantum mechanics basis set. The results are presented in Figure 7.
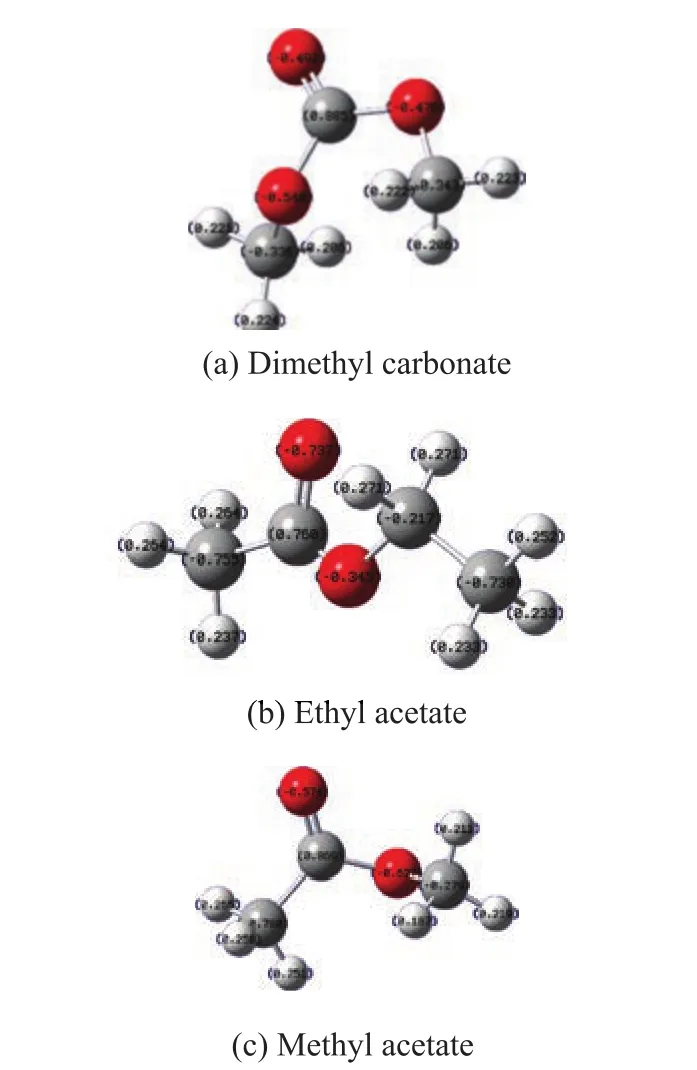
Figure 7 Mulliken charge analysis
The white, gray and red balls represent hydrogen atom,carbon atom and oxygen atom, respectively. The number on the different balls represents the relative electric charge distribution. The Mulliken charge analysis shows that the state of H atoms in different ester compounds is fairly similar and it cannot help to predict the hydrogen bond. The results also indicate that the state of C atoms in these three ester compounds is different.So the different electric charge distribution of ester groups can in fluence the sorption process of elastomer.Especially for DMC, its anomeric carbon atom cannot provide enough electron density for the hydrogen atom,so that the H atom would have higher positive electricity. By depending upon this Mulliken charge analysis result, DMC may have hydrogen bond formation on the methyl groups, and however, other two ester com-pounds may have hydrogen bonding formation on the carbonyl groups.
3.3 The deformation charge density analyses of elastomer materials
The deformation charge density analyses could show the electric charge distribution directly and find the interaction point between the ester compounds and the elastomer. We used Materials Studio 8.0 to establish the simulation molecule of FKM and NBR and optimized the molecular structure by using the Forcite quantum mechanics basis set to get a stabilized conformation. The deformation charge density analyses were based on the optimized stabilized conformation, with the results shown in Figure 8.
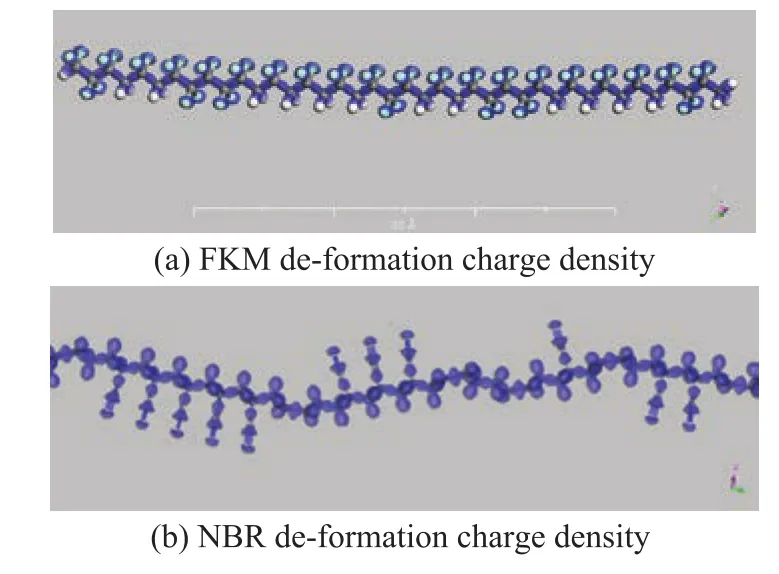
Figure 8 Deformation charge density of simulation molecules
It can be seen from Figure 8a that the deformation charge density of FKM indicated that the electrons of C atom and H atom migrated to the F atom through the covalent bond.The electron density of F atom was much higher than that at other positions, so the hydrogen bond could be established on the F atom rather than on other positions. The deformation charge density of NBR shown in Figure 8b indicated that the electrons of C atom and H atom could migrate to the N atom of cyan group through the covalent bond. The electron density of H atom was much lower than other positions, so the hydrogen bond could be established on the H atom other than on other positions. Because the cyan group was an electron withdrawing group,there would be electrostatic interaction between the NBR and ester compounds.
3.4 The sorption process of ester compounds
Based on the molecule simulation analysis, the electron cloud of these molecules could be displayed. So the interactions between ester compounds and FKM or NBR were inferred. The process for sorption of ester compounds could proceed by the ways presented in Figure 9.
The interactions between the ester and FKM could appear to be hydrogen bonding. The hydrogen bonding could occur between the hydrogen atom on the anomeric carbon atom and the fluorine atom. This hydrogen bonding would in fluence the outer electron environment of FKM to change their oil resistance.
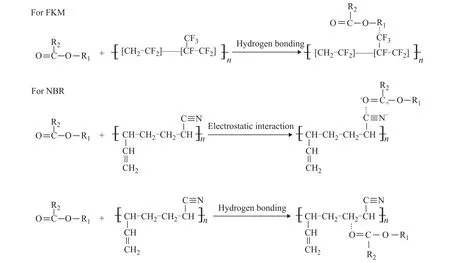
Figure 9 Interactions between ester compounds and elastomers
As for NBR, the interactions may be more complicated.One case is that the hydrogen bonding could take place between the carbonyl and the hydrogen atom on the NBR backbone. Another case is that the electrostatic interactions could occur between the carbonyl and the cyano groups. These interactions could influence the outer electron environment of NBR to change their oil resistance.
4 Conclusions
Judging from the results obtained in this work, we could infer that the ester compounds could cause serious swelling problem for the fuel-resistant elastomer. But there was not any difference between the base gasoline and the ester blended gasoline with respect to the swelling behavior of common elastomers. According to the result of weight and volume changes, the swelling behavior of the oil-resistant rubber is related to the ester concentration.
The methyl acetate blended gasoline could weaken the seal ability of FKM much easier than the dimethyl carbonate or ethyl acetate blended gasoline. The dimethyl carbonate blended gasoline could weaken the seal ability of NBR much easier than the methyl acetate or ethyl acetate blended gasoline. The swelling behavior of NBR was more complicated than FKM. The in fluencing factors included the molecule electron environment and the molecular structure.
As for the swelling problem caused by ester additives,two oil-resistant polymers had displayed different mechanisms. The swelling problem of FKM ( fluorocarbon rubber) was mainly caused by the hydrogen bonding between H atom of the ester compounds and F atom of FKM. The formation of hydrogen bond changed the structure of electron shell and weakened the ability of oil-resistant FKM.The swelling problem of NBR (nitrile-butadiene rubber)was slightly different from that of FKM. Dimethyl carbonate could combine with the cyan groups of NBR because of the electrostatic interaction, which would change the structure of electron shell and weaken the ability of oil-resistant NBR. As for other ester compounds, the hydrogen bond between O atom of the ester carbonyl and H atom of NBR changed the structure of electron shell and weakened the ability of oil-resistant NBR.
In a word, the ester blended gasoline could cause serious swelling phenomenon, no matter the elastomer was oil-resistant or not. Swelling could cause fuel leakage. If the oil leak happens in the course of driving it could pollute the environment and even lead to accidents. It should be more careful and thoughtful when we add ester additives into gasoline
[1] Elovaara E, Stockmannjuvala H, Mikkola J. Interactive effects of methyl tertiary-butyl ether (MTBE) and tertiary-amyl methyl ether (TAME), ethanol and some drugs:Triglyceridemia, liver toxicity and induction of CYP (2E1,2B1) and phase II enzymes in female Wistar rats [J]. Environmental Toxicology and Pharmacology, 2007, 23(1):64–72
[2] Li D, Yuan C, Gong Y. The effects of methyl tert-butyl ether (MTBE) on the male rat reproductive system [J].Food and Chemical Toxicology, 2008, 46(7): 2402–2408
[3] Mcgregor D. Methyl tert-butyl ether: studies for potential human health hazards [J]. Critical Reviews in Toxicology,2008, 36(4): 319–358
[4] Lee C, Mohr S, Weisel C. Toxico kinetics of human exposure to methyl tertiary-butyl ether (MTBE) following short-term controlled exposures[J]. Journal of Exposure Science and Environmental Epidemiology, 2001, 11(2):67–78
[5] Dabbagh H, Ghobadi F, Ehsani M. The in fluence of ester additives on the properties of gasoline [J]. Fuel, 2013, 104:216–223
[6] Wen L, Xin C, Yang S. The effect of adding dimethyl carbonate (DMC) and ethanol to unleaded gasoline on exhaust emission [J]. Applied Energy, 2010, 87(1): 115–121
[7] Gopinath D, Sundaram E G. Experimental investigation on the effect of adding dimethyl carbonate to gasoline in a SI engine performance[J]. International Journal of Scientific& Engineering Research, 2013, 3 (6): 1–5
[8] Jones R. Ethyl acetate as fuel or fuel additive: The United States, US 2011/0296744 A1[P]. 2011-12-08
[9] Kislitsyn A, Amirkhanov K. Methyl acetate as a component octane commercial gasoline [J]. Oil and Gas Technology, 2014(1): 178–192
[10] Christensen E, Yanowitz J, Ratcliff M A, et al. Renewable oxygenate blending effects on gasoline properties [J]. Energy & Fuels, 2011, 25(10): 4723–4733
- 中国炼油与石油化工的其它文章
- Synthesis of Core-Shell HZSM-5@SBA-15 Composite and Its Performance in the Conversion of Methanol to Aromatics
- Study on Co-re fining of Poplar Powder with Soybean Oil in Supercritical Methanol
- Fabrication of the Core-Shell Structured ZSM-5@Mg(Al)O and Its Catalytic Application in Propane Dehydrogenation
- ZSM-5/MAPO Composite Catalyst for Converting Methanol to Ole fins in a Two-Stage Unit with a Dimethyl Ether Pre-Reactor
- Oxidation of Dibenzothiophene in Model Diesel Using Hydroperoxide Generated via In-Situ Reaction of Octane with Oxygen
- Controllable Synthesis of Mixed-Phase TiO2 with Small Anatase and Rutile Particle and Its Enhanced Photocatalytic Activity