
Regionalization of wheat powdery mildew oversummering in China based on digital elevation
2018-04-04 03:38:34ZOUYafeiQIAOHongboCAOXuerenLIUWeiFANJieruSONGYuliWANGBaotongZHOUYilin
ZOU Ya-fei, QIAO Hong-bo, CAO Xue-ren, LIU Wei, FAN Jie-ru, SONG Yu-li, WANG Bao-tong,ZHOU Yi-lin
1 State Key Laboratory for Biology of Plant Diseases and Insect Pests, Institute of Plant Protection, Chinese Academy of Agricultural Sciences, Beijing 100193, P.R.China
2 College of Information and Management Science, Henan Agricultural University, Zhengzhou 450002, P.R.China
3 Environment and Plant Protection Institute, Chinese Academy of Tropic Agricultural Sciences/Key Laboratory of Integrated Pest Management on Tropical Crops, Ministry of Agriculture, Haikou 571101, P.R.China
4 Institute of Plant Protection, Henan Academy of Agricultural Sciences, Zhengzhou 450002, P.R.China
5 College of Plant Protection, Northwest A&F University, Yangling 712100, P.R.China
1. Introduction
Wheat powdery mildew, caused byBlumeria graminisf.sp.tritici, is one of the most destructive foliar diseases of wheat world-wide, especially in areas with maritime or semi-continental climates (Bennett 1984). In China, with the deployment of uniform resistance cultivars with a semidwarf growth habit, improved irrigation and fertilization conditions and high-yielding traits, wheat powdery mildew epidemics have been severe since the late 1970s (Liu and Shao 1995). The most destructive epidemics occurred in 1990 and 1991, causing yield losses up to 1.44 and 0.77 million tons, respectively (Liu and Shao 1994).
The disease cycle of wheat powdery mildew includes oversummering, autumn seedling infection, overwintering and spring epidemic. And oversummering is the key stage of all epidemic process. It has been shown that the pathogen can oversummer as mycelium and conidia on volunteer wheat seedlings or summer-sown wheat. Therefore, the oversummering range of this disease and the amount of pathogen are closely related with its prevalence in autumn and spring in China (Shi and Wan 1983; Li 1987). Hence,an oversummering regionalization study for this disease is of importance in its prediction, prevention and controlling.
Meteorological conditions have significant effects on the prevalence rate and damage degree of wheat powdery mildew, and especially on the oversummering of the pathogen (Li 1986). A large number of studies have shown that the average temperature in the hottest continous 10-day period is the key factor influencing the oversummering of wheat powdery mildew (Leiet al. 1982; Wanget al. 1984;Wuet al. 1984; Liuet al. 1990, 1992; Duanet al. 1992; Heet al. 1998). Researchers generally believe that temperature is the key factor influencing oversummering, but this has not been confirmed by large-scale data analysis.
In a previous study, Liet al. (2013) classified regions of wheat powdery mildew oversummering in China using the temperatures of the hottest continuous 10-day period below the termination threshold (25.5°C) (model 1) and the temperatures equivalent to those terminating wheat powdery mildew growth (model 2) as major regionalization indexes. However, this study did not account for the effect of digital elevation on spatial interpolation, and the lack of spatial interpolation points resulted in low resolution maps of oversummering which possibly led to inaccurate in the oversummering regionalization of wheat powdery mildew. Another is that in the context of global warming,the temperature sensitivity ofB.graminisf. sp.triticiwas showing a downward trend (Wanet al. 2010; Minget al.2012; Caidanzhuomaet al. 2015), and thus the average termination threshold of the disease was rising accordingly,leading to changes in the oversummering range of wheat powdery mildew in China. Hence, it is necessary to further determine the oversummering range of wheat powdery mildew in China.
The objectives of this study are to: 1) analyze the historical meteorological factor data and long-term oversummering survey data to pinpoint the key meteorological factor affecting oversummering of wheat powdery mildew; 2)accurately regionalize the oversummering range of wheat powdery mildew based on digital elevation and a proper threshold temperature of wheat powdery mildew.
2. Materials and methods
2.1. Data and resources
Weather dataContinuous data for daily average temperature, daily maximum temperature, daily average precipitation, daily average relative humidity, and sunshine duration at 752 weather stations in China (Fig. 1) from 1951 to 2013 were obtained from the National Meteorological Center of China.
Sources of spatial dataA map of China showing province information (1:4 000 000) was downloaded from the National Fundamental Geographic Information System of China(http://nfgis.nsdi.gov.cn). The Digital Elevation Model (DEM)was provided by the National Administration of Surveying,Mapping and Geoinformation of China. The resolution of the DEM was 500 m, and the elevation ranged from –159 to 8 770 m. A map of wheat-growing regions in China was also scanned from the Chinese Agricultural Atlas (CCNA 1989) and digitalized by using ArcGIS.
Disease data for oversummering of wheat powdery mildewSurvey data of the percentage of diseased plants for oversummering of wheat powdery mildew were collected from two sources: 1) 194 survey sites from 45 counties(cities) in Anhui, Beijing, Gansu, Guizhou, Hebei, Henan,Shaanxi and Yunnan of China from 2004 to 2009; and 2)previously published oversummering survey data for 68 survey sites (Leiet al. 1982; Zhang 1983; Wang 1984; Wuet al. 1984; Li 1986, 1987; Liuet al. 1990, 1992; Duanet al.1992; Zhanget al. 1993; Tuet al. 1999). Wheat powdery mildew can oversummer in 158 of the total of 262 survey sites (Fig. 2). The occurrence of wheat powdery mildew was converted to ranked data (hereinafter referred to as oversummering data). That is, the presence of wheat powdery mildew in a surveyed site was denoted by 1, and absence was denoted by 0.
2.2. Analytical method
Correlation analysis methods(1) Selection of meteorological factor data. Average temperature was mean of the hottest 10 days in July and August in 1951–2013, and the maximum temperature was the hottest 1 day in July and August in 1951–2013. Average precipitation, average relative humidity and sunshine duration were mean of July and August in 1951–2013. The selected meteorological factors were shown in Table 1.
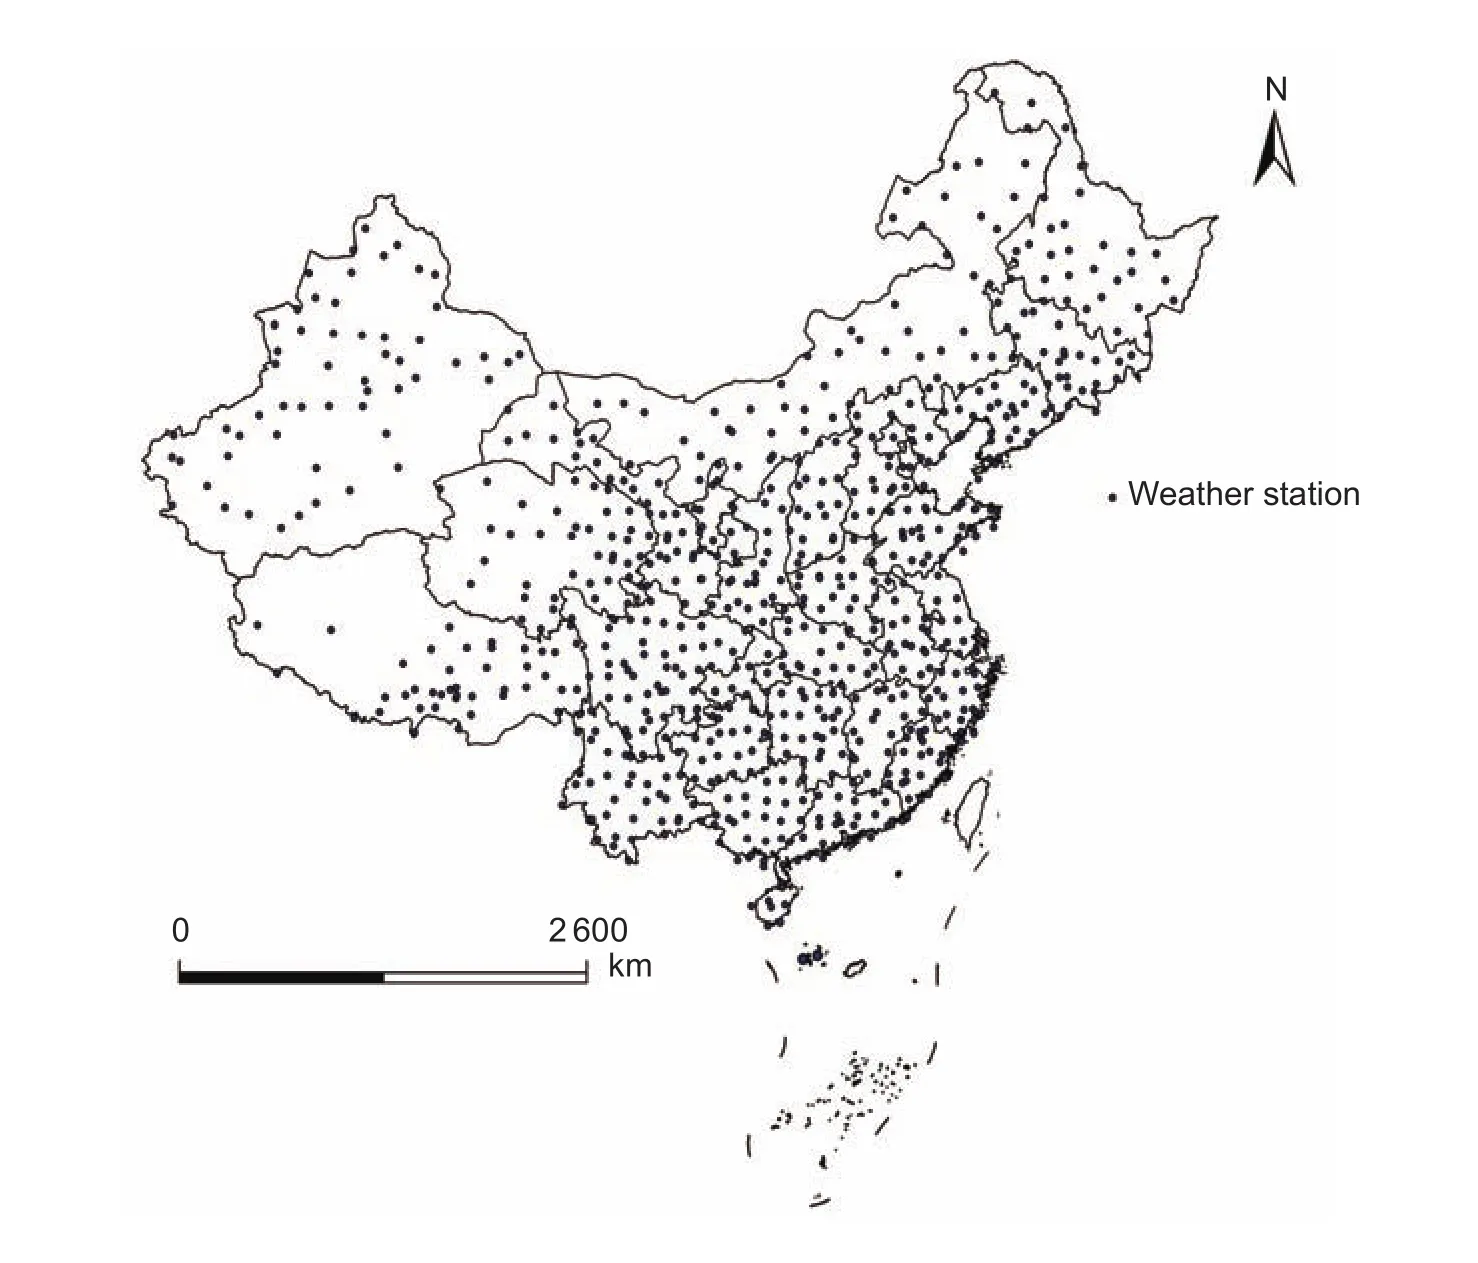
Fig. 1 Geographical location of weather stations throughout China used in the study.
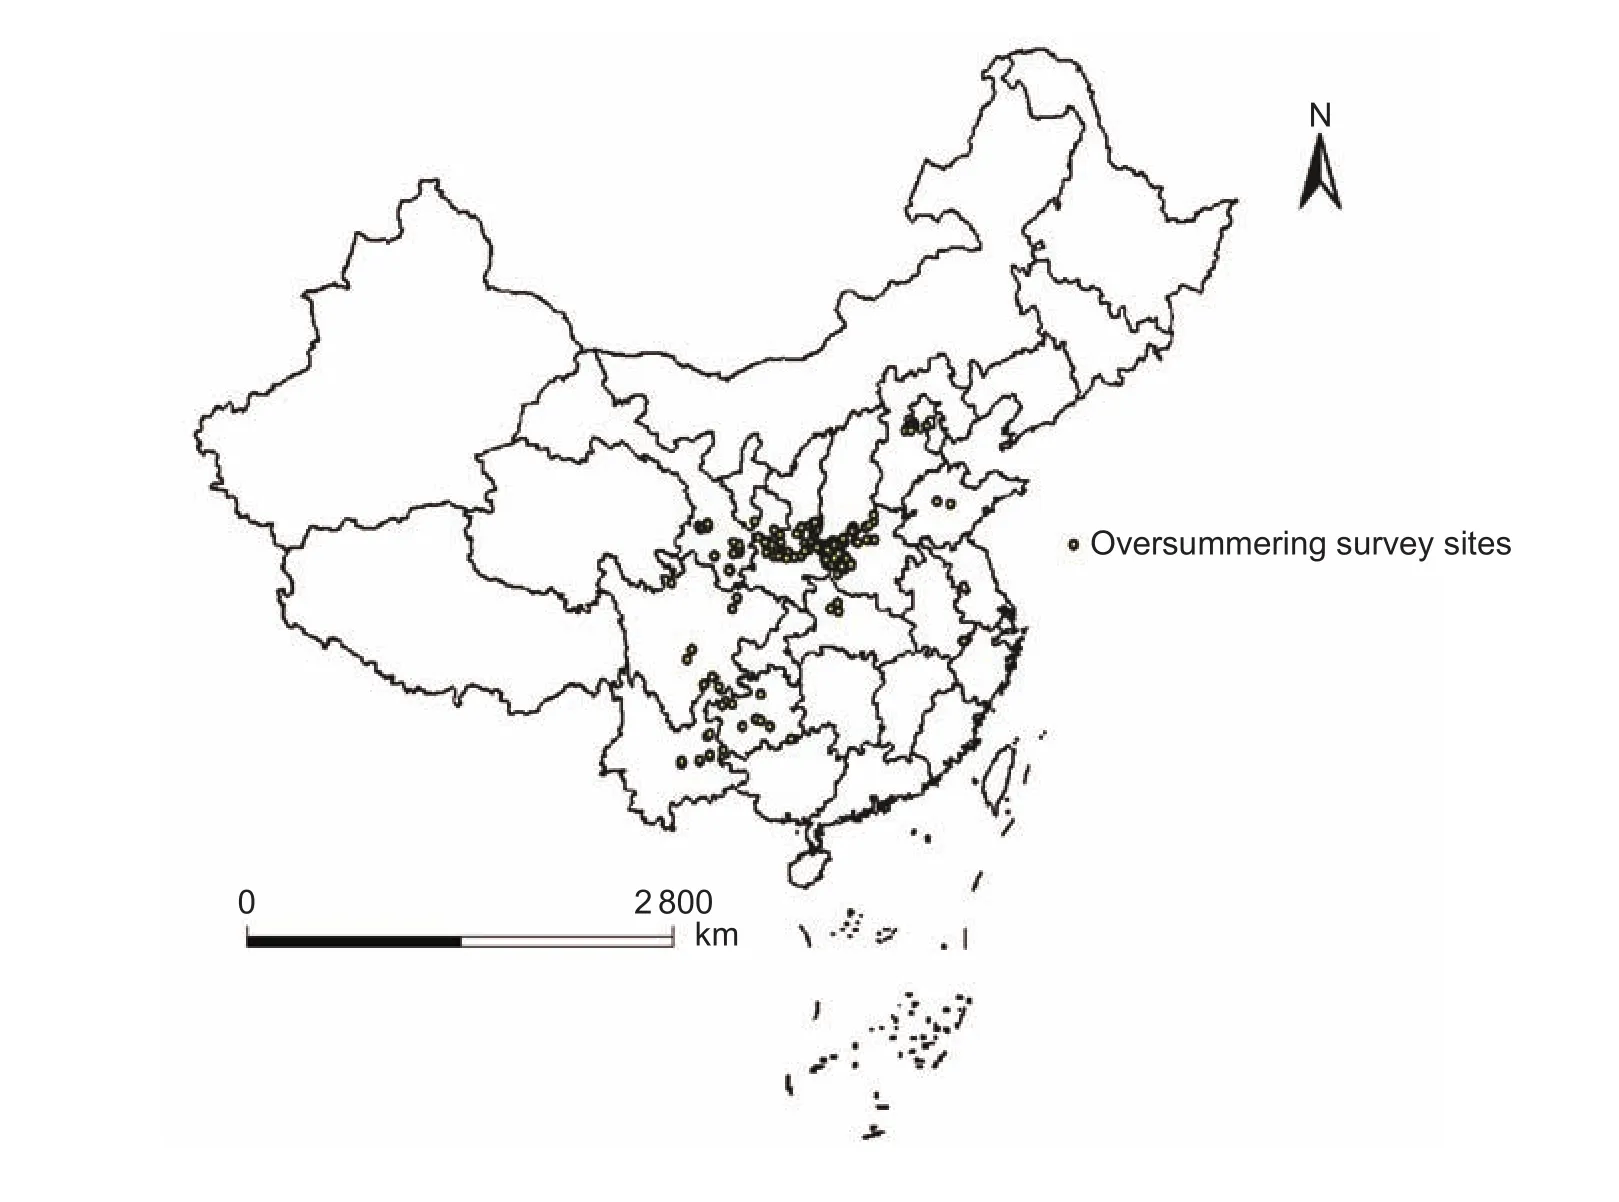
Fig. 2 Geographical location of the oversummering survey sites used in this study.
(2) Regression analyses of temperaturevs. longitude/latitude/altitude. The regression test was carried out by fitting the regression equation with the mean temperature,latitude, longitude or altitude of 752 sites by years. Then the average temperature of the hottest 10 days of the surveyed sites was predicted. The same method was used to fit regression equations between the mean temperature of the hottest 1 day and latitude, longitude or altitude by year. In this study, multiple linear regression models were used for analysis.
(3) Correlation analyses of oversummering data and meteorological factors. Analytical data included oversummering data, the average temperature, maximum temperature, average precipitation, average relative humidity and sunshine duration of the 262 oversummering surveyed sites. Firstly, the average and maximum temperatures of the 262 surveyed sites during the 10 hottest days in July and August were calculated respectively using the average and maximum temperatures of linear regression equations.Then data for meteorological factors (average precipitation,average relative humidity and sunshine duration) were extracted from 262 oversummering survey sites using the GIS spatial interpolation method (Liet al. 2013).Spearman’s rank-order correlation (Fanget al. 2013) was used to analyze the correlations between oversummering data and meteorological factors (the average temperature,maximum temperature, average precipitation, average relative humidity and sunshine duration).
Oversummering regionalization of wheat powdery mildew(1) Selection of a threshold temperature.Correlation analysis revealed that temperature is a key factor influencing the oversummering of wheat powdery mildew. Hence, it is crucial to select an appropriate threshold temperature to use in oversummering regionalization. Our research team has monitored sensitivity of population ofB.graminisf. sp.triticito temperature from different regions in China for recent years. The termination threshold of the temperature of 113 single colony isolates ofB.graminisf. sp.triticicollected from different regions in China in 2008 were ranged from 25.2 to 29.3°C, with an average termination threshold of 26.2°C (Wanet al. 2010). For 129 single colony isolates ofB.graminisf. sp.triticicollected from different regions in China in 2009, the termination threshold of the temperature ranged from 25.6 to 28.7°C with an average termination threshold of 26.7°C (Minget al. 2012). For 139 single spore isolates ofB.graminisf. sp.triticicollected from different regions in China in 2012, the termination threshold of the temperature ranged from 25.4 to 28.7°C, with an average termination threshold of 26.2°C (Caidanzhuomaet al. 2015). These results showed average thresholds ranging from 26.2 to 26.7°C in the temperature sensitivity ofB.graminisf. sp.triticifrom different regions in different years. This range is higher compared with the previously reported termination threshold range (23.5 to 26.0°C) (Leiet al. 1982; Wang 1984; Wuet al. 1984; Liuet al. 1990,1992; Duanet al. 1992; Heet al. 1998), indicating decreased temperature sensitivity. In order to more accurately reflect the temperature sensitivity level ofB.graminisf. sp.triticiin China, the median of these average termination thresholds of 2008, 2009 and 2012 (26.2°C) was selected as the threshold temperature for oversummering regionalization of wheat powdery mildew.
Tests of temperature termination threshold of isolates ofB.graminisf. sp.triticiwere carried out in laboratory. The single colony isolates ofB.graminisf. sp.triticicollected from different regions in China were tested by using detached leaf segment method at 6 different temperatures which were 18, 22, 23, 24, 25 and 26°C. On the 12th day after inoculation, the area of disease was recorded and the disease severity and inhibition rate were calculated. The equations of disease inhibition rate (Y) against temperature(X) for each isolate were constructed by linear regression analyses:Y=a+bX, whenY=100% calculated value of temperature of each equation was temperature termination threshold (ET100) of individual isolate ofB.graminisf. sp.tritici(Hanet al. 2016).
(2) Oversummering regionalization method. Using the“Create Fishnet” tool in ArcGIS, a fishnet with 20 km×20 km grids was created using a digital map of China as the base map, and data for longitude, latitude and altitude were extracted from all grid points, with 23 690 available data points obtained. The average temperatures for each years at each of the 23 690 points were calculated using the established regression equation (Table 2) and compared with the average termination thresholds (26.2°C). The annual probabilities of wheat powdery mildew oversummering at these points were then calculated as follows: Percent annual oversummering probability (%)=(The number of years when the average temperature below 26.2°C/The number of years from 1951 to 2013)×100. Based on this probability,the ordinary Kriging method (Liet al. 2013) was used for spatial interpolation and mapping oversummering regions of average termination thresholds of 26.2°C (hereinafter referred to as Model 26.2).
(3) Comparison of oversummering regionalization results.Receiver operating characteristic (ROC) curves was used to determine the accuracy of oversummering regionalizationmaps based on the average termination thresholds of 26.2°C and the oversummering probability threshold of wheat powdery mildew. Among the 252 sites surveyed,B.graminisf. sp.triticifound to have produced disease symptoms on volunteer plants at 158 sites.
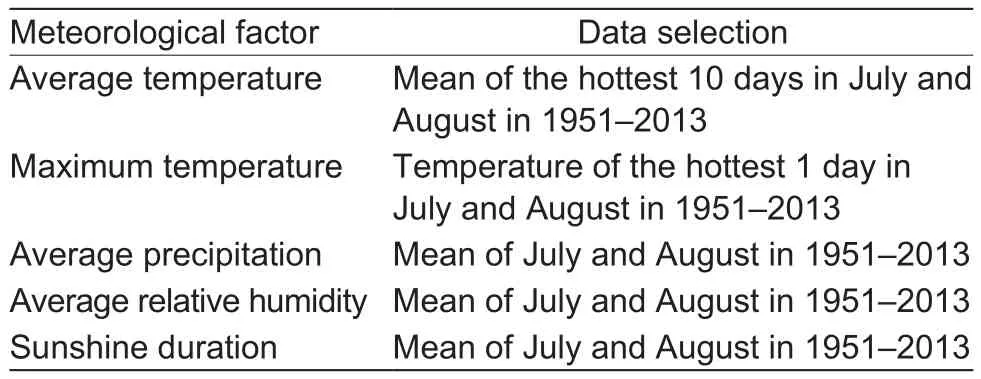
Table 1 The selected meteorological factors
Sensitivity refers to the proportion of data sets where disease can oversummer that were classified correctly,and specificity refers to the percentage of data sets where disease could not oversummer that were classified correctly.To construct ROC curves, sensitivity was plotted as the ordinate and 1–specificity (referred to as the false positive proportion) was plotted as the abscissa. A larger area under the ROC curve (AUROC) indicates higher regionalization accuracy. For each model, the cut-point where the overall error rate was the smallest was determined by selecting the point with the highest value of Youden’s index,J, which is the point on the ROC curve at the greatest geometric distance from the line representing a noninformative predictor (Metz 1978). Youden’s index is commonly used as a measure of overall prediction effectiveness and is calculated byJ=Sensitivity+Specificity–1 (Metz 1978).
The coincidence rate (%) between the model predictions and observed data for the 158 sites was then calculated as follows: Coincidence frequency (%)=Number of oversummering sites (predicted by model)/Number of oversummering sites (wheat powdery mildew observed)×100
3. Results
3.1. Relationship between temperature, latitude,longitude or elevation
Through regression analysis, the equations for the relationship between the average of the hottest 10 days and altitude values, longitude values, latitude values during 1951–2013 were established for each year, respectively(Table 2), and the regression equation are different in different years.
3.2. Correlation analysis of oversummering data and meteorological factors
Spearman’s rank-order correlation analysis was conducted to determine the relationship between oversummering data and meteorological factors (the average temperature,maximum temperature, average precipitation, average relative humidity and sunshine duration). Based on these results (Table 3), there was only a significant correlation between oversummering and average and maximum temperature (allP<0.01) suggested that temperature is the key meteorological factor affecting oversummering of wheat powdery mildew.
3.3. Wheat powdery mildew oversummering regionalization
Oversummering regionalization based on digital elevation and average termination threshold (26.2°C)The ordinary Kriging model was used for spatial interpolation of annual oversummering probability. Using wheatgrowing regions as a base map, a map of oversummering regionalization based on the average termination threshold 26.2°C of wheat powdery mildew (Model 26.2) (Fig. 3). In this map, wheat powdery mildew oversummering regions in China are located mainly in alpine or high altitude areas,forming a narrow north-south main oversummering zone.Regions with an annual oversummering probability of greater than 50% mainly cover northern and southern Yunnan, northwestern Guizhou, northern and southern Sichuan, northern and southern Chongqing, eastern and southern Gansu, southeastern Ningxia, northern and southern Shaanxi, central Shanxi, western Hubei, western Henan, northern and western Hebei, western Liaoning,eastern Tibet, eastern Qinghai, western Xinjiang and other regions. These regions are high suitable areas for oversummering of wheat powdery mildew. Regions with an annual oversummering probability of between 15 and 50% mainly cover the periphery of the Sichuan Basin, central Guizhou, central Shaanxi, southern Shanxi, central Shandong, the Liaodong Peninsula, and some mountainous areas in Hunan, Fujian and Zhejiang.These regions are at moderate suitable areas for wheat powdery mildew oversummering. Regions with an annual oversummering probability of between 5 and 15% mainly cover central Hebei, southern Beijing, Tianjin, and eastern Shandong. These regions are at low suitable areas for wheat powdery mildew oversummering.
Oversummering regionalization based on digital elevation and average termination threshold (25.5°C)Liet al. (2013) made maps of oversummering regionalization based on the average termination threshold 25.5°C of wheat powdery mildew in China. In order to facilitate comparison, this study uses the same method as Model 26.2 to made an oversummering regionalization map with an average temperature termination threshold of 25.5°C(hereinafter referred to as Model 25.5) (Fig. 4). In this map,oversummering regions for wheat powdery mildew also form a narrow north-south main oversummering zone. However,unlike Model 26.2, the range of wheat powdery mildew slightly narrows, and oversummering probabilities in some regions also decline to different degrees. Regions with a great difference in oversummering probability determined using Model 25.5 and Model 26.2 mainly cover southern Yunnan, central Sichuan, central Guizhou, southeastern Chongqing, western Hubei, central Shaanxi, western Henan,southern Shanxi, mountainous areas in western Hebei, and western Liaoning.
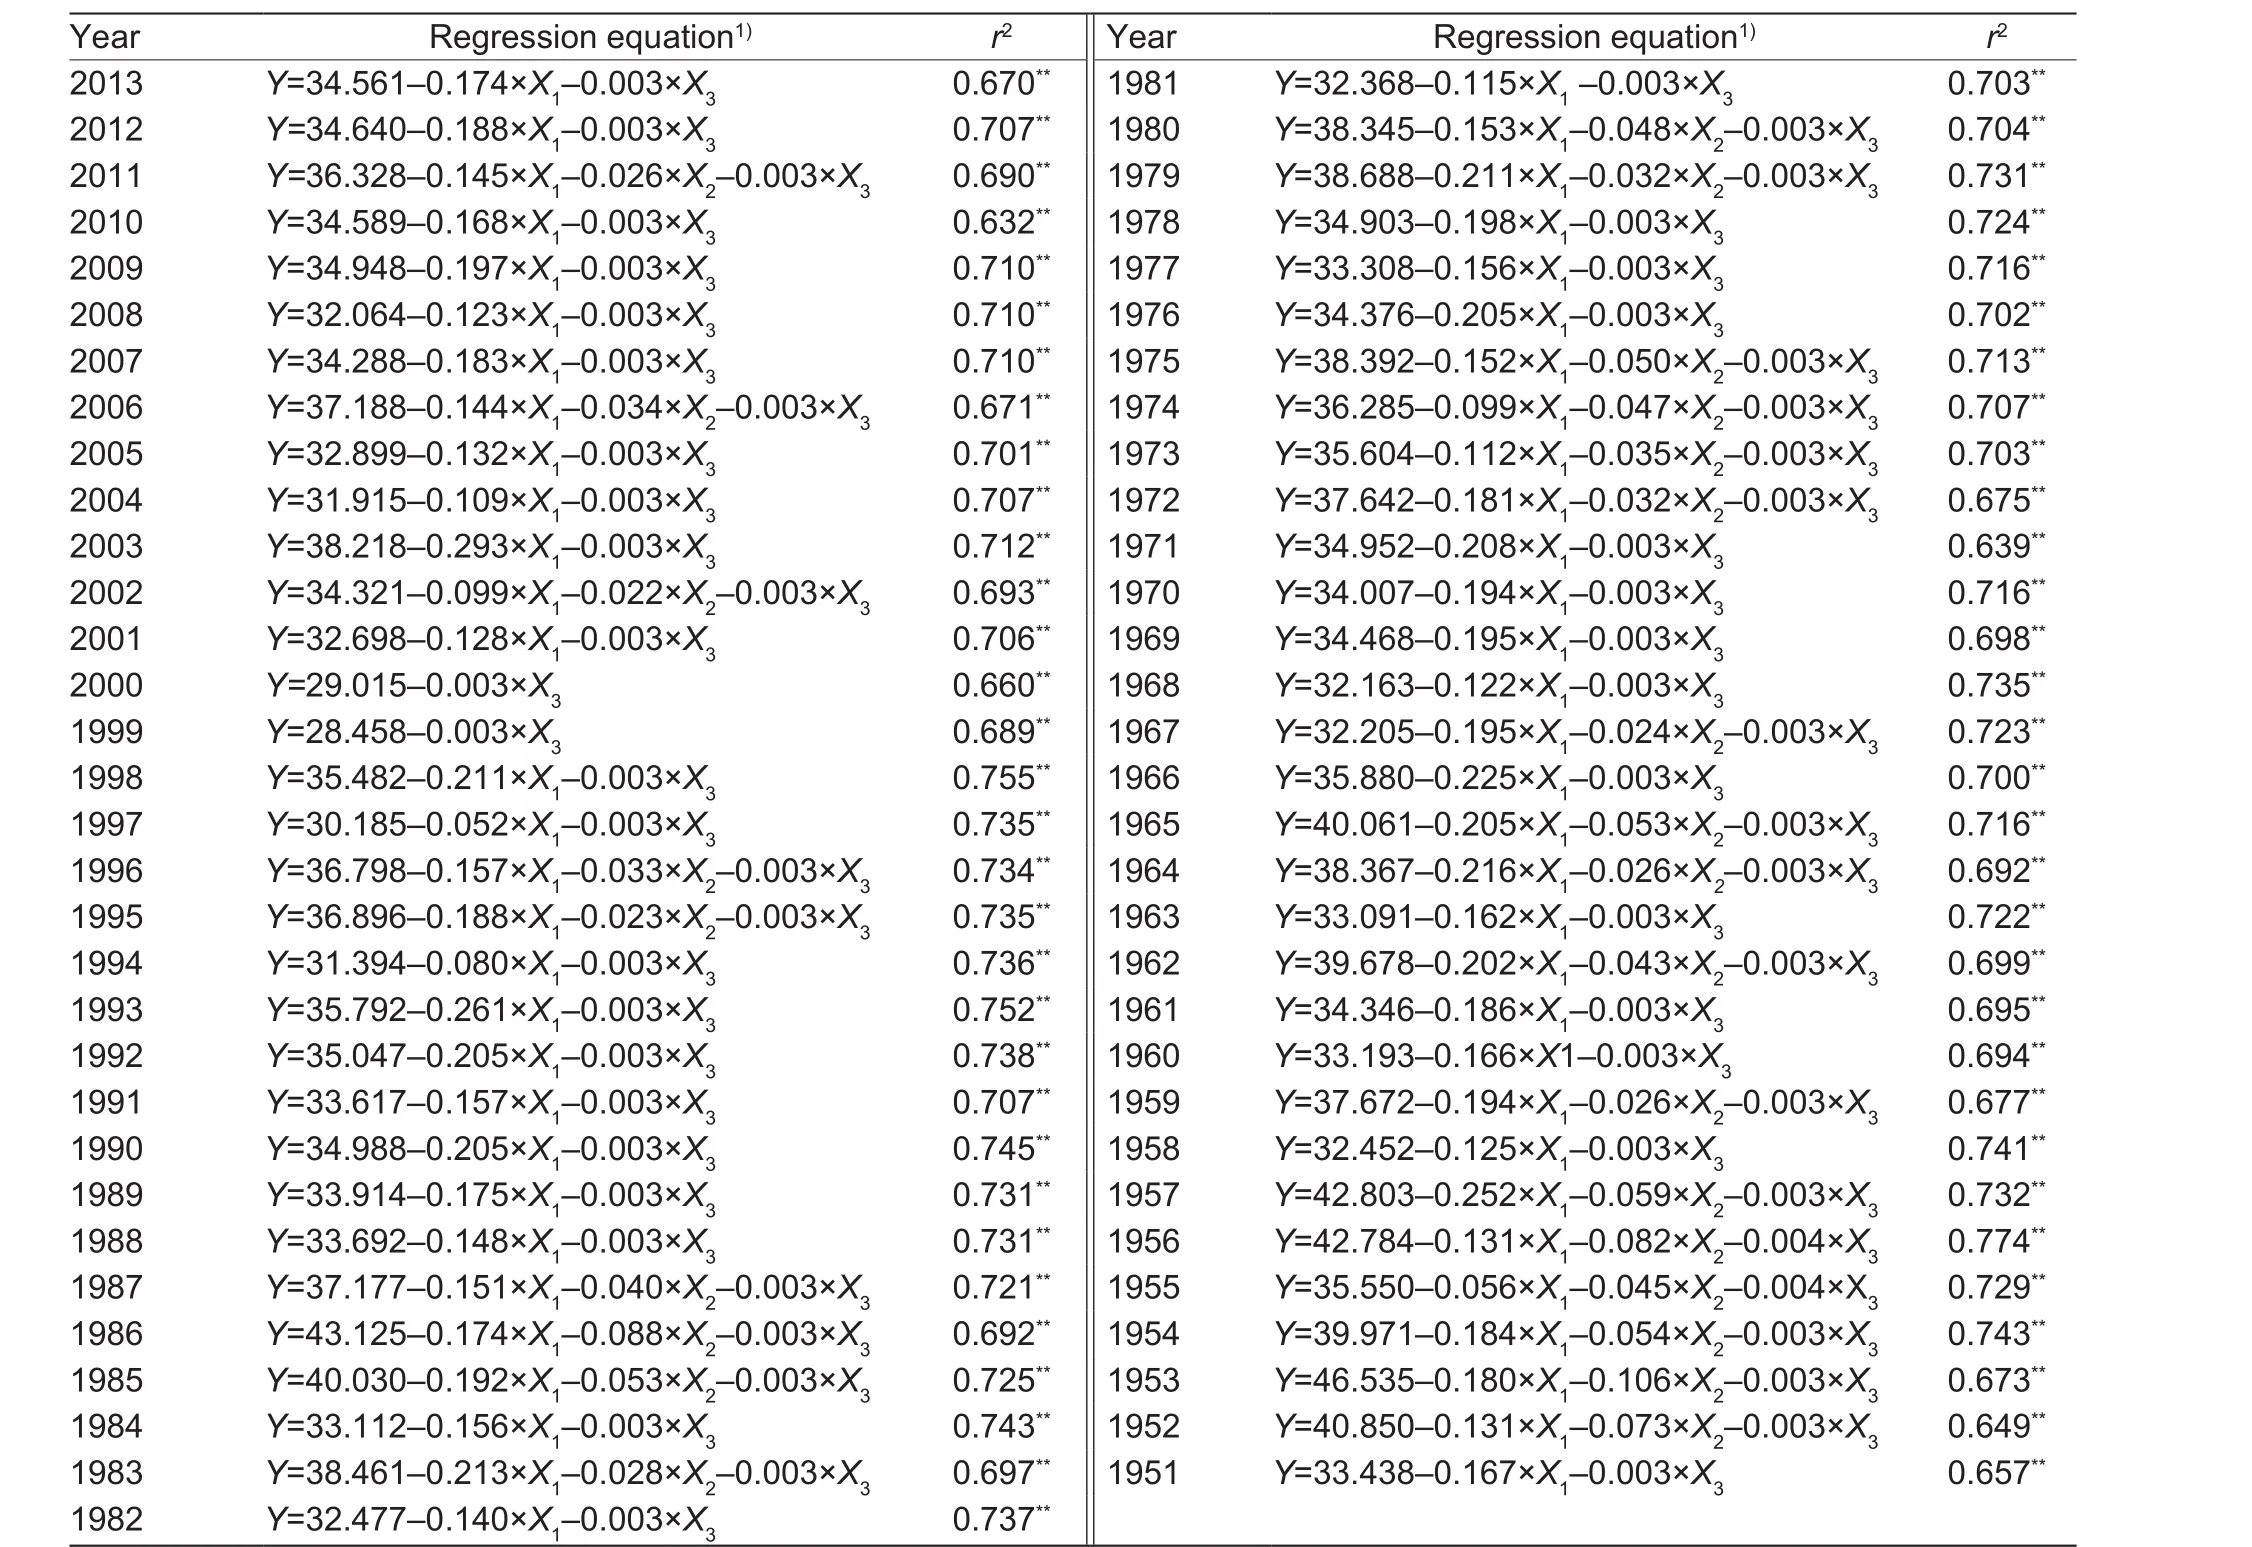
Table 2 Regression equations for the relationship between the average of the hottest 10 days between July and August and altitude values, longitude values, latitude values during 1951–2013
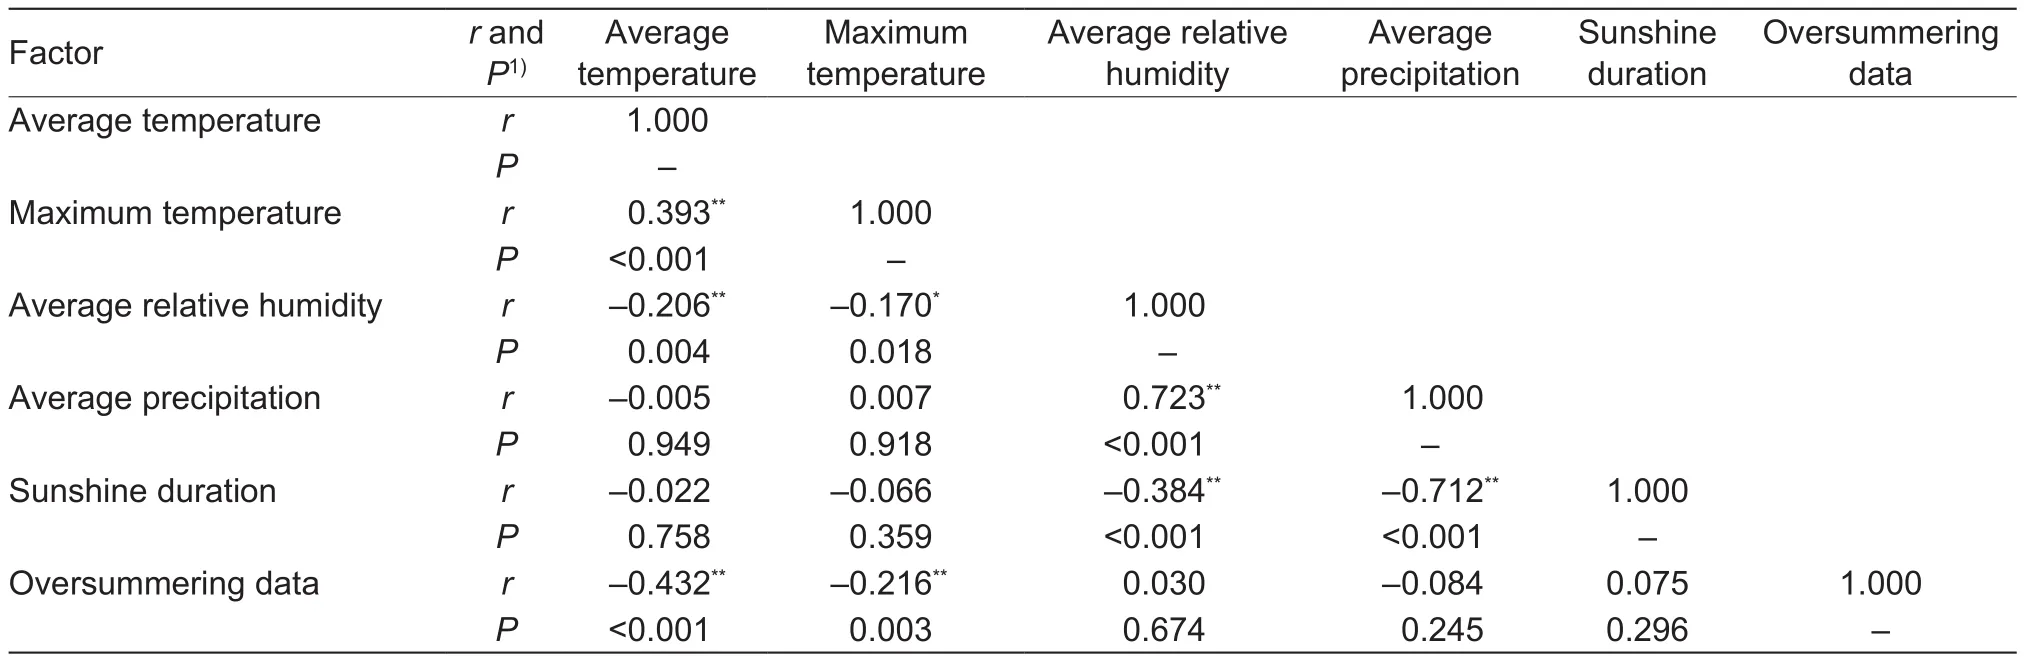
Table 3 The results of correlation analysis of oversummering data of wheat powdery mildew and meteorological factors1)
Comparison of oversummering regionalization Model 25.5 and Model 26.2 mapsThe AUROC values for Model 26.2 and Model 25.5 were 0.8426 and 0.8126, respectively(Fig. 5), indicating that Model 26.2 had higher regionalization accuracy than Model 25.5. In Model 25.5, Youden’s index is optimal for a cut-point of 15%, and the corresponding sensitivity and specificity values are 90.4 and 60.4%,respectively. we selected the cut-point in Model 25.5,15%, to define the threshold for wheat powdery mildew oversummering. That is to say, if the local wheat powdery mildew oversummering probability reaches to 15% and above, then this disease is considered able to oversummer.
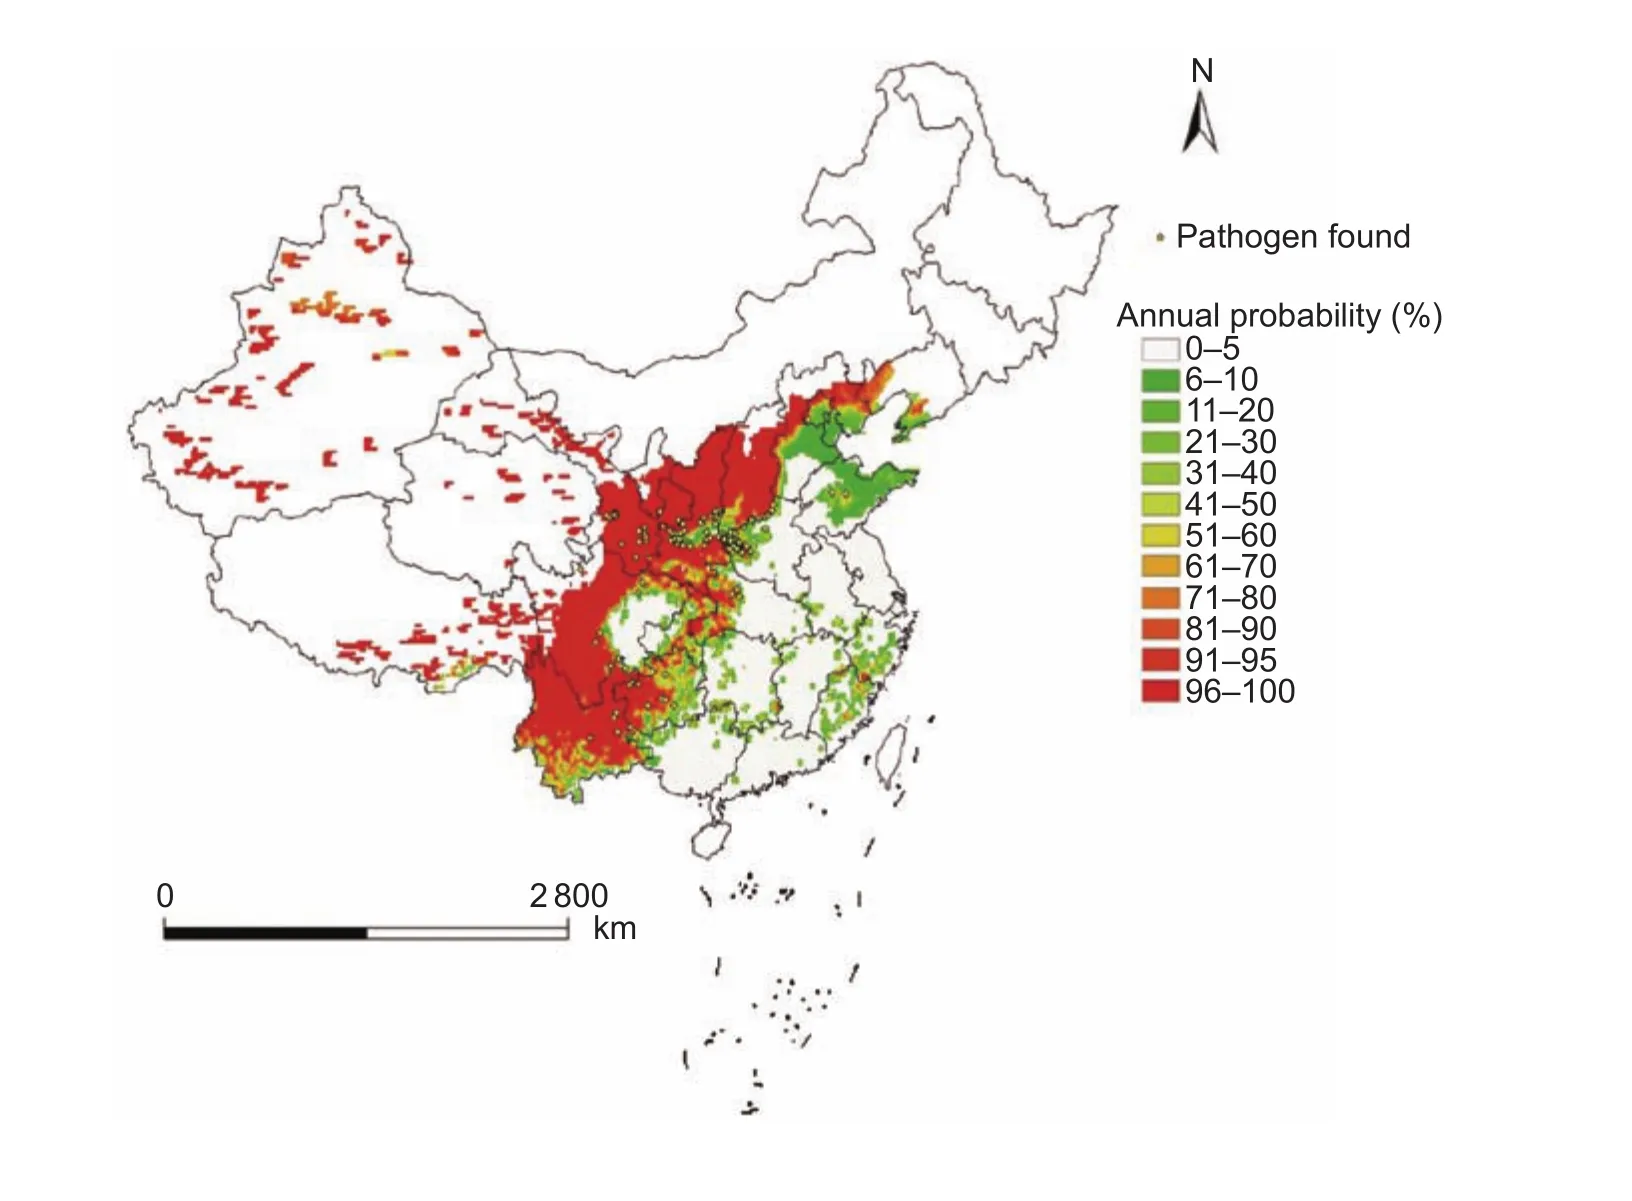
Fig. 3 Regionalization of the annual probability of wheat powdery mildew oversummering based on the average termination threshold 26.2°C (Model 26.2).
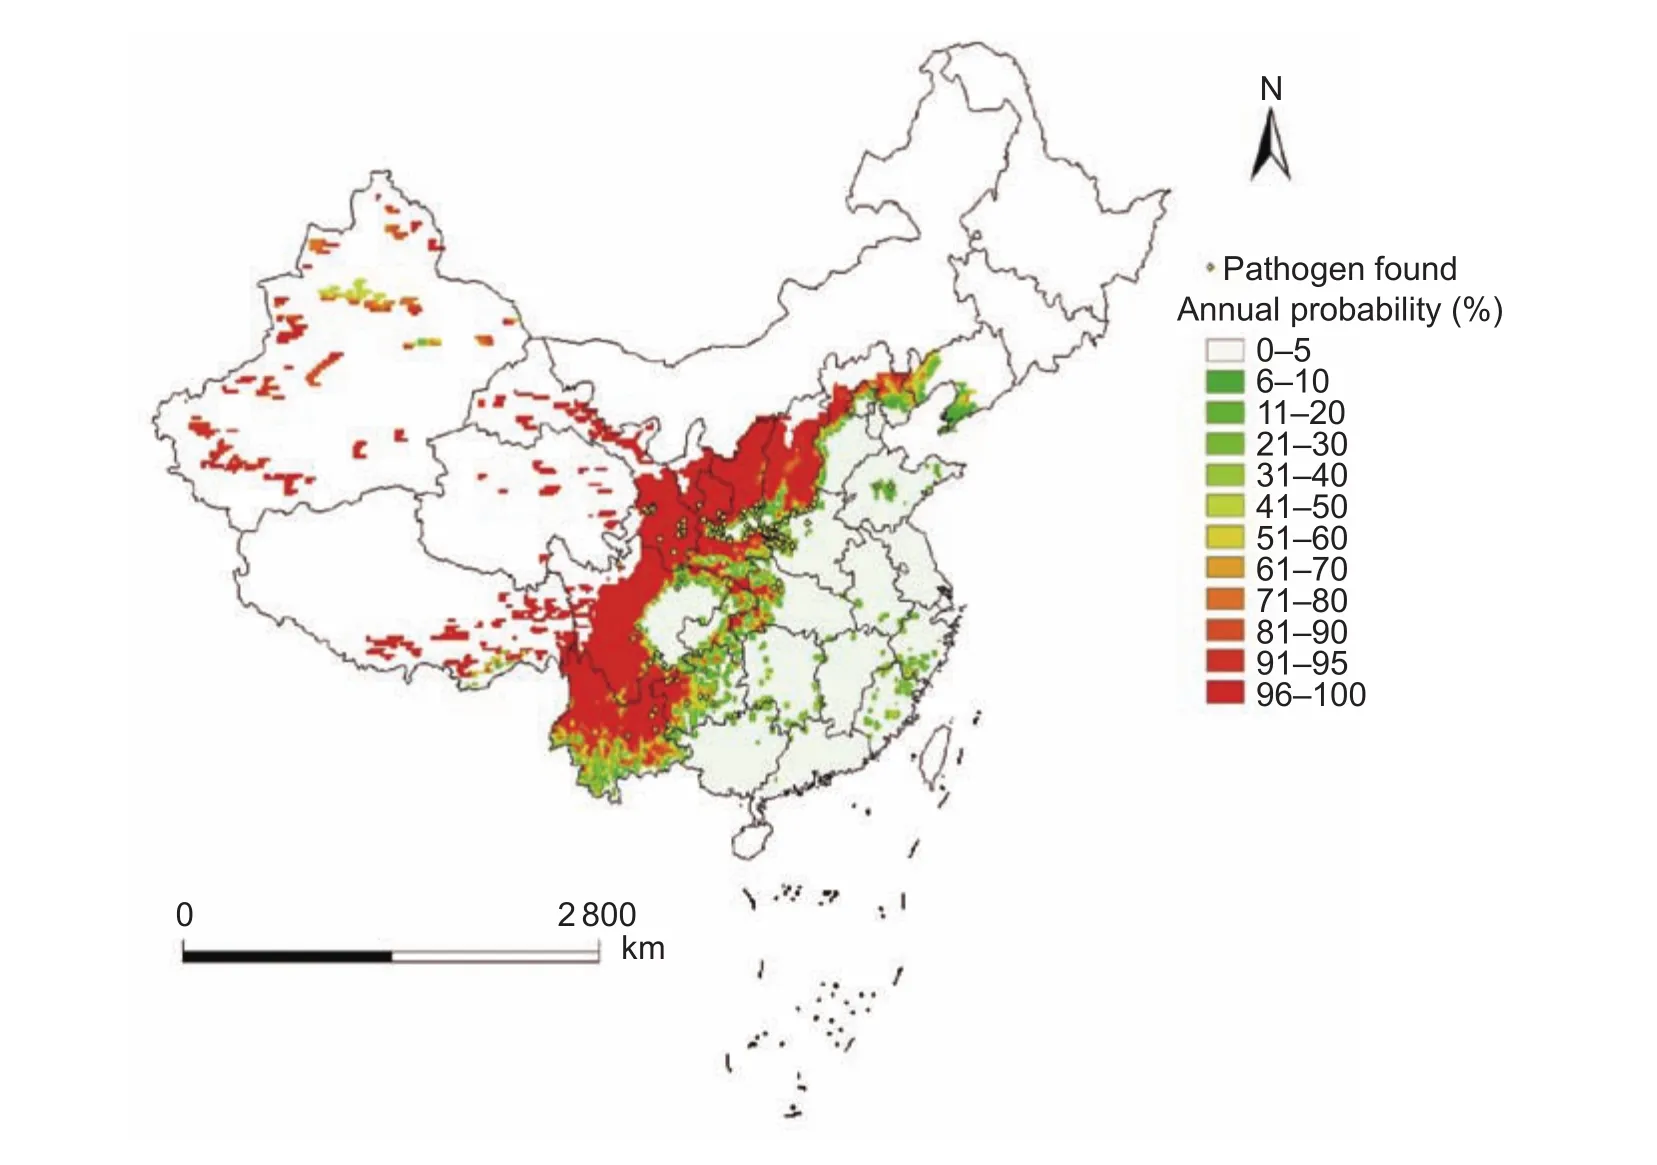
Fig. 4 Regionalization of the annual probability of wheat powdery mildew oversummering based on the average termination threshold 25.5°C (Model 25.5).
As shown in Table 4, of the 158 survey sites where wheat powdery mildew could oversummer, there were 144 and 152 oversummering sites located in regions with an oversummering probability of over 15% based on Model 25.5 and Model 26.2, respectively. Because Model 26.2 had a higher coincidence rate (96.20%) than Model 25.5 (91.14%),it can be concluded that predictions of oversummering based on Model 26.2 are more coincident with actual surveys,and more accurate regionalization results can be attained using this model.
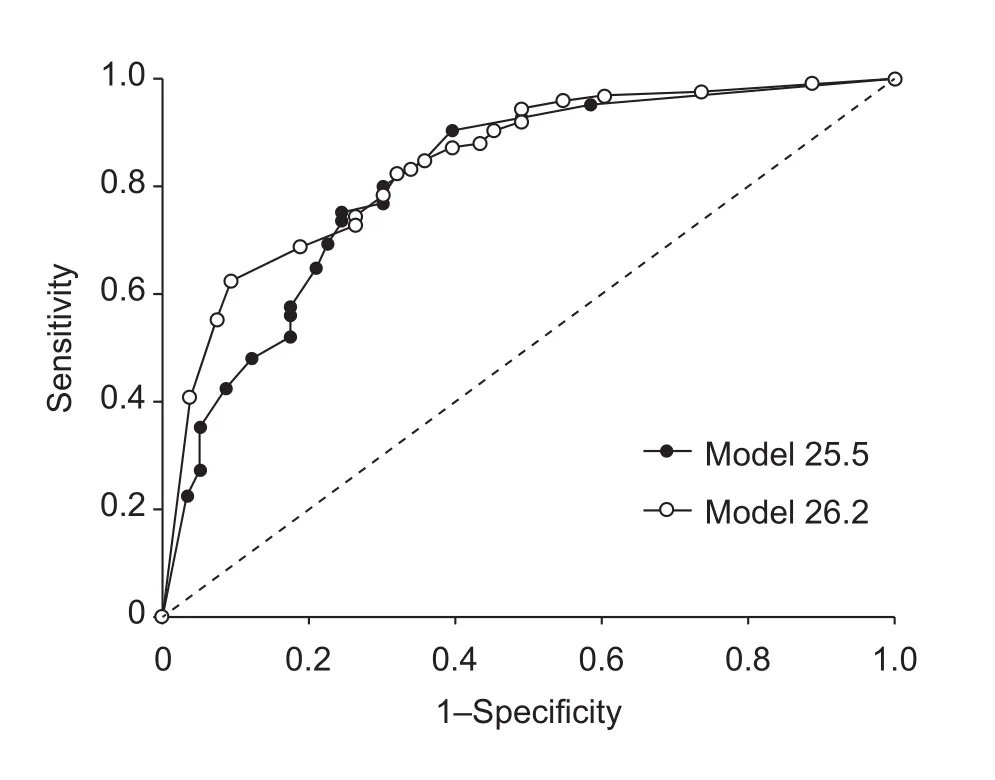
Fig. 5 Receiver operating characteristic plots for the two models, Model 25.5 based on the average termination threshold 25.5°C, and Model 26.2 based on average termination threshold 26.2°C, used to calculate the annual probability (%)of oversummering.
4. Discussion
In this study, the correlation between oversummering data of wheat powdery mildew and the meteorological factors over the past years was analyzed, and temperature was considered to be the most important meteorological factor influencing oversummering of wheat powdery mildew. Then oversummering regions of wheat powdery mildew were regionalized using Model 26.2 and Model 25.5 combined with the Digital Elevation model (DEM). Model 26.2 had the higher regionalization accuracy and more coincident with actual oversummering survey results compared with Model 25.5.
Generally, it takes approximately 10 days from infection of wheat byB.graminisf. sp.triticito full development of symptoms under appropriate conditions. In the presence of the host, the fungi are able to live through the hottest 10 days in July and August of each year, i.e., to oversummer in volunteer wheat seedlings or summer-sown wheat.Therefore, average temperature was selected mean of the hottest 10 days in July and August in 1951–2013, and maximum temperature was the hottest 1 day in July and August in 1951–2013. We also considered the effects of average daily precipitation, temperature and sunshine on the growth of volunteer wheat seedlings or summer-sown wheat and wheat powdery mildew in the oversummering period of disease. Accordingly, average precipitation, average relative humidity and sunshine duration were selected mean of July and August in 1951–2013. The temperature distribution has a certain correlation with latitude, altitude or longitude in China (Fang 1992). The temperature of the survey sites can be predicted by fitting the regression relationship between temperature and latitude, longitude or altitude. Liet al. (2013) was fitted with the regression relationship between the highest temperature of 10 days in different sites, the elevation, latitude and longitude, so as topredict the highest temperature of 10 days of survey sites of wheat powdery mildew. However, this method ignored the difference between the annual average temperature of the hottest 10 days, and the prediction results may be inaccurate. Therefore, this study took full account of the differences in the mean temperature of the hottest 10 days of the same survey in different years. The regression test was carried out by fitting the regression equation with the mean temperature, latitude, longitude or altitude of 752 sites by years. As well as combined a high-resolution digital elevation model, the interpolation resolution was greatly improved in this study.
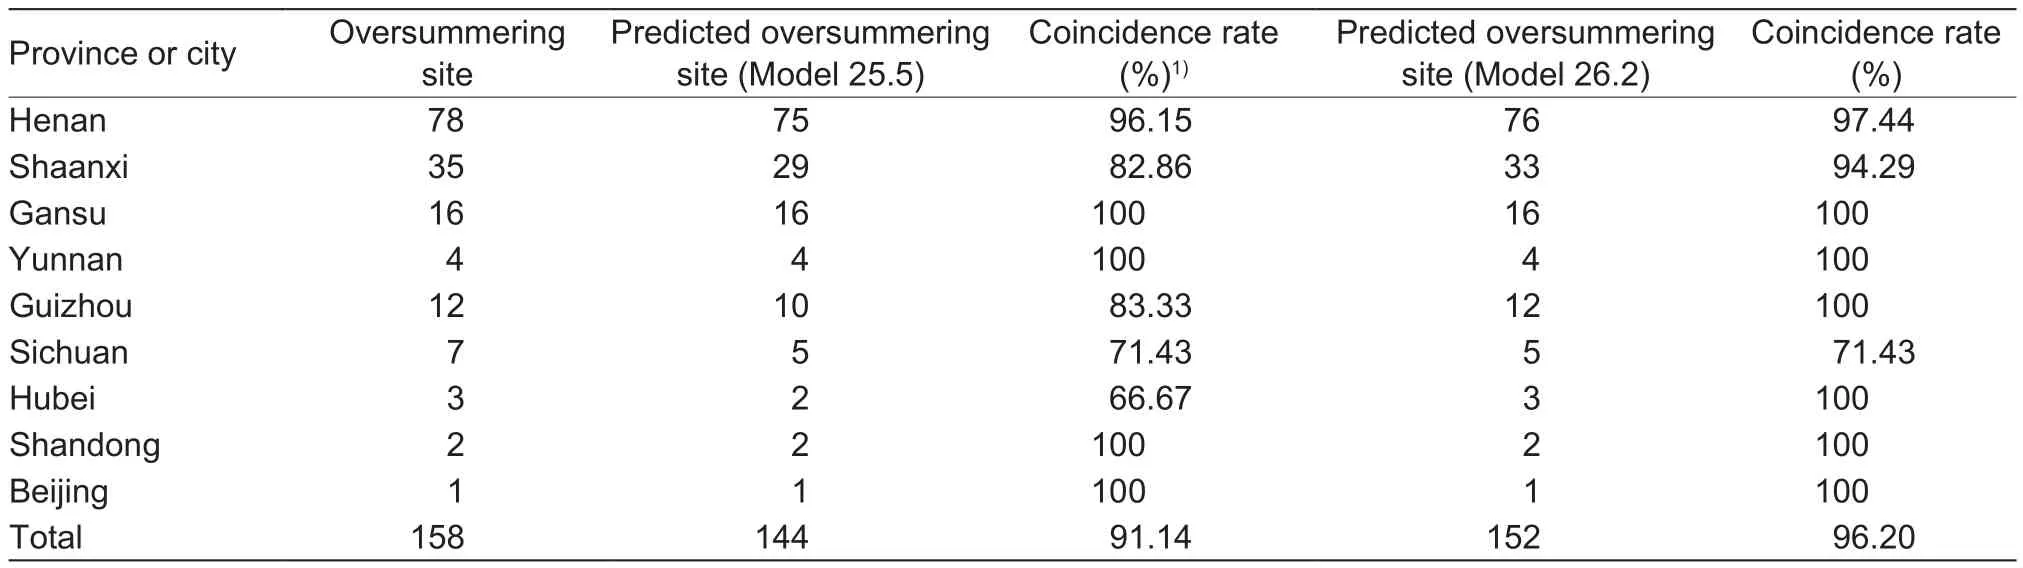
Table 4 Number of sites that Blumeria graminis f. sp. tritici can oversummer by survey and number of these sites that they can oversummer using the two models used in this study in each province or city
From the test results of oversummering sites, this study added additional 38 new oversummering sites (158 sites in total) on the basis of 121 ones selected by Liet al. (2013).Using the temperatures of the hottest continuous 10-day period below the termination threshold (25.5°C) (Model 1)and the temperatures equivalent to those terminating wheat powdery mildew growth (Model 2), Liet al. (2013) obtained overall coincidence rates of 89.26 and 90.91%, respectively,for oversummering regionalization. However, in this study,the coincidence rate for oversummering regionalization(Model 25.5) was 91.14% (Table 5), suggested that the method used for wheat powdery mildew oversummering regionalization in this study is more reasonable and yields more reliable results.
An IPCC report predicting the future climatic conditions indicates that the global temperature will rise at an average rate of 0.3°C per decade (the predicted range is between 0.2–0.5°C) (IPCC 1990). In China, the average yearly temperature has increased by 1.2°C since 1960 (Piaoet al. 2010). Differences in the temperature sensitivity ofB.graminisf. sp.triticiisolates collected from different provinces or cities in China in recent years and the frequency distribution ofB.graminisf. sp.triticiisolates with different sensitivities to temperature do not fit a normal distribution,which indicates that global climate change may influence the evolution ofB.graminisf. sp.tritici(Wanet al. 2010).Global warming and adaptive changes ofB.graminisf. sp.triticimay therefore have an effect on the oversummering and overwintering of wheat powdery mildew and even on the whole epidemic process of this disease. Therefore, the relationship between parasitism fitness and temperature of different temperature-sensitive ofB.graminisf. sp.triticiisolates should be deeply carried out, and the interaction model between different sensitive strains should be established to predict the trend of future pathogens,oversummering, overwintering and epidemic situation in climate change scenarios.
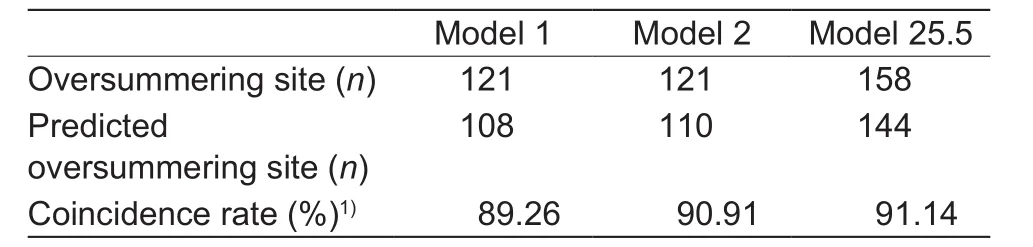
Table 5 Validation of models for predicting wheat powdery mildew oversummering in China
5. Conclusion
In this study, we pinpointed temperature as the most important meteorological factor determining the probability of wheat powdery mildew oversummering. Based on this finding, we used two different termination thresholds, i.e.,Model 26.2 and Model 25.5 to generate maps of wheat powdery mildew oversummering regionalization that also took into account digital elevation data. Model 26.2 had higher regionalization accuracy than Model 25.5 and was also more coincident with actual oversummering survey results. Thus Model 26.2 is a better model for generating maps of wheat powdery mildew oversummering regionalization. According to the map Model 26.2, the main oversummering zone in China are mainly concentrated in northern and southern Yunnan, northwestern Guizhou, northern and southern Sichuan, northern and southern Chongqing, eastern and southern Gansu, southeastern Ningxia, northern and southern Shaanxi, central Shanxi, western Hubei, western Henan, northern and western Hebei, western Liaoning,eastern Tibet, eastern Qinghai and western Xinjiang and other regions.
Acknowledgements
This work was financially supported by the National Natural Science Foundation of China (31271987), the National Key Research and Development Program of China(2016YFD0300702), the Special Fund for Agro-scientific Research in the Public Interest, China (201303016). Thanks to the platform support of Key Laboratory of Integrated Pest Management on Crops, Ministry of Agriculture, P.R.China.
Bennett F G A. 1984. Resistance to powdery mildew in wheat:a review of its use in agriculture and breeding programmes.Plant Pathology,33, 279–300.
Caidanzhuoma, Gang C W, Fang J R, Zhou Y L, Duan X Y,Zou Y F, Wan Q, Na T C. 2015. The sensitivity of population ofBlumeria graminisf. sp.triticiisolates to temperature in 2012.Plant Protection,41, 150–153. (in Chinese)
CCNA (The Compilation Committee of National Atlas). 1989.National Agricultural Atlas of the People’s Republic of China.China SinoMaps Press, Beijing. (in Chinese)
Duan S K, Wang B T, Liu C H. 1992. Status and analysis of wheat powdery mildew in Guanzhong area of Shaanxi Province.Journal of Triticeae Crops, 2, 48–51. (in Chinese)
Fang J Q, Xu Y Y, Chen F. 2013.Health Statistics. 7th ed.People’s Medical Publishing House, Beijing. (in Chinese)
Fang J Y. 1992. Study on the geografic elements affecting temperature distribution in China.Acta Ecologica Sinca,12, 97–104. (in Chinese)
Han L P, Fan J R,Zhou Y L, Zou Y F, Duan X J, Li N J, Zhu Y F. 2016. Temperature sensitivity and its correlation with virulence ofBlumeria graminisf. sp.tritici andisolates in some wheat growing areas in 2013.Acta Phytopathologica Sinica, 46, 394–400. (in Chinese)
He J B, Song Y L, Zhang Z S, He W L. 1998. Wheat powdery mildew and control. I. Distribution, symptom and harm of wheat powdery mildew.Journal of Henan Agricultural Sciences, 1, 17–18. (in Chinese)
IPCC (Intergovernmental Panel on Climate Change). 1990.Climate Change. Cambridge Press, London.
Lei T W, Feng J Y, Duan J T, Guo Y W, Cai C L, Fu S H.1982. Preliminary study on occurrence regularity of wheat powdery mildew.Journal of Henan Institute of Science and Technology, 2, 19–25. (in Chinese)
Li B N. 2008. Zones of oversummering and overwintering of wheat powdery mildew based on GIS. MSc thesis, Graduate School of Chinese Academy of Agricultural Sciences,Beijing.(in Chinese)
Li B N, Cao X R, Chen L, Zhou Y L, Duan X Y, Luo Y, Fitt B D L, Xu X, Song Y, Wang B, Cao S. 2013. Application of geographic information systems to identify the oversummering regions ofBlumeria graminisf. sp.triticiin China.Plant Disease,97, 1168–1174.
Li H. 1987. Infection cycle of wheat powdery mildew in Sichuan Basin.Journal of Southwest University, 2, 159–165. (in Chinese)
Li J P. 1986. Occurrence and control of wheat powdery mildew in Shangluo.Shaanxi Journal of Agricultural Sciences, 2,38–39. (in Chinese)
Li T X. 2013. Research progress of wheat powdery mildew forecasting method.Meteorological and Environmental Sciences, 36, 44–48. (in Chinese)
Liu Q J, Liu Q J, Tang Y L, Zhang B S. 1992. Epidemiology and control of wheat powdery mildew.Shandong Agricultural Sciences, 6, 19–22. (in Chinese)
Liu W C, Shao Z R. 1994. Epidemiology, occurrence and analysis of wheat powdery mildew in recent years.Plant Protection Technology and Extension, 6, 17–20. (in Chinese)
Liu W C, Shao Z R. 1995. Analysis of the causes and trends of wheat powdery mildew in China.Plant Protection Technology and Extension, 6, 7–8. (in Chinese)
Liu X K, Zhou Y L, Liang G D. 1990. Investigation on the oversummering of asexual generation ofErysiphe graminisf. sp.triticiin Nanyang.Plant Protection, 1, 33. (in Chinese)
Metz C E. 1978. Basic principles of ROC analysis.Nuclear Medicine, 8, 283–298.
Ming Z Y, Wang B T, Zhou Y L, Duan X Y, Zou Y F. 2012. The sensitivity of population ofBlumeria graminisf. sp.triticiisolates to temperature in 2009.Acta Phytopathologica Sinica, 42, 290–296. (in Chinese)
Piao S, Giais P, Huang Y, Shen Z, Peng S, Li J, Zhou L, Liu H,Ma Y, Ding Y, Friedlingstein P, Liu C, Tan K, Ye Y, Zhang T, Fang J. 2010. The impacts of climate change on water resources and agriculture in China.Nature, 467, 43–51.
Shi P G, Wan J H. 1983. Research overview ofBlumeria graminisf. sp.tritici.Hubei Agricultural Sciences, 1, 36–40.(in Chinese)
Tu J H, Li Y, Liao H M, Xu X C, Chen B. 1999. Study on epidemic regularity of wheat powdery mildew in Sichuan.Southwest China Journal of Agricultural Sciences, 12,61–64. (in Chinese)
Wan Q, Ding K J, Duan X Y, Zhou Y L. 2010. Sensitivity of population ofBlumeria graminisf. sp.triticiisolates to temperature in 2008.Acta Phytopathologica Sinica, 40,106–109. (in Chinese)
Wang S T. 1984. Study on the inoculum of primary infection of wheat powdery mildew.Hubei Agricultural Sciences, 11,19–23. (in Chinese)
Wu M Z, Yan S H, Hu G Q. 1984. Oversummering and overwintering of wheat powdery mildew and study on its biological characteristics.Guizhou Agricultural Sciences,3, 31–36. (in Chinese)
Zhang Z D, Li Z Q, Zong Z F. 1993. The laws of occurrence of powdery mildew of wheat in central area of Shaanxi Province.Journal of Northwest Sci-Tech University of Agriculture and Forestry, 21, 25–31. (in Chinese)
Zhang Z H. 1983. Preliminary study on the occurrence regularity and control of wheat powdery mildew in Zibo.Zibo Agricultural Science and Technology, 1, 9–16. (in Chinese)
 Journal of Integrative Agriculture2018年4期
- Journal of Integrative Agriculture的其它文章
- Climate change and Chinese farmers: Perceptions and determinants of adaptive strategies
- Estimating the average treatment effect of adopting stress tolerant variety on rice yield in China
- lmmunogenicity and protective efficacy of DHBV DNA vaccines expressing envelope and capsid fusion proteins in ducks delivered by attenuated Salmonella typhimurium
- Effects of conditioners (single-layer, double-layer and retentionconditioner) on the growth performance, meat quality and intestinal morphology of growing and finishing pigs
- Sub-lethal effects of Beauveria bassiana (Balsamo) on field populations of the potato tuberworm Phthorimaea operculella Zeller in China
- Streptomyces sp. RP1A-12 mediated control of peanut stem rot caused by Sclerotium rolfsii