
Dye-tolerant marine Acinetobacter baumannii-mediated biodegradation of reactive red
2018-02-20 08:55:02SnehaUnnikrishnanMohdHashimKhanKarthikeyanRamalingam
Water Science and Engineering 2018年4期
Sneha Unnikrishnan,Mohd Hashim Khan,Karthikeyan Ramalingam*
School of Life Sciences,B.S.Abdur Rahman Crescent Institute of Science and Technology,Chennai 600048,India
Abstract The objective of this study was to isolate a potent dye-degrading microbe that can be used to reduce the pollution caused by industrial dyes.Reactive red 198 is an extensively used textile dye and is a major environmental pollutant in water bodies.In this study,a bacterial strain was isolated from sea sediments and identified as Acinetobacter baumannii with 16S rRNA sequencing.The isolated bacteria were immobilized in calcium alginate and decolorization studies were carried out to determine the optimum pH,temperature,dye concentration,inoculum volume,and static/agitated condition using the one factor at a time(OFAT)approach.The Box-Behnken design,a type of response surface methodology,was adopted to improve the degradation efficiency.At 37°C using an inoculum volume of six beads,96.20%decolorization was observed in 500 mg/L of reactive red 198 after 72 h.Dye degradation was confirmed with UV-visible spectroscopy and Fourier-transform infrared(FTIR)spectroscopy studies of the dye and degraded metabolites.Microbial toxicity studies using Escherichia coli,Staphylococcus aureus,and Pseudomonas aeruginosa and phytotoxicity studies using Vigna radiata proved that the toxicity of the dye was significantly reduced after degradation.We can conclude that the isolated A.baumannii strain is an efficient dye-degrading microbe that can be used to reduce the pollution caused by industrial dyes.
Keywords:Immobilization;Box-Behnken design;Response surface methodology;Microbial toxicity;Dye degradation
1.Introduction
Textile dyes are one of most prevalent environmental pollutants.Many of these are azo dyes,which are highly recalcitrant and remain in the environment for a very long period of time.They pose a major threat to the flora and fauna in water bodies and decrease the photosynthetic rate of aquatic plants(Silveira et al.,2009;Koyani et al.,2013).Moreover,many azo dyes are carcinogenic and mutagenic(Banat et al.,1996;Forgacs et al.,2004).
Over the years,several methods have been effectively utilized to degrade these synthetic dyes.Broadly,the methods can be grouped into three types:physical(adsorption,coagulation),chemical(advanced oxidation process,Fenton's reagent),and biological(bacteria,fungi)methods(Azmi et al.,1998;Aguiar and Ferraz,2007;Daneshvar et al.,2007).The physical and chemical methods have certain disadvantages,such as sludge production,high cost,energy intensiveness,production of toxic by-products,and increased downstream processing steps(Cooper,1993;Hu,2001;Balaji et al.,2007;Hamid and Rehman,2009).Unlike physical and chemical means,biological methods of dye degradation are environmentally friendly,feasible,and cost-effective(Chen et al.,2007;Tony et al.,2009;Saratale et al.,2011;Wu et al.,2011;Koyani et al.,2013).
The objective of the present study was to isolate a bacterial strain capable of degrading reactive red 198(an azo dye)that could beutilized for reducing the pollution caused by reactive red 198.This dye is used extensively in the textile industries,has been found to be mutagenic and carcinogenic,and causes environmental pollution(Barikbin etal.,2017).The isolated bacterial potential to degrade the dye was optimized and the bacterium was immobilized in calcium alginate beads,because the use of immobilized bacterial cells is considered to be more efficient than the use of free cells and also involves higher biomass loading,an easier mode of solid-liquid separation thereby reducing downstream processing steps,a higher rate of biodegradation,a capability of reuse,and greater operational stability.This limited access to the microcapsule interior is one of the main advantages of microencapsulation,as it protects the biocatalyst from the harsh environmental conditions.Like most immobilization methods,it prevents biocatalyst leakage,increasing the processing efficiency as a result(Park and Chang,2000).
2.Materials and methods
2.1.Dye
Reactive red 198 was provided by Yellow Dyers,in Tirupur,Tamil Nadu,India.The molecular weight of reactive red 198 is 967.5 g/mol,its PubChem ID is 6506390,and its formula is C27H18ClN7Na4O16S5.Its maximum light absorption wavelength is 530 nm.It is an azo dye commonly used in various industries such as textile dyeing,tanneries,and printing.This dye was used without any purification for all the studies.
2.2.Isolation and identification of bacteria from sea sediments
Sea sediments were collected under aerobic conditions from the Kovalam sea shore in Tamil Nadu,India.The sediments were plated on reactive red 198 dye containing Luria-Bertani(LB)agar.The bacterial strain that could tolerate up to 10 g/L of the reactive red 198 dye was selected for further studies.The selected bacterial isolates were confirmed for their decolorization potential by isolating the culture with reactive red 198-amended LB broth.
2.3.16S rRNA sequencing
Genomic DNA was extracted from the bacteria using the Qiagen DNeasy kit.16S rRNA genes of these isolates were amplified using universal forward and reverse 16S rDNA primers 8F(AGAGTTTGATCCTGGCTCAG)and 1541R(AAGGAGGTGATCCAGCCGCA).The polymerase chain reaction(PCR)product was then sequenced using the 27F/1492R primers.Sequencing reactions were conducted using ABI PRISM®BigDye™ Terminator cycle sequencing kits with AmpliTaq®DNA polymerase(FS enzyme,Applied Biosystems).Single-pass sequencing was performed on each template using 16S rRNA universal primers and then electrophoresis was performed in an ABI 3730xl sequencer(Applied Biosystems).
The 16S rRNA sequence was then submitted to a National Center for Biotechnology Information(NCBI)blast similarity search tool to identify closely related sequences.Multiple sequence alignment was carried out for the closely related sequences using MUSCLE 3.7(Edgar,2004).The aligned sequences were cured using Gblocks 0.91b(Talavera and Castresana,2007)and a phylogentic tree was constructed in the program PhyML 3.0 aLRT using HKY85 as the substitution model.Tree rendering was conducted by the program Tree Dyn 198.3(Dereeper et al.,2008).
2.4.Decolorization studies
A reaction mixture of 50 mL consisting of 500 mg/L of reactive red 198 dye amended in LB broth was inoculated with 1 mL of the isolated bacterial strain and incubated at 37°C for 72 h.Then,the reaction mixture was centrifuged for 15 min at 4000 rpm and the supernatant was used to assess the dye decolorization rate.Dye decolorization was measured by monitoring the decrease in absorbance of the dye in an UV-visible spectrophotometer(Eppendorf,India)at a wavelength of 530 nm(Satar and Husain,2011).Dye decolorization rateEwas expressed in terms of percentage as in Eq.(1):
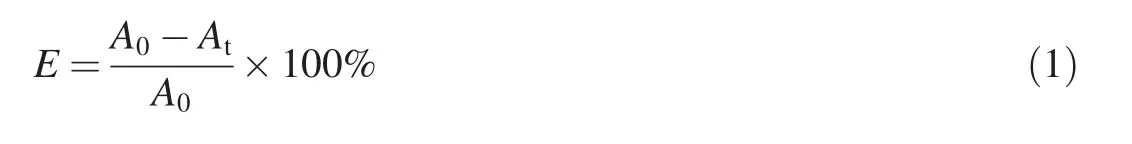
whereA0is the initial absorbance andAtis the final absorbance.
2.5.Immobilization of bacterial cells in calcium alginate
The bacterial cells were encapsulated in calcium alginate beads(Bettman and Rehm,1984).Immobilization by encapsulation in calcium alginate beads leads to the formation of stable beads,which can be reused.Sodium alginate with a concentration of 30 g/L was mixed with boiling water.After cooling,a volume percent of 5%of the bacterial culture(OD600=0.4,whereOD600is the optical density measured at a wavelength of 600 nm)was added to the sodium alginate solution and stirred continuously.This sodium alginate/cell mixture was extruded dropwise into cold sterile 0.2 mol/L calcium chloride solution through a syringe to form 2 mmdiameter calcium alginate beads.Sodium alginate when mixed with calcium chloride gives rise to calcium alginate beads.The calcium alginate beads were re-suspended into a fresh calcium chloride solution and refrigerated overnight for improving hardness and stability.
2.6.Optimization of physiochemical parameters
Immobilized bacterial cells were placed in a 10-mL LB broth medium containing designated concentrations of the dye.To determine the effects of operating conditions on dye degradation rate,the decolorization experiments were carried out at various pH levels(3,5,7,9,and 11),temperatures(30°C,40°C,50°C,60°C,and 70°C),dye concentrations(200,400,600,800,and 1000 mg/L),inoculum volumes(2,4,and 6 beads),and incubation conditions(static/agitated at 150 rpm).The immobilized beads were placed in a decolorization medium containing reactive red 198.The resulting solution was statically incubated at 37°C for decolorization(Illanjiam and Kantha,2012).
2.7.Optimization of process variables
Response surface methodology(RSM)is the combination of statistical and mathematical tools for the prediction of optimal conditions using minimum runs.The three-level factorial Box-Behnken design(BBD)was used to study the interactions of three variables,temperature,incubation time,and inoculum volume,based upon the one factor at a time(OFAT)approach.The experimental ranges used in the Box-Behnken design are shown in Table 1.
2.8.Extraction of degraded metabolites
The degraded metabolites were extracted using an equal volume of ethyl acetate and dried over anhydrous sodium sulphate to remove moisture.This sample was then further dried in a rotary evaporator till the moisture content was completely evaporated and the sample was in a powder form(Shah,2016).
2.9.UV-visible spectrophotometric analysis
The dye and its degraded metabolites obtained after extraction suspended in water were studied using a UV-visible spectrophotometer to investigate the change in UV-visible spectra before and after decolorization.The supernatant of 2 mL was taken and an absorption spectrum from 300 nm to 800 nm was recorded using a Jasco UV-visible spectrophotometer.
2.10.Fourier-transform infrared(FTIR)analysis
The dye and its degraded metabolites were dried and the powder was subjected to FTIR analysis using a Jasco FT/IR-6300 spectrometer with a wave number accuracy of 0.07 cm-1.The percentage transmittance was observed from the wave number of 400-4000 cm-1.The difference in peaks between the dye sample and the degraded dye sample were observed and noted.
2.11.Toxicity studies
2.11.1.Microbial toxicity
The microbial toxicity of the original and decolorized dye samples was determined against test microbes includingEscherichia coli,Pseudomonas aeruginosa,andStaphylococcus aureususing agar well diffusion assay.Active test cultures were seeded on the nutrient agar plates(0.01 g/mL).A single well was bored at the center of the nutrient agar plate.The wells were filled with 100 μL of the 500 mg/L of original and decolorized solutions of reactive red 198.The plates were incubated for 24 h at 37°C and the zone of inhibition(in mm)was measured as an index of toxicity(Pradhan and Babu,2012).
2.11.2.Phytotoxicity studies
Vigna radiata(green gram)seeds were used for testing the phytotoxicity of dye and its degraded metabolites.V.radiataseeds(n=20,wherenis the sample size)were soaked overnight in sterile water(control).Reactive red 198(500 mg/L)in sterile water and degraded metabolites dissolved in autoclaved water.The seeds were then placed in a petri dish containing cotton soaked in respective solutions.This was then incubated at room temperature for 48 h.
2.12.Comparison study with commercially available strains
The commercially available strains ofAcinetobacter baumannii(Microbial Type Culture Collection(MTCC)1920 and American Type Culture Collection(ATCC)19606)were purchased and a comparative study on the decolorization rate was conducted.50 mL of LB broth containing 500 mg/L of reactive red 198 dye was inoculated with 1 mL of inoculum(overnight culture withOD600=0.4)(MTCC and ATCC cultures separately).After 72 h,the reaction mixture was centrifuged at 4000 rpm for 15 min and the absorbance of the supernatant was measured at a wavelength of 530 nm.The decolorization rate was calculated and the results were compared with that of the sea sediment isolate.
2.13.Enzyme assays
The protein content was determined using the method of Lowry et al.(1951)with bovine serum albumin as the standard.
Laccase activity was determined using guaiacol as the substrate according to the method of Arora and Sandhu(1985).The assay mixture contained 4.80 mL of sodium phosphate buffer(pH 6.0,0.1 mol/L),0.1 mL of guaiacol(0.01 mol/L),and 0.1 mL of enzyme extract.One activity unit(U)was defined as the amount of enzyme that oxidized 1 μmol of guaiacol per minute.The kinetic reaction was spectrophotometrically recorded at a wavelength of 470 nm(ε=21600 L/(mol·cm),where ε is the absorptivity coefficient)using a UV-visible spectrophotometer.
Lignin peroxidase activity was estimated as per the procedure of Tien and Kirk(1983).The reaction mixture contained 0.25 mL of enzyme,0.25 mL of 1 mmol/L veratryl alcohol,0.25 mL of 0.2 mmol/L of H2O2,and 0.5 mL of 0.1 mol/L citrate buffer.The increase in absorbance was measured at a wavelength of 310 nm,due to oxidation of veratryl alcohol to veratraldehyde.
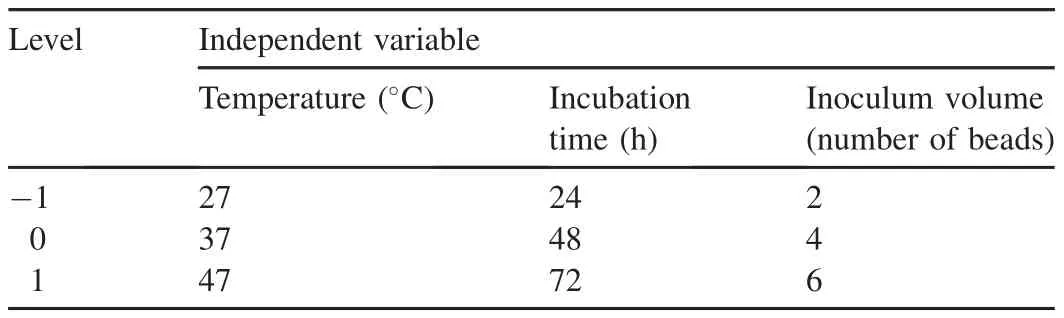
Table 1 Experimental range and levels of independent variables for reactive red 198 decolorization.
For azoreductase assay,the reaction mixture consisted of 400 μL of potassium phosphate buffer with 200 μL of sample and 200 μL of reactive dyes(500 mg/L).The reaction was started by addition of 200 μL of NADH and was monitored spectrophotometrically at a wavelength of 502 nm.The linear decrease of absorption was used to calculate the azoreductase activity(Maier et al.,2004).One unit of azoreductase can be defined as the amount of enzyme required to decolorize 1 μmol of dye per minute.
Veratryl alcohol oxidase(VAO)activity was measured by estimating oxidation of veratryl alcohol at a wavelength of 310 nm in a reaction mixture containing 1 mmol/L of veratryl alcohol in a 0.1 mol/L citrate phosphate buffer(pH 3.0)and 0.2 mL of enzyme(Waghmode et al.,2012).
NADH-DCIP reductase activity was determined using a procedure reported earlier by Salokhe and Govindwar(1999).The assay mixture contained 50μmol/L of DCIP,28.57 mmol/L of NADH in 50 mmol/L potassium phosphate buffer(pH 7.4),and 0.1 mL of enzyme solution in a 5-mL volume.The DCIP reduction was monitored at a wavelength of 595 nm using an extinction coefficient of 90 mL/(mol·cm).Enzyme assay was carried out where reference blanks contained all components except the enzyme.Enzyme assays were performed in triplicate and average rates were calculated.
3.Results and discussion
3.1.Bacterial isolation and identification
A bacterial strain capable of surviving even at 10 g/L of reactive red 198 dye was isolated and its decolorization efficiency was checked.The bacteria were found to visibly decolorize reactive red 198 completely.The bacterial strain was identified to beA.baumanniiwith 16S rRNA sequencing.A.baumanniiis a short,rod-shaped gram negative bacterium occasionally found in environmental soil and water samples.There are only a few reports regarding the use of this bacterium in dye decolorization.The sequence was submitted to GenBank with an accession number of MF164041.Fig.1 represents the phylogenetic analysis results.
3.2.Decolorization studies
Decolorization studies suggested thatA.baumanniicould degrade(200-1000 mg/L)reactive red 198 in 72 h with a decolorization rate of 88%.The observed feature ofA.baumanniiis concordant with the decolorization rate ofA.baumanniiisolated from other sources.For example,A.baumanniiYNWH 226,an isolate from an activated sludge reactor treating textile wastewater,was able to degrade congo red up to 99%under aerobic conditions(Ning et al.,2014)andA.baumanniiMN3,an isolate from a crude oil sample was found to decolorize congo red by 89%and gentian violet by 90%(Kuppusamy et al.,2016).
Fig.2 shows the photographs of the reactive red 198 and its degraded metabolites.
3.3.Immobilization
To further improve the decolorization efficiency and stability,A.baumanniicells were immobilized using the calcium alginate encapsulation method.
Physiochemical parameters for optimal dye degradation were studied.It was found that the decolorization rate increased when the cells were immobilized.Immobilized cells were more efficient and stable,and could be reused.With the use of free cells,88%of decolorization rate was reached,whereas for immobilized cells the discoloration rate was 92%.C.I.Direct Red 80,at a concentration of 50 mg/L,was found to be decolorized up to 97.8%usingBacillus firmusimmobilized by entrapment in tubular polymeric gel(Ogugbue et al.,2012).Enterobacter cloacaeimmobilized in calcium alginate beads were reported to degrade congo red up to 1 g/L(Prasad and Aikat,2014).
3.4.Physiochemical parameter optimization using OFAT approach
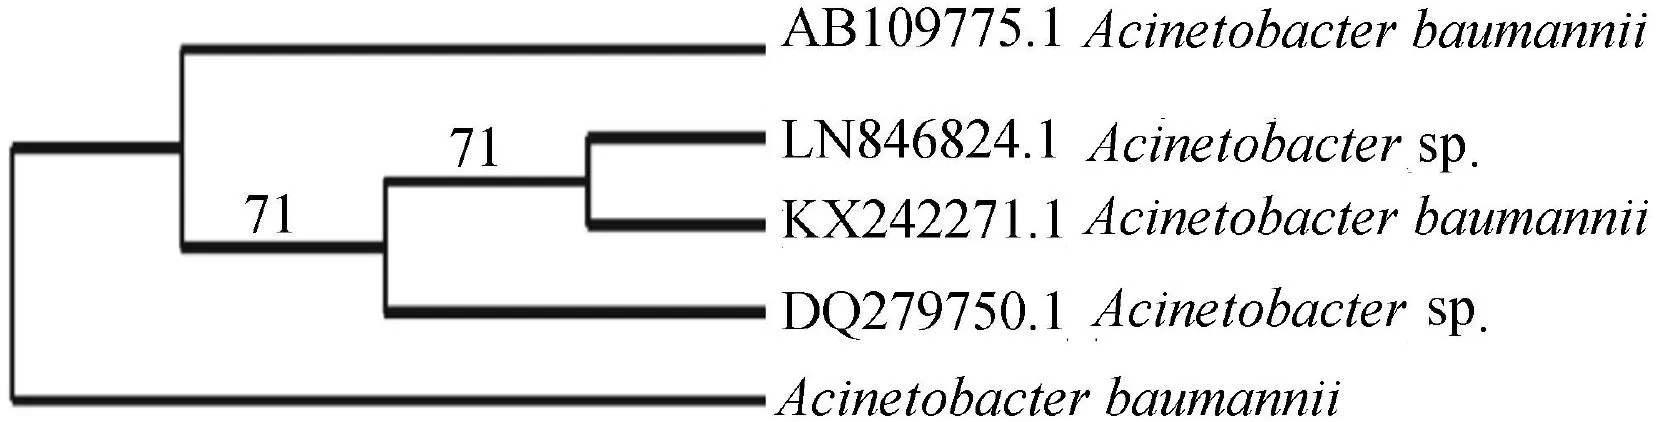
Fig.1.Phylogenetic analysis of 16S rRNA gene sequence of Acinetobacter baumannii.
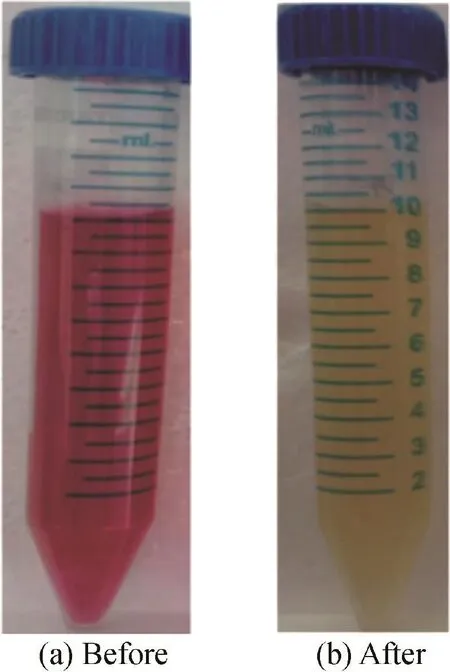
Fig.2.Photographs of reactive red 198 before and after decolorization with Acinetobacter baumannii.
Five different parameters,pH,temperature,dye concentration,inoculum volume,and static/agitated condition,were optimized using the OFAT approach.OFAT is a stepwise approach to finding the optimal conditions for decolorization.pH is a significant factor of the medium that can affect the decolorization rate considerably.The color and solubility of the dye changes with the medium pH.In addition,pH may affect the uptake of dye molecules through the cell membrane,which determines the rate of dye decolorization(Saratale et al.,2011).Decolorization studies at different pH levels suggested that optimum degradation of the dye byA.baumanniiwas achieved at a pH of 7(Fig.3(a)).
Generally,bacteria decolorize at around neutral pH levels(Solis et al.,2012;Kalme et al.,2007;Chang and Lin,2001;Suzuki et al.,2001).Previous studies have shown thatPseudomonas putida(Tripathi and Srivastava,2011),Pseudomonas ochrochloron(Shedbalkar and Jadhav,2011),andP.aeruginosaBSH(Jadhav et al.,2012)decolorize dye maximally at pH 7.Furthermore,the decolorization rate decreased with increases in deviation from the optimum pH.
The second parameter,incubation temperature,had a huge effect on azo dye decolorization.The optimal temperature was found to be a pre-requisite for azo dye decolorization by microbial consortia(Yu et al.,2001).It has been reported that bacteria decolorizes dye maximally when the optimal temperature for its growth and reproduction is maintained(Hazrat,2010).The optimal temperature for reactive red 198 degradation byA.baumanniiwas found to be 37°C(Fig.3(b)).At temperatures below and above 37°C,the decolorization rate was lower.This reduced decolorization rate could likely be due to the reduced cell viability,a lower reproduction rate,and loss of enzyme activity(Saratale et al.,2011;Solis et al.,2012).P.putidawas also found to optimally degrade dyes at 37°C(Tripathi and Srivastava,2011).
The maximal decolorization rate was 92.91%at a 200 mg/L dye concentration.As the concentration of dye increased,the decolorization rate gradually decreased(Fig.3(c)).However,A.baumanniiwas found to efficiently degrade reactive red 198 even at 1000 mg/L,with a decolorization rate of 84.01%.A.baumanniiwas reported to degrade azo dye more efficiently than many other microbes(Coughlin et al.,1999;Nachiyaar and Rajkumar,2003).Reduction of the decolorization rate upon increasing dye concentration could be due to the toxic effect of dyes on the microbe.It could also be due to decreasing biomass concentration and inhibition of azo reductase activity by the dye.Azo dyes with reactive sulphonic acid(SO3H)groups on their aromatic rings inhibited growth of microbes at higher concentrations(Chen et al.,2003).
As the number of immobilized beads added increased,the decolorization rate increased(Fig.3(d)).Beyond six beads,the rise in decolorization efficiency was minimal and hence six beads were considered the optimal volume of inoculum for 10 mL of dye solution.Alalewi and Jiang(2012)reported that 3 mL ofBurkholderia cepaciaTN5 andComamonas acidovoransTN1 inoculums per 25 mL of reaction mixture decolorized direct blue 75 and acid orange 7,respectively.
Under static anaerobic conditions,the bacterial decolorization rate was observed to be 88.55%,whereas under agitated conditions(at 150 rpm)the decolorization rate was only 13.07%(Fig.3(e)).This result was similar to that of the decolorization pattern ofPseudomonas luteola,Pseudomonas desmolyticum,andP.putida(Stolz,2001;Chang and Kuo,2000;Tripathi and Srivastava,2011).Azo dyes in general are not susceptible to bacterial attack under aerobic conditions.Azo dye decolorization usually occurs with enzymatic cleavage of azo bonds,which is inhibited by the presence of oxygen(Phugare et al.,2011).
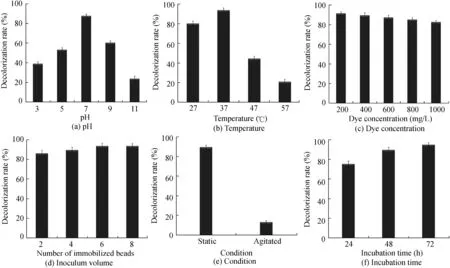
Fig.3.Optimization of operating conditions using OFAT approach(All the experiments were performed in triplicate and the probability is less than 0.05).
The decolorization rate increased as the incubation time increased(Fig.3(f)).After 72 h,the maximal decolorization rate of 94.02%was achieved.Phanerochaete sordidadecolorized reactive black 5 completely after 72 h(Permpornsakul et al.,2016).
3.5.Optimization using Box-Behnken design
BBD has often been used for optimization of operating conditions for dye decolorization.Papadopoulou et al.(2013)investigated the decolorization of Remazol brilliant blue R usingPleurotus pulmonarisAMRL 177 with BBD.Fazli et al.(2010)used BBD to optimize reactive blue 19 decolorization usingGanodermaspecies.BBD was conducted with three factors:incubation time,temperature,and inoculum volume.The design is given in Table 2 and the analysis of variance(ANOVA)for the response surface model is given in Table 3.
The final equation is
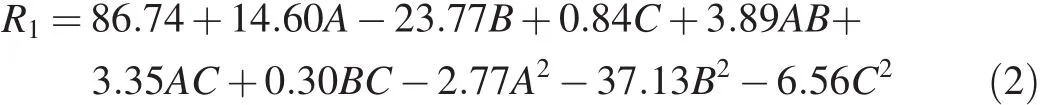
whereR1is the response;A,B,andCrepresent incubation time,temperature,and inoculum volume,respectively;and the other terms are the interaction of one variable against another.Their values are generated and given by the software(design expert).
A modelF-value of 73.87 indicates that the model is significant.There is only a 0.01%chance that this largeF-value can occur due to noise.p-values in Table 3 less than 0.05 indicate that the model terms are significant.In this caseA,B,B2,andC2are significant model terms.p-values greater than 0.10 indicate that the model terms are not significant.Alack of- fitF-value of 1.30 implies that the lack of fit is not significantly relative to the pure error.There is a 39.08%probability that this large lack-of- fitF-value could occur because of noise.
3.5.1.Adequacy of model
Generally,it is important to evaluate the fitted model to guarantee that it gives an adequate approximation of the results obtained in the experimental conditions.The predicted coefficient of determination(R2)of 0.9096 is in agreement with the adjustedR2of 0.9762;i.e.,the difference is less than 0.2(Myers and Montgomery,2002).Adequate precision measures the signal-to-noise ratio.A ratio greater than 4 is desirable.The ratio of 27.485 indicates an adequate signal.
3.5.2.Diagnostic plots
A normal probability plot is used to check for normality of the studentized residuals,as shown in Fig.4.The normality assumption is fulfilled if the plot of residuals is approximated down a straight line(Roriz et al.,2009).
A Box-Cox plot is used to help determine the most suitable power transformation to apply to response data.Fig.5 represents the Box-Cox plot for the given residuals and shows the recommended transformation,which is not favorable.In Fig.5,λ is the most appropriate power transformation to apply to response data,andRSSis the minimum residual sum of squares.
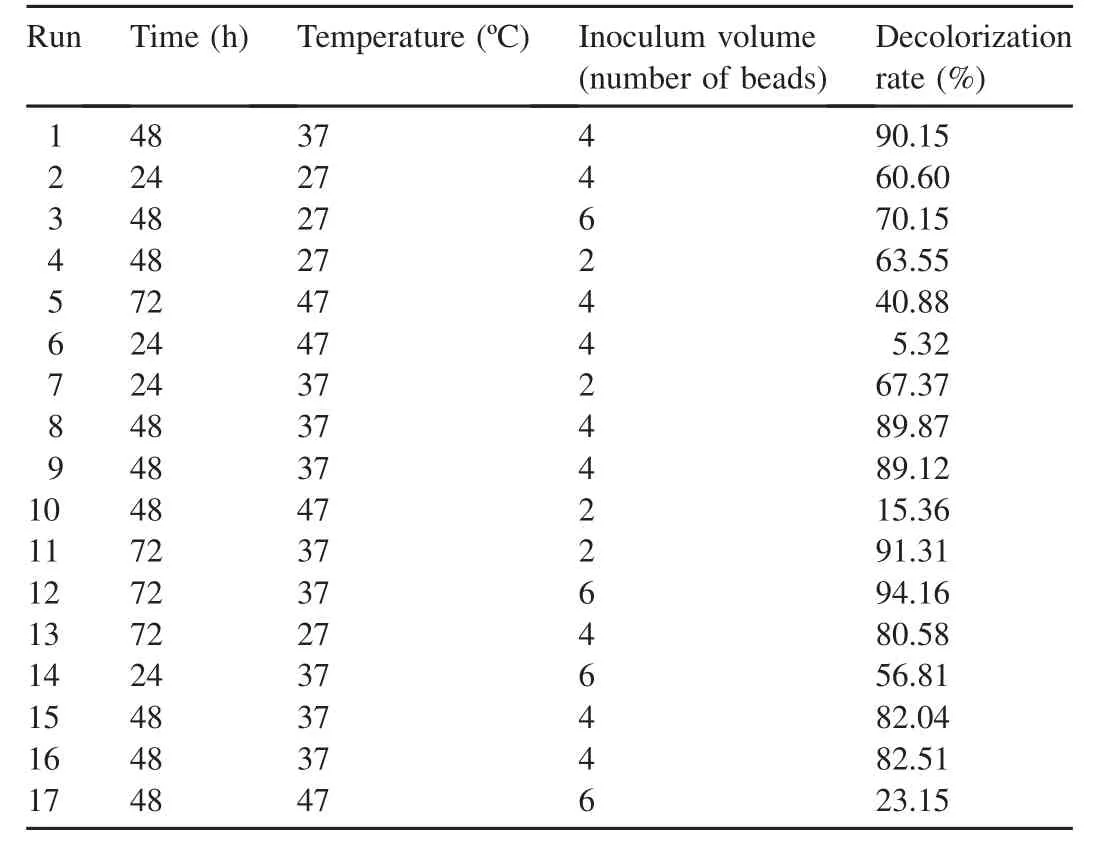
Table 2 Box-Behnken design for optimization of operating conditions during decolorization.
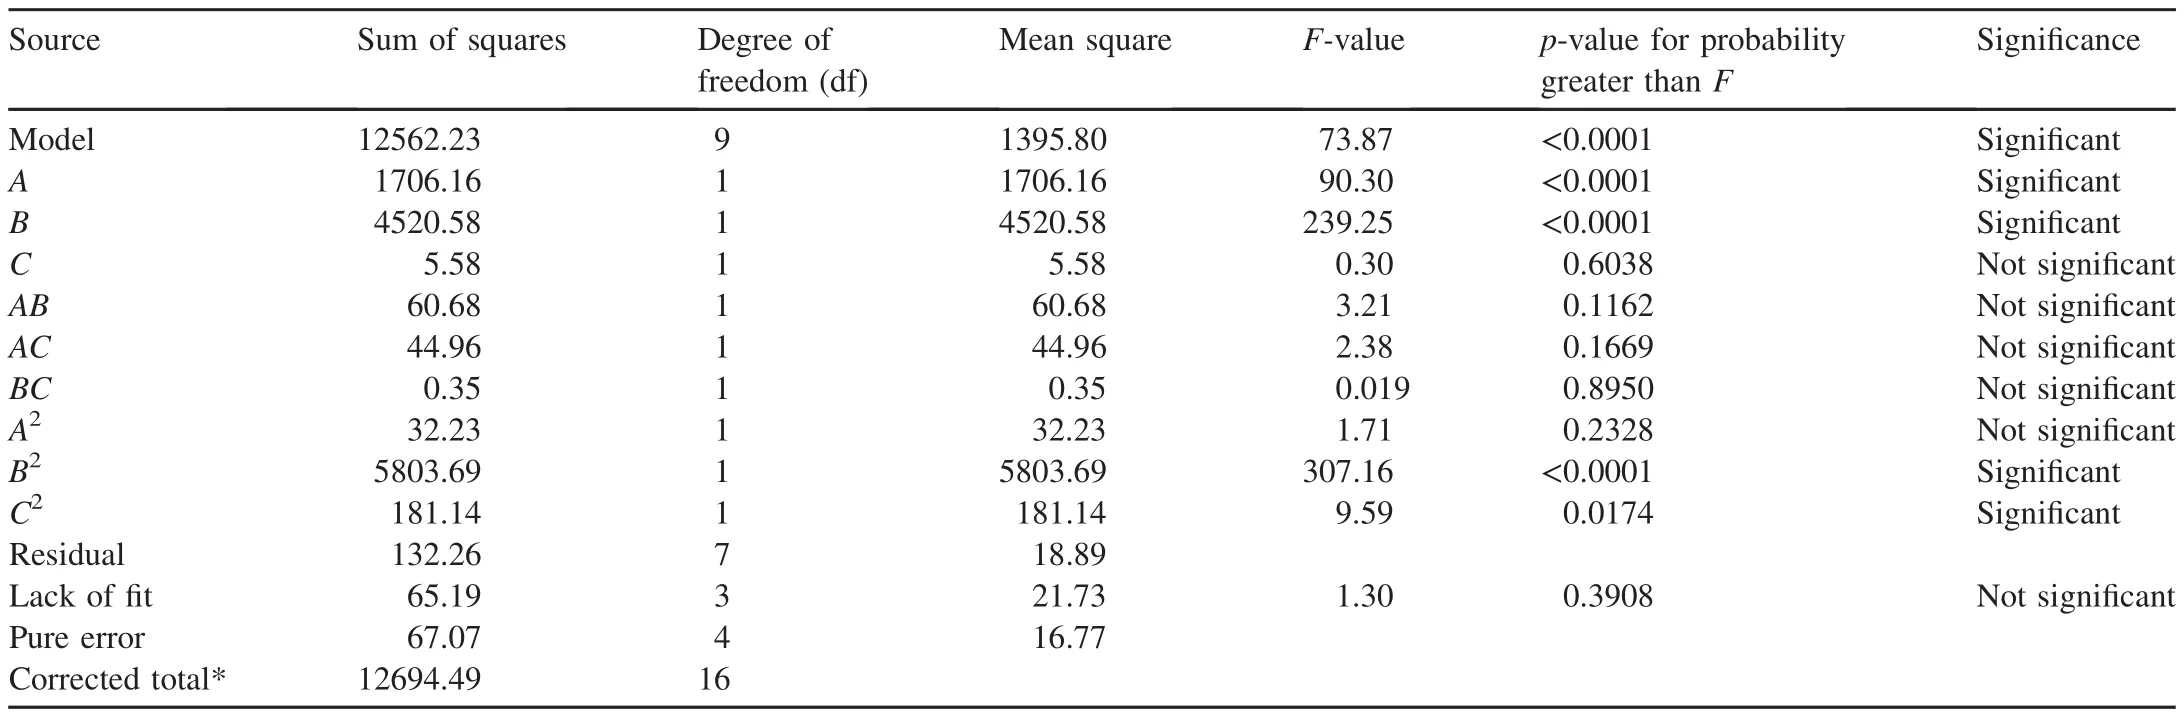
Table 3 ANOVA for response surface quadratic model.
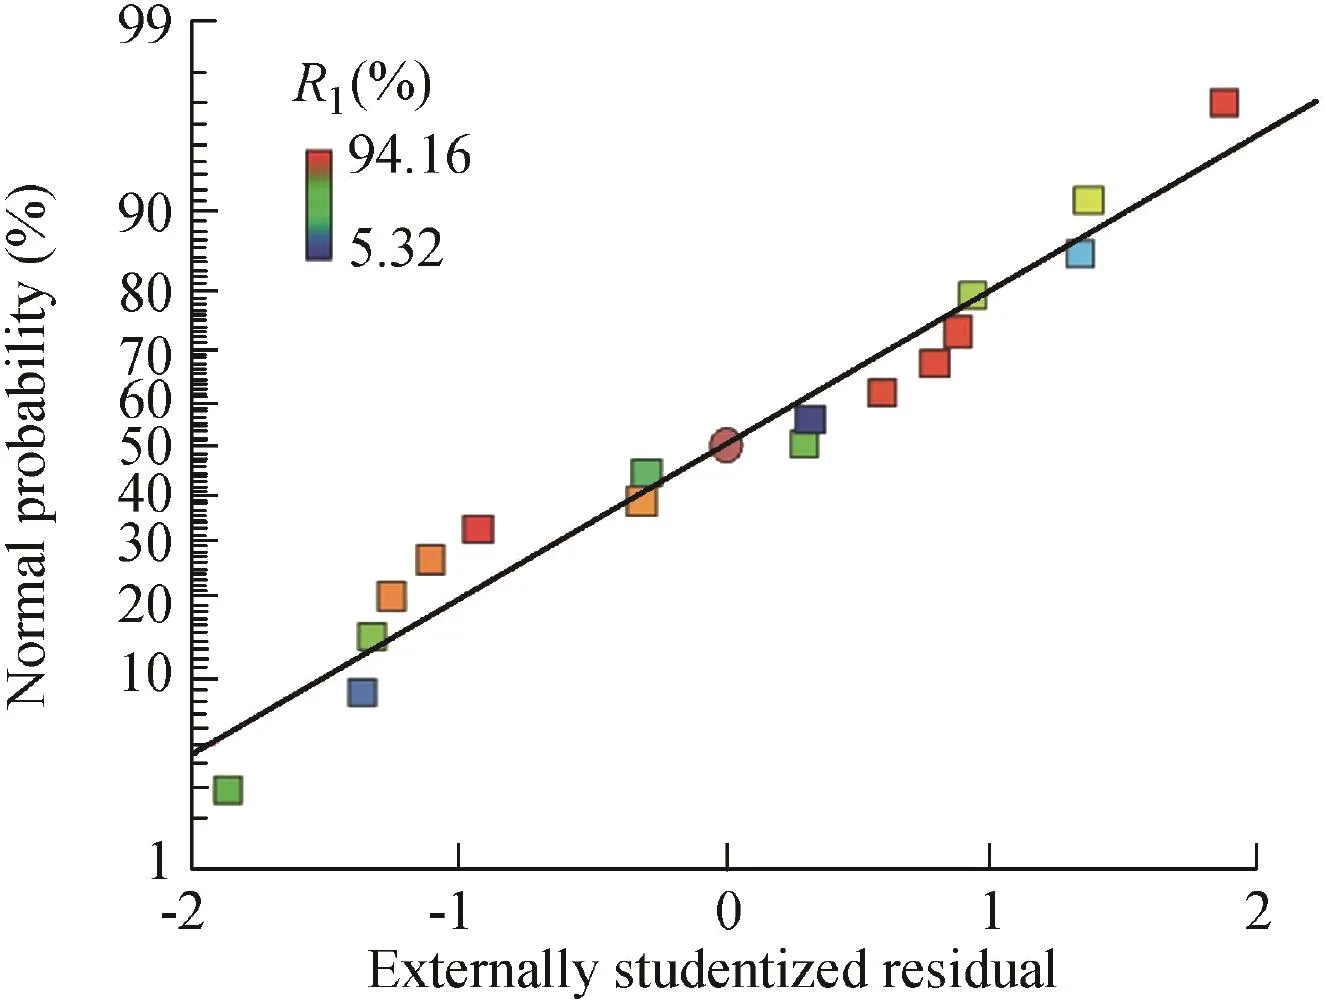
Fig.4.Normal probability plot of residuals.
A contour plot is a two-dimensional(2D)representation of the response plotted against combinations of numerical factors and/or mixture components.It shows the relationship between the responses, mixture components, and/or numerical factors.Fig.6 represents the interactions among the various factors.

Fig.5.Box-Cox plot for power transformation.
3.5.3.Model validation and experimental confirmation
In order to validate and verify the optimization results,an experiment was performed according to the process conditions(predicted conditions).For reactive red 198 decolorization,the experimental decolorization rate(95.58%)was in agreement with the predicted value(96.20%)at the optimal working conditions of a temperature of 37°C,an incubation time of 72 h,and an inoculum volume of six beads.
3.6.UV-visible spectrophotometric analysis
UV-visible spectroscopy is the foremost basic technique for identifying whether degradation has taken place or not(Saratale et al.,2011).The peaks of the dye that have maxima in the visible range shift towards the UV range after degradation.The UV-visible spectrum of reactive red 198(Fig.7)showed a maximal peak at a wavelength of 530 nm.The degraded metabolites showed a maximal peak at a wavelength of 350 nm.The shift in spectral maxima from visible to UV ranges indicates the degradation of reactive red 198.
3.7.FTIR analysis
In dye degradation studies,FTIR is a tool that enables determination of both the type and strength of interactions that occur within the azo dyes possessing various functional groups after bacterial degradation(Saratale et al.,2011).The FTIR spectra of the reactive red 198 and its degraded metabolites is shown in Fig.8.The peak at 3374.82 cm-1in the dye has been shifted to 3385.42 cm-1in the degraded metabolites,both of which indicate a hydrogen-bonded O-H stretch.In the dye solution,peaks at 1629.66 cm-1and 1558.20 cm-1suggest an N-H bend in the azo group.These peaks are not present in the degraded metabolites.This indicates that the azo bond has been broken.Instead there is a peak at 1678.45 cm-1in the degraded metabolites,which indicates a C=O stretch.The degraded metabolites also show an additional peak at 2925.48 cm-1,which indicates a C-H stretch.The dye has a peak at 1078.98 cm-1,which gets shifted in the degraded metabolites to 1128.15 cm-1,both representing a C=O stretch.There is a peak at 622.615 cm-1observed in the dye,which has shifted to 618.074 cm-1in the degraded metabolites,both of which represent a C-Br stretch.The dye has a peak at 422.334 cm-1,which indicates a C-I stretch.This peak is absent in the degraded metabolites.
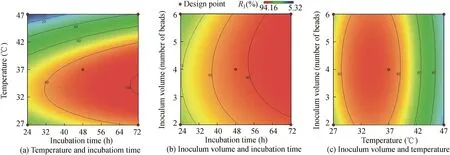
Fig.6.2D contour plots representing interactions between temperature,incubation time,and inoculum volume.
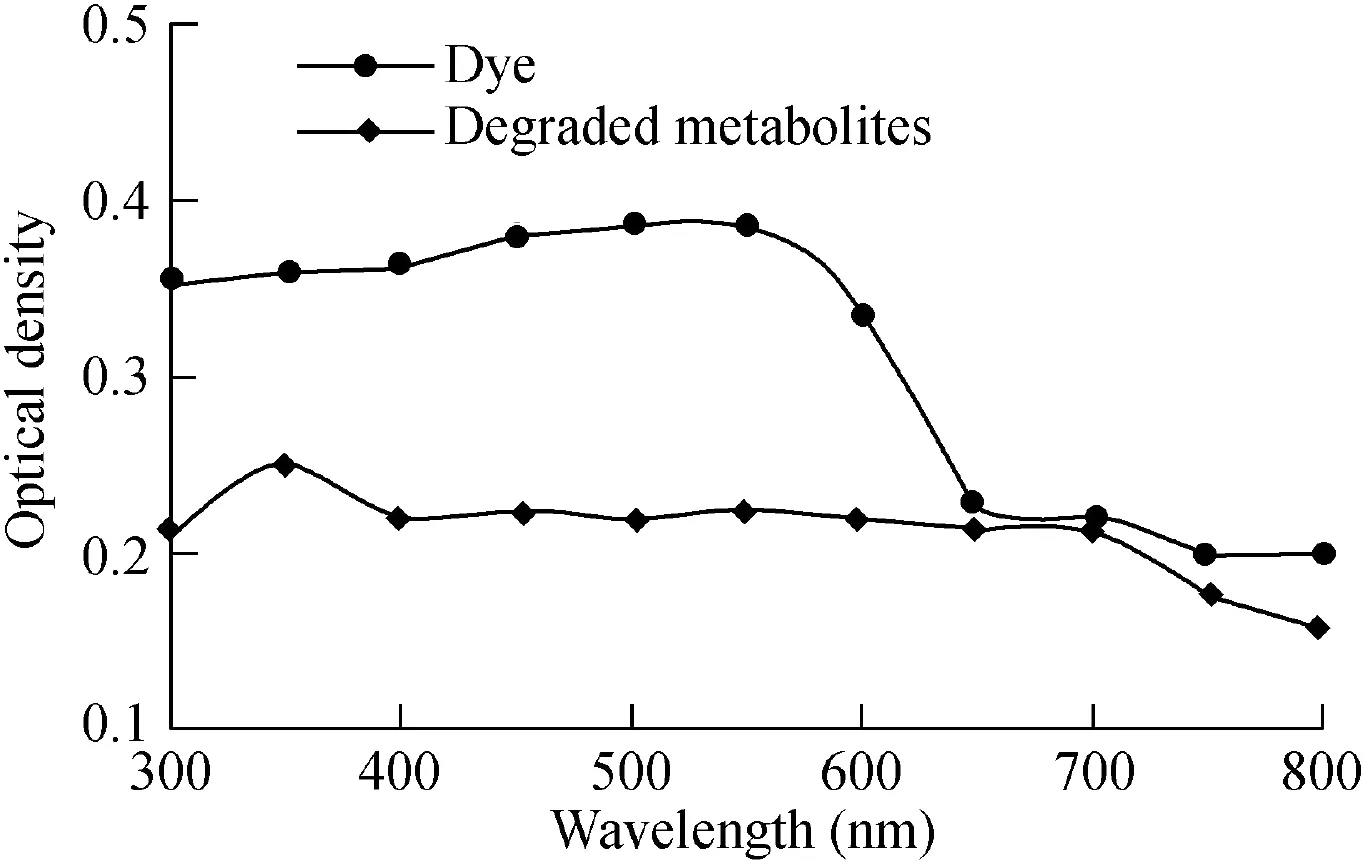
Fig.7.UV-visible spectrum of reactive red 198 and its degraded metabolites.
3.8.Toxicity studies
3.8.1.Microbial toxicity
Microbial toxicity study was performed withE.coli,S.aureus,andP.aeruginosa.In the agar diffusion method,a zone of inhibition surrounding the well containing reactive red 198 was observed for all the three bacterial strains.A maximum inhibition zone of 22 mm inS.aureusfollowed by the values forE.coli(21 mm)andP.aeruginosa(18 mm)was observed.The degraded metabolites of the dye did not show any zone of inhibition against these bacteria.This suggests that the toxicity of dye has been reduced after degradation.

Fig.8.FTIR analysis results of reactive red 198 and its degraded metabolites.
Crystal violet was degraded by Chen et al.(2008)usingStaphylococcus decolorationisNTOU1 and both the dye and its degraded products were checked onE.colifor their toxicity.The dye was found to be toxic whereas the degraded products were found to be non-toxic.Parshetti et al.(2011)degraded crystal violet usingA.radiobacter.They proved that the dye was toxic againstA.radiobacter,Acinetobacter vinelandii,andP.aeruginosawhile the degraded products were non-toxic.Shedbalkar et al.(2008)worked on the degradation of cotton blue usingP.ochrochloronMTCC 517.The microbial toxicity assay of the dye and its degraded product againstA.vinelandiishowed that the dye had an inhibitory effect whereas the degraded metabolites did not have any inhibitory effect.
3.8.2.Phytotoxicity studies
After 72 h,the lengths of the plumule and radicle ofV.radiataseeds were noted.All the seeds in the control,dye sample,and degraded dye sample had germinated.The lengths of the plumule and radicle of the control set were comparatively much longer than those of the seeds in the dye set.The degraded dye set had plumules and radicles of lengths similar to those of the control set.Fig.9 provides a graph representing the lengths of plumules and radicles in the three sets.Parshetti et al.(2011)reported a reduction in the toxicity levels of crystal violet degradation byA.radiobacterusingV.radiataplants.Thus,this study shows that the dye inhibits the growth of the seeds whereas the degraded metabolites are non-toxic to the seeds.
3.9.Comparative study with other Acinetobacter baumannii strains
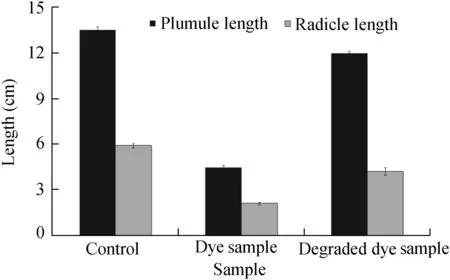
Fig.9.Lengths of plumule and radicle of Vigna radiata in control,dye,and degraded dye samples.
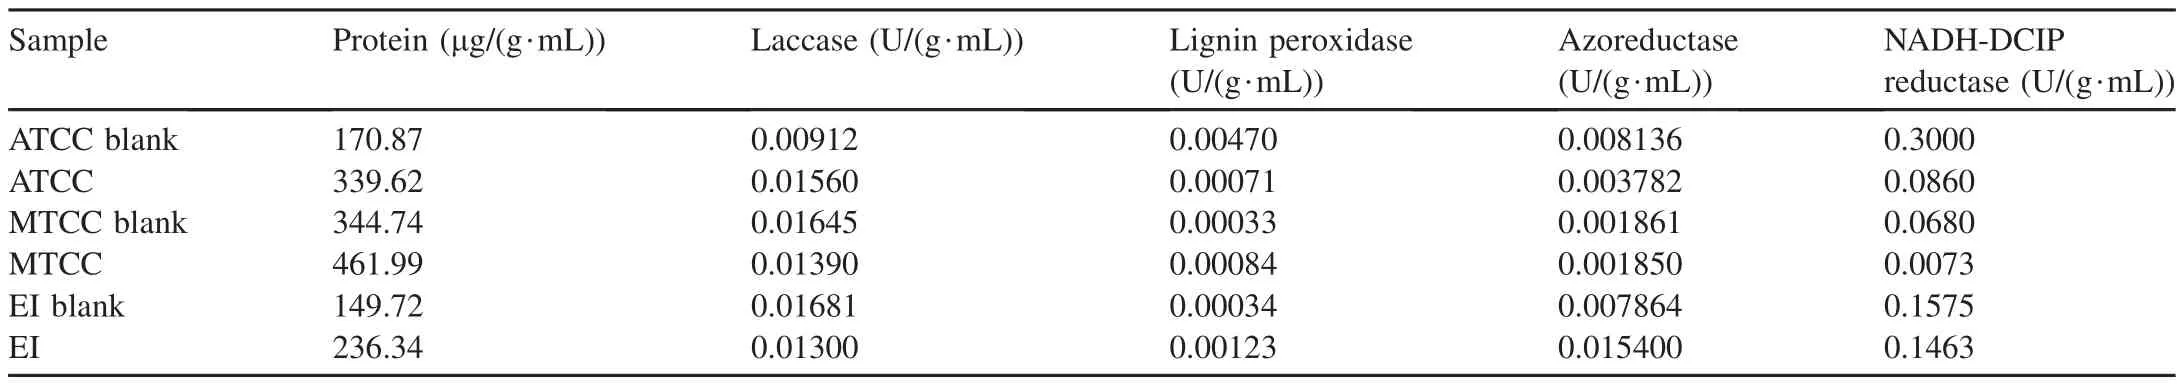
Table 4 Comparison of various enzyme levels present in different Acinetobacter baumannii samples before and after dye degradation.
Decolorization studies were performed withA.baumanniistrains purchased from MTCC and ATCC against the same dye:reactive red 198.The MTCC 1920 strain showed 80.82%decolorization whereas the ATCC 19606 strain showed only 6.25%decolorization.TheA.baumanniistrain of bacteria isolated from the sea sediments showed 88%decolorization under the same conditions.This proved that the isolated strain was more effective in decolorizing dyes when compared to the commercially available strains in MTCC and ATCC.Due to the continuous exposure of extreme conditions in the sea,the environmental strains prove to be more stable and active than the strains preserved in the culture banks.
3.10.Enzyme extraction
Enzymes were extracted from all three strains ofA.baumannii.All enzyme assays were run in triplicate,average rates were calculated,and one unit of enzyme activity was defined as a change in absorbance per minute per mg of protein.
Various enzyme assays were performed and the enzyme levels in differentA.baumanniisamples are shown in Table 4.Protein concentration was found to increase in ATCC,MTCC,and environmental isolate(EI)after dye degradation.
The biodegradation of synthetic azo dyes was primarily due to their biotransformation by various oxidative and reductive enzymes(Raghukumar et al.,1996).
Laccase enzyme expression was found to increase only in the ATCC culture.It was found to decrease in the MTCC and marine isolate cultures.Hence,laccase did not seem to play a major role in dye degradation.
Lignin peroxidase and azoreductase enzymes were found to increase in the marine isolate after dye degradation,whereas in the MTCC and ATCC cultures the lignin peroxidase and azoreductase enzymes were found to decrease after dye degradation.Hence,lignin peroxidase and azoreductase were maximally induced in marine isolates.Providenciasp.SDS was also found to degrade textile effluents through a developed bacterial consortium due to the presence of laccase and azo reductase activities(Phugare et al.,2011).The purified lignin peroxidase fromBrevibacillus laterosporusMTCC 2298 andAcinetobacter calcoaceticusNCIM 2890 efficiently decolorized various sulfonated azo dyes(Gomare et al.,2008).
It was found that the amounts of VAO present in all the samples were in negligible amounts.It can be concluded that VAO does not play a role in degradation withA.baumannii.
The NADH-DCIP reductase activities were almost equivalent in the marine isolate before and after dye degradation,whereas the enzyme quantity was significantly lower in the ATCC and MTCC cultures after dye degradation.
Significant induction in laccase(60%),azo reductase(159%),and NADH-DCIP reductase(88%)activities from decolorized medium cells indicates the active involvement in the breakdown of dye reactive blue 172(Lade et al.,2015).
Various mixed and pure bacterial cultures have been reported to degrade azo dye through several enzymatic mechanisms for the nonspecific reductive cleavage of azo linkage(Pandey et al.,2007).This could be due to the structural variations of dyes and their degraded metabolites.An increase of enzyme activities in the cell-free extract was associated with their contribution to dye degradation(Jadhav and Govindwar,2006;Parshetti et al.,2006;Kalme et al.,2007).Kalyani et al.(2009)previously characterized the role of oxidoreductive enzymes in the decolorization of azo dye reactive red 2 inPseudomonassp.SUK1.
4.Conclusions
The bacterial strain isolated from sea sediments,A.baumannii,has been found to have the capability of degrading reactive red 198.Initial decolorization studies have been performed and the optimal conditions required for dye degradation have been determined using response surface methodology.The UV-visible spectra and FTIR showed a deviation in peaks in the degraded metabolites compared to the dye,thereby indicating that degradation had taken place.Microbial toxicity and phytotoxicity studies proved that the toxicity of the dye was reduced significantly when the dye was degraded.The comparison of the isolated strain with the other two commercially available strains from ATCC and MTCC showed that the isolated strain was superior in degrading the dyes.Hence,we can conclude that the isolatedA.baumanniistrain is a potent dye-degrading microbe that can be utilized to reduce the pollution caused by industrial dyes.
 Water Science and Engineering2018年4期
- Water Science and Engineering的其它文章
- Monitoring models for base flow effect and daily variation of dam seepage elements considering time lag effect
- Numerical models and theoretical analysis of supercritical bend flow
- A regional suspended load yield estimation model for ungauged watersheds
- Free-surface long wave propagation over linear and parabolic transition shelves
- A comparative study of pseudo-static slope stability analysis using different design codes
- A simple permanent deformation model of rockfill materials