
Numerical models and theoretical analysis of supercritical bend flow
2018-02-20 08:55:22XibinHuangQingWang
Water Science and Engineering 2018年4期
Xi-bin Huang*,Qing Wang
College of Water Conservancy and Hydropower Engineering,Hohai University,Nanjing 210098,China
Abstract The flow pattern of supercritical flow in bend channels is complicated due to the shock wave phenomenon,which creates difficulties with regard to research and design of bend channels.Using the spillway of an actual project as an example,a three-dimensional numerical investigation was conducted to simulate the flow in a steep-slope bend based on the renormalization group(RNG)k-ε turbulence flow model and the volume of fluid(VOF)method.The validity of the numerical simulation was demonstrated by comparison between the results of numerical simulation and physical model tests.An optimal scheme of setting vertical vanes in the bend channel is presented.The results of numerical simulation and physical model tests are in agreement,which demonstrates the effectiveness of optimization of vertical vanes and the validity of the three-dimensional numerical simulation.Water depths along both bend walls were analyzed numerically and theoretically.The formula for calculating supercritical water depth along either bend wall was derived,and the critical condition of flow separation from the inner wall was determined.
Keywords:Supercritical flow;Bend;Shock wave;Numerical simulation;VOF method
1.Introduction
In hydraulic engineering,use of bend channels in spillways is inevitable due to the restrictions of topographical and geological conditions.Supercritical flow in a bend channel causes water perturbation,which may lead to the increase of bend wall height and difficulties related to energy dissipation.Depressing the negative effect of supercritical bend flow is important to practical projects,but few studies have been conducted on supercritical bend flow.Reinauer and Hager(1997)extended the conventional Ippen-Knapp approach,and analyzed the characteristics of supercritical bend flow,such as the angular location of extreme waves,maximum wave heights,and the surface profile along the bend wall.However,water depths along the bend wall and the critical condition of flow separation from the inner wall need to be studied further.
Studies of supercritical bend flow have mostly been based on experiments(Gisonni and Hager,2002;Beltrami et al.,2007;Jaefarzadeh et al.,2012;Zhou et al.,2014),and have needed to inhibit scale effects.Recently,numerical models,which can obtain integral flow distribution,have been used to solve this problem and study various design schemes at little cost.The two-dimensional shallow water equation has been used by some researchers to simulate supercritical bend flow(Valiani and Caleffi,2005;Ghaeini-Hessaroeyeh and Tahershamsi,2009;Ghaeini-Hessaroeyeh et al.,2011).However,this causes underestimation of maximum water depths.Some researchers have attempted to analyze supercritical bend flow with three-dimensional(3D)numerical models(Zhou et al.,2011;Wang et al.,2014;Ye et al.,2006),but they have mainly focused on regular horizontal bends.Relatively few simulations have been devoted to complex slope bends.
To prove the validity of a numerical model and further study the feature of supercritical bend flow,this study conducted 3D numerical simulation of supercritical flow in a bend channel using Flow-3D,which has advantages in tracing free surfaces of fluid.An optimal scheme was developed for setting vertical vanes in the bend channel of a spillway.Then,the distributions of water depths at two bend walls were analyzed both numerically and theoretically,and the critical condition of flow separation from the inner wall was derived.
2.Model investigation
2.1.Description
The spillway gate was located north of the dam.The gate chamber was 15 m wide and 2 m high,and the elevation of the gate bottom was 58 m.The discharge of the probable maximum f l ood was 142 m3/s.With stake number 0+000.00 m placed at the inlet of the sluice gate,other stake numbers indicated the distance along the spillway to the location of the stake number 0+000.00 m.Fig.1 shows the plan view of the spillway.The channel of the spillway between stake numbers 0+040.15 m and 0+102.53 m was a rectangular bend,with a mean radius of curvature of 60 m,a width of 16.8 m,and a deflection angle of 60°.The slope of the bend channel between stake numbers 0+051.58 m and 0+074.72 m was 1:3.0.The elevations of horizontal sections have been marked with square frames.
The physical experimental model was a normal model based on gravity similarity.The geometric scale was 1:30,and the roughness scale was 1:1.76.The model included an inlet section,sluice chamber,spillway channel,and outlet section,and was made of plexiglass.The water supply equipment,rectification equipment,and upper pool were set at the inlet of the model.A tail water gate was set at the end of model to control the water level.Point gauges with a precision of 0.1 mm were used to measure the water level along the spillway.Discharge measurements were carried out using a rectangular thin-wall weir.Water velocities were measured with an LS-401 photoelectric propeller current meter with a starting velocity of 0.02 m/s.
2.2.Mathematical model and method
The turbulence models commonly used are the Reynolds stress model,large eddy simulation,and the renormalization group(RNG)k-ε model.Due to its accuracy,the RNG k-ε model is widely used in dealing with turbulent flow with a high strain rate,and was applied in this study with respect to supercritical bend flow.
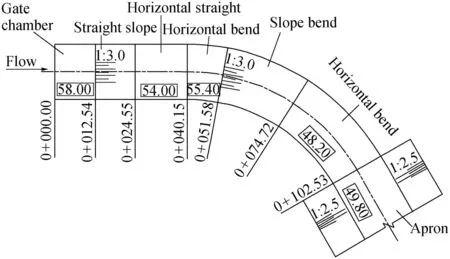
Fig.1.Plan view of spillway(units of stake numbers and elevations of horizontal sections:m).
A suitable measure to trace the free surface of flow improves the accuracy of 3D numerical simulation of supercritical bend flow.The volume of fluid(VOF)method,which is based on the concept of a fluid volume fraction,is commonly used in tracking the free surface of a fluid,and is a successful method of tracking the free surface of bend flow(Han et al.,2011;Milena et al.,2014).Flow-3D has improved the VOF method,and can obtain more accurate results than other commercial computational fluid dynamics(CFD)programs.This method was therefore used to trace the free surface of supercritical bend flow.
2.3.Gird and boundary conditions
According to the layout of the spillway,a numerical model was established with a ratio of 1:1 to the spillway.The upstream straight section of the model was 50 m long,and the downstream apron section was 60 m long.The structured rectangular grids of the computation area were generated with the fractional area volume obstacle representation(FAVOR)method in Flow-3D,and the total number of grid cells was about 6400000.
The inlet boundary was defined as the velocity boundary,and the velocity of inlet water was calculated with the discharge and water level of a probable maximum flood.The outlet boundary of the model was defined as the out flow boundary.The bottom and both sidewalls were defined as wall boundaries.
3.Analysis of results
3.1.Spillway without vanes
Velocity distribution near the water surface of the spillway calculated by the numerical model at a discharge of 142 m3/s and a water level of 61.27 m of the probable maximum flood is shown in Fig.2.The simulated results indicate that the flow in the upstream section and gate chamber is relatively regular,and a hydraulic jump occurs in the straight slope channel.In a bend channel,the flow occurs near the outer wall,and the water depth along the outer wall is higher than that along the inner wall.A large scale of reflux emerges at the outlet of the channel along the inner wall.There is a strong difference between the velocity of flow in the bend along the outer wall and along the inner wall.At the outlet of the bend channel,the flow velocity along the outer wall is high,and the reverse flow velocity appears at the inner wall.In a word,the entire flow distribution of the bend channel is complicated.

Fig.2.Velocity distribution of spillway without vanes.
Table 1 shows a velocity comparison between simulated results and experimental measured data of some representative cross-sections.The velocities in Table 1 were measured near the water surface in the middle of the cross-sections.Simulated results of velocity are in agreement with experimental data,and the relative error is acceptable.
A water level comparison between simulated results and measured data at the check water level at two bend walls is shown in Fig.3.The figure indicates that the water level fluctuates in the bend channel,and water distribution along the two bend walls is imbalanced.The water level of the outer wall is apparently higher than that of the inner wall.Simulated results are similar to measured data,but there are still some calculation errors.The water level of the horizontal bend channel of the simulated results is generally lower than measured data.
3.2.Spillway with vanes
Because of poor distribution of water in the bend channel,velocity and discharge at the outer wall are higher than at the inner wall in the apron section,which may cause erosion in the apron wall.Therefore,optimizing the design of the spillway to improve water distribution is crucial.Comparison of velocity and water level has verified the reliability of simulated results.Thus,numerical simulation can be used to assist the optimization of spillway design.
Setting vertical vanes in a bend channel is an effective method of balancing bend flow.The number and length of vertical vanes were determined through comparison of different schemes by the numerical model,and the optimal scheme was ultimately determined.Three vertical vanes,each with a width of 0.3 m and a height of 2.2 m,were installed uniformly in the bend channel.The vertical vane height was approximately half of the wall height.Vertical vanes started from the inlet of the bend channel,with the deflection angle of the vertical vane being 51°and the deflection angle of the entire bend channel being 60°.The partial absence of vertical vanes in a horizontal bend can save the cost of the project,and does not influence the effect of vertical vanes.
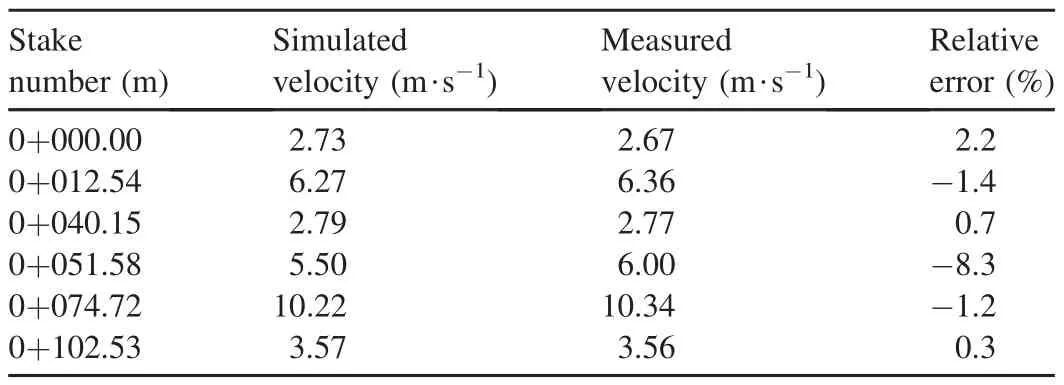
Table 1 Velocity comparison between simulated results and measured data.
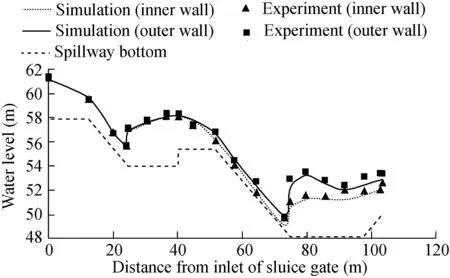
Fig.3.Water level comparison between simulated results and measured data of spillway without vanes.
Fig.4 presents velocity distribution near the water surface of the spillway,with vanes calculated by the numerical model.It shows that the presence of three vertical vanes has reduced flow separation along the inner bend wall and improved the flow pattern.The velocity along the two walls becomes uniform in the bend and apron sections due to the shunt effect of vertical vanes.
A water level comparison between simulated results and measured data at the two walls of the spillway with vanes is shown in Fig.5.The water level of the outer wall is similar to that of the inner wall.Compared with Fig.3,the water surface of the spillway with vanes is steady in the bend channel,and the significant fluctuation of the water surface has disappeared.This proves that the configuration of the three vertical vanes can successfully improve water distribution in the bend channel.
4.Water depth of supercritical flow along bend wall
4.1.Numerical model of bend
The feasibility of 3D numerical simulation of supercritical bend flow has been demonstrated.The water depth of supercritical bend flow can be examined through 3D numerical simulation.Supercritical flow in the rectangular horizontal bend was simulated,with the deflection angle of the bend being 45°,and the upstream and downstream straight sections being five times as long as the bend width.The inlet boundary condition was defined as the velocity boundary.The outlet boundary condition was defined as the out flow boundary.The bottom and both sidewalls were defined as wall boundaries.
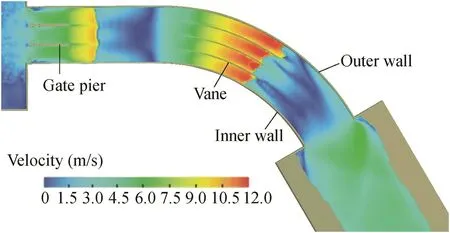
Fig.4.Velocity distribution of spillway with vanes.

Fig.5.Water level comparison between simulated results and measured data of spillway with vanes.
Fig.6 shows the water depth of supercritical bend flow,with a relative radius ofr/b=15,whereris the mean radius of curvature andbis the width of the bend,and a Froude number ofFr=2.6 for the inlet flow.The phenomenon of the shock wave is clear in simulated results.The wave maximum and wave minimum alternately appear at the two walls,and the water depth along the outer wall is higher than that along the inner wall.These features of supercritical bend flow are analyzed theoretically below.
4.2.Theoretical analysis of water depth distribution
According to the results of numerical simulation,the water distribution of supercritical bend flow resembles the combination of the transverse gradient and sine oscillations.Based on the assumptions that the bend bottom is horizontal,the bend section of the channel is rectangular,and the velocity of the bend section is constant,and ignoring the vertical velocity and frictional resistance of flow,the kinetic characteristics of supercritical bend flow are discussed here.
The water in the bend is subject to a combination of forces including centrifugal forceFc,pressure of the outer wallP1,and pressure of the inner wallP2.The summation of the three forces is zero,and the equilibrium of the water body can be expressed as
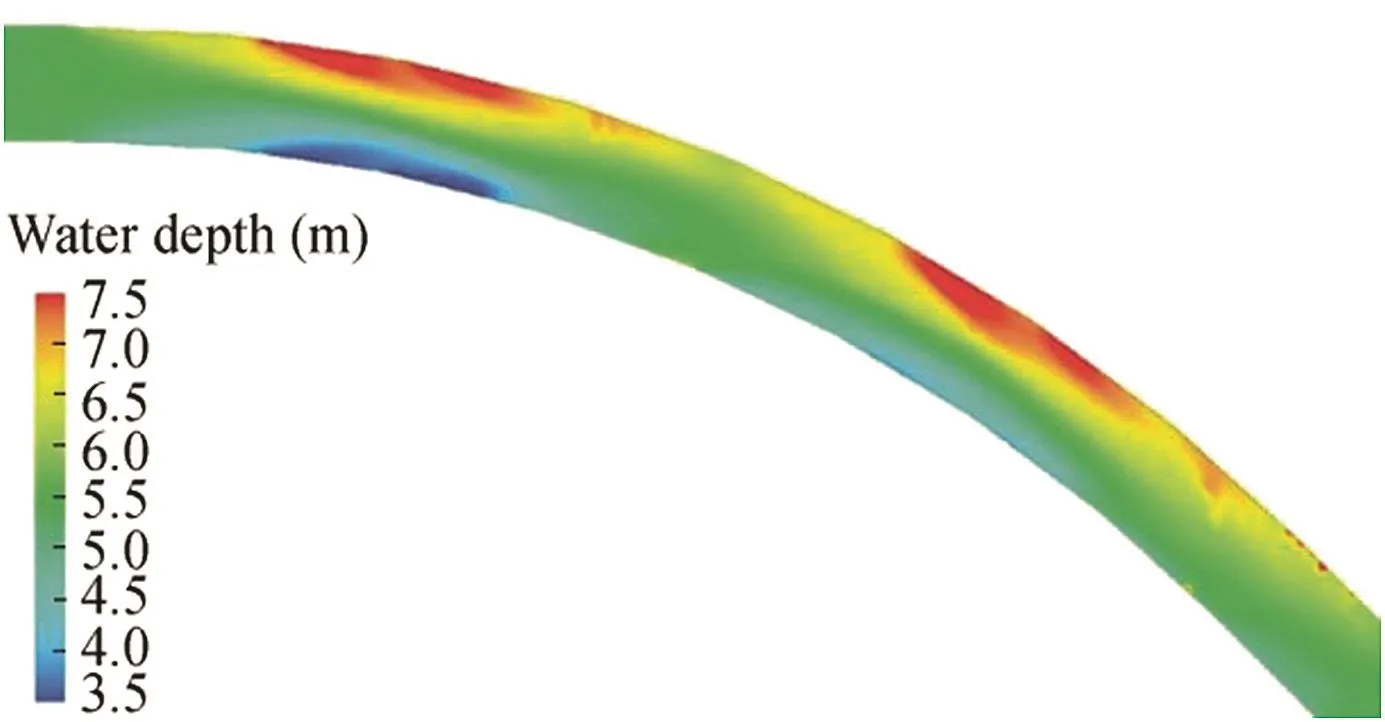
Fig.6.Water depth of supercritical bend flow with r/b=15 and Fr=2.6.

whereh1is the water depth at the outer wall,h2is the water depth at the inner wall,ρ is the density of water,gis the acceleration of gravity,andvis the velocity of inlet flow.
Eq.(1)can be simplified as
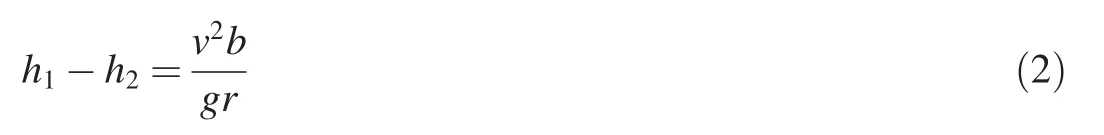
Eq.(2)presents the difference in water level between the two walls in equilibrium.
The flow pattern of supercritical bend flow is not steady,and the water depth and velocity change with the movement of water.Assuming some methods are used to remove the fluctuation of shock waves,the supercritical bend flow is in equilibrium,and the combined external force of water is zero.The force analysis of water of unit length in equilibrium is shown in Fig.7(a).Due to the transverse gradient present in the water surface because of the influence of the centrifugal force,the surface of the cross-section changes fromABtoEF.
In fact,water bodies will still move when they reach the equilibrium condition.As shown in Fig.7(b),the original water body isABCD,and the original water depth ish0.The shape of the water body changes with the influence of the external force,and the center of gravity moves outward from the original locationM.The work done by centrifugal force is stored in the water body as kinetic energy,and the kinetic energy will reach its maximum when the water surface reaches a balanced positionEF.The water surface will reach its extreme positionA'B'when the kinetic energy stored in the water body is totally transformed into potential energy,and the maximum depth at that moment ish0+s,wheresis the increment of water depth.During this process,the work done by the centrifugal force to the water body is transformed into the incremental potential energy from the original water bodyABCDto the modified water bodyA'B'CD.
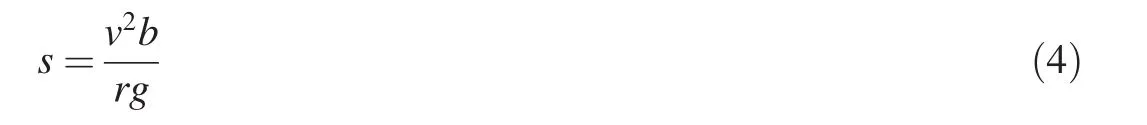
Assuming that the mass of the water body is concentrated at the center of gravity of the water body,the center of gravity of the original water bodyABCDisM,and the center of gravity of the water bodyA'B'CDin which water depth reaches the maximum value isN.According to the geometrical relationship,the horizontal distance fromMtoNissb/(6h0),and the vertical distance iss2/(6h0).Based on the energy conversation law,the work done by centrifugal force is equal to the work done by gravity,and can be described as

Eq.(3)can be simplified as
Thus,the maximum water depth at the outer bend wall can be expressed as

Fig.7.Cross-section of bend flow with different flow patterns.
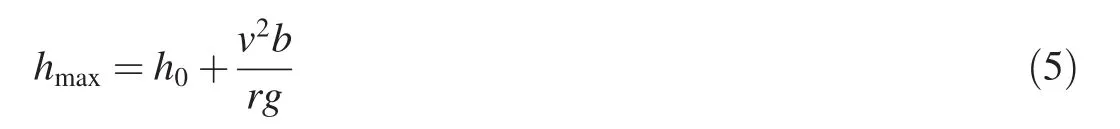
According to the analysis above,the maximum water depth of the extreme position at the bend wall is higher than the equilibrium position byv2b/(2rg).According to the water depth distribution of supercritical bend flow,the movement of supercritical bend flow is similar to sine oscillations.
The water depth distributions of the supercritical bend flow along the two walls can be deduced from the motion formula of a transverse wave.The surface of water along the outer wall is similar to sine oscillations,the original water depth ish0+v2b/(2rg),the amplitude of oscillation isv2b/(2rg),the wavelength is 2θ(θ is the angular location of the first peak of the shock wave,measured from the beginning of the bend),the phase is π,and the water depth along the outer wall is as follows:

where φ is the angular location,measured from the beginning of the bend.
Similarly,the water depth distribution along the inner wall can be obtained.The original water depth ish0-v2b/(2rg),the amplitude isv2b/(2rg),the wavelength is 2θ,the phase is π,and the water depth along the inner wall is as follows:

Eqs.(6)and(7)are water depth distributions of supercritical bend flow along the two walls.The value of θ can be calculated from previously given formulas(Reinauer and Hager,1997;Tian,2000).
Using Eqs.(6)and(7)with the supercritical bend flow shown in Fig.6,a comparison between results of the formula and numerical simulation is presented in Fig.8.It indicates that the water depth distributions calculated by Eqs.(6)and(7)are similar to the results of numerical simulation.The numerical simulation presented in Fig.8 shows that the maximum water depth along the outer wall decreases and the minimum water depth along the inner wall increases,in contrast to the formula calculated results.Because of the formulas based on the assumptions that ignore the vertical velocity and frictional resistance of flow,this damping phenomenon is not presented in Eqs.(6)and(7).
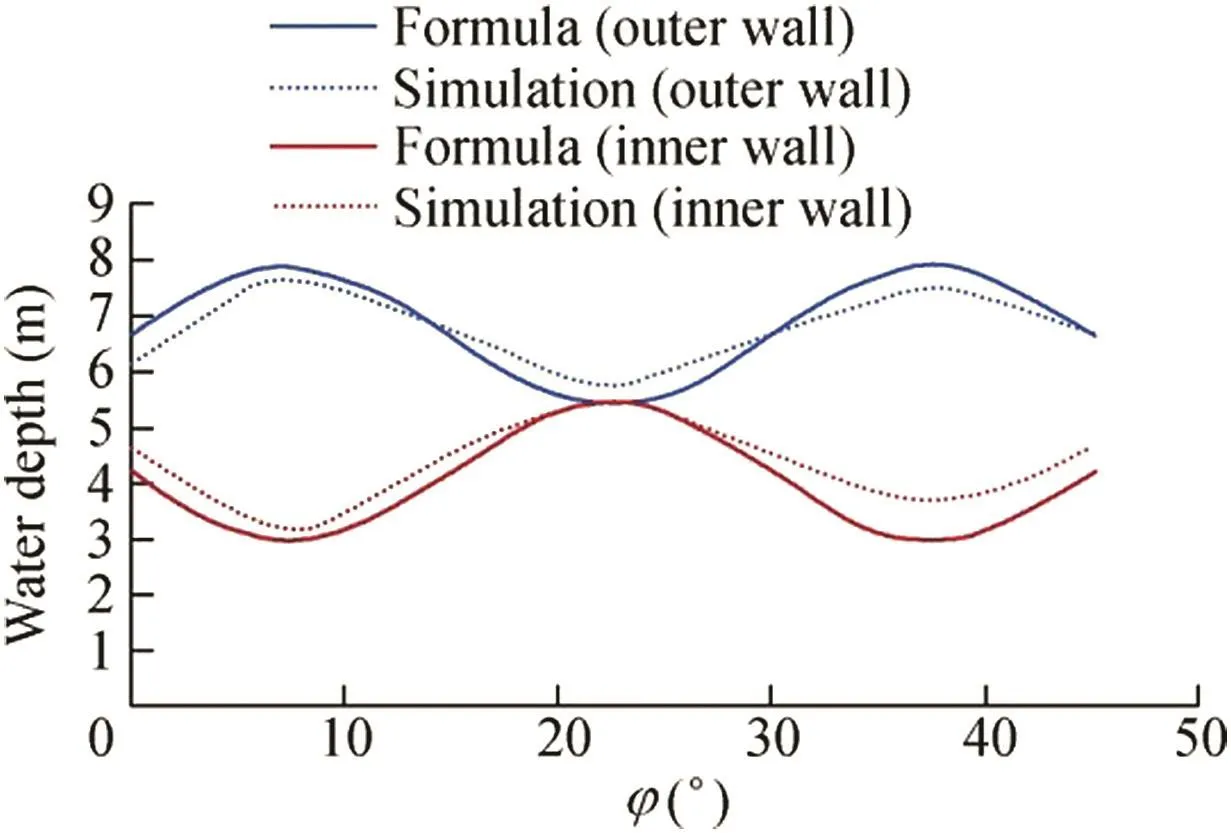
Fig.8.Water depth distribution comparison between formula calculations and simulated results(r/b=15 and Fr=2.6).
5.Critical condition of flow separation
Eqs.(6)and(7)have particular application scopes.When the Froude number of inlet flow is less than 1,the flow is subcritical flow and the shock wave of supercritical flow does not appear.The minimal water depth decreases with the increase of the Froude number of inlet flow,and then water separation from the inner wall occurs.Eqs.(6)and(7)do not work after the occurrence of water separation.
The moment that the minimal water depth at the inner wall reaches zero is the critical condition of water separation,as shown in Fig.7(c).According to Fig.7(b),(c),the length ofAA',which is transformed intoAD,is equal toBB',that is,s=h0.It can be obtained by Eq.(4)as follows:
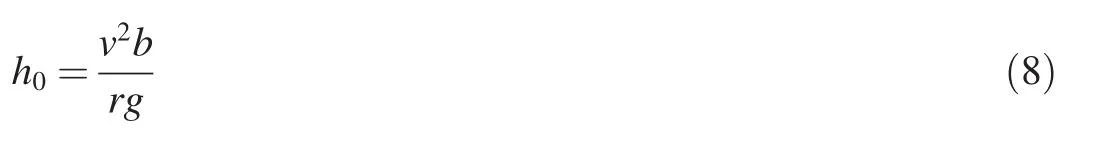
Eq.(8)can also be written as
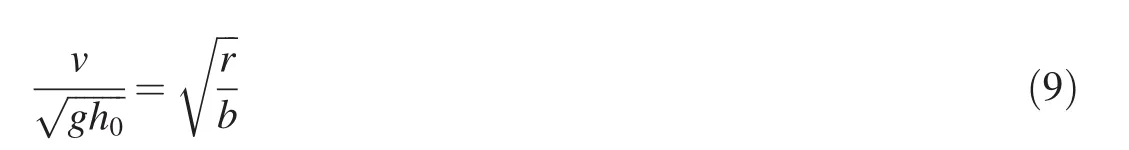
Therefore,the Froude number of inlet flow under the critical condition of water separation,Fr′,can be written as
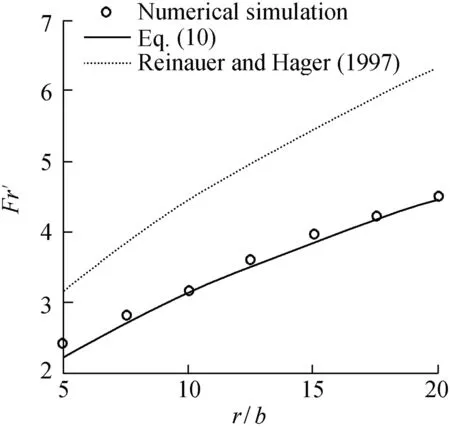
Fig.9.Critical condition of flow separation.

Eq.(8)and Eq.(10)are critical conditions of water separation.That is,water separation occurs when the Froude number of inlet flow equals the square root of the relative radius of the bend.A comparison of critical conditions among Eq.(10),numerical simulation,and the research of Reinauer and Hager(1997)is shown in Fig.9.The Froude number of the critical condition calculated by Reinauer and Hager(1997)is larger than the results of Eq.(10)and numerical simulation.The result of Eq.(10)agrees with numerical simulation,and is slightly lower than the result of simulation.
Water separation from the inner bend wall is rare in practical engineering,but once it occurs,the damage to structures and projects is enormous.Water separation should be avoided as much as possible in project design.According to Eq.(10),some measures can be used to prevent water separation,such as increasing the radius of the bend,and decreasing the width of the bend and the Froude number of inlet flow.
6.Conclusions
Detailed flow field information regarding supercritical bend f l ow has been acquired by a 3D numerical model based on the RNGk-ε turbulence flow model and the VOF method.The water depth distribution and critical condition of flow separation of supercritical bend flow have been analyzed theoretically.The main conclusions are as follows:
(1)A 3D numerical model was used to simulate supercritical flow in the bend channel of a spillway.The results of numerical simulation and physical model tests match well.Therefore,the numerical simulation model can provide reference data for design of a spillway and investigation of supercritical bend flow.
(2)The measure of setting vertical vanes in a bend can improve the water distribution of the bend,and decreasing the number and length of vanes within a certain range does not influence the function of vanes in the bend.
(3)The distributions of water depths along the two bend walls obtained from numerical simulation results were analyzed theoretically,and formulas for water depths along the two bend walls were deduced.
(4)The formula for the critical condition of water separation was determined.Water separation should be avoided due to the damage it causes to engineering structures and projects.
 Water Science and Engineering2018年4期
- Water Science and Engineering的其它文章
- Monitoring models for base flow effect and daily variation of dam seepage elements considering time lag effect
- A regional suspended load yield estimation model for ungauged watersheds
- Free-surface long wave propagation over linear and parabolic transition shelves
- A comparative study of pseudo-static slope stability analysis using different design codes
- A simple permanent deformation model of rockfill materials
- Seismic design of Xiluodu ultra-high arch dam