
Monitoring models for base flow effect and daily variation of dam seepage elements considering time lag effect
2018-02-20 08:55:22ShoweiWngYingliXuChongshiGuTengfeiBo
Water Science and Engineering 2018年4期
Sho-wei Wng *,Ying-li Xu ,Chong-shi Gu ,Teng-fei Bo
a School of Environmental and Safety Engineering,Changzhou University,Changzhou 213164,China
b State Key Laboratory of Hydrology-Water Resources and Hydraulic Engineering,Hohai University,Nanjing 210098,China
Abstract Affected by external environmental factors and evolution of dam performance,dam seepage behavior shows nonlinear time-varying characteristics.In this study,to predict and evaluate the long-term development trend and short-term fluctuation of the dam seepage behavior,two monitoring models were developed,one for the base flow effect and one for daily variation of dam seepage elements.In the first model,to avoid the influence of the time lag effect on the evaluation of seepage variation with the time effect component of seepage elements,the base values of the seepage element and the reservoir water level were extracted using the wavelet multi-resolution analysis method,and the time effect component was separated by the established base flow effect monitoring model.For the development of the daily variation monitoring model for dam seepage elements,all the previous factors,of which the measured time series prior to the dam seepage element monitoring time may have certain influence on the monitored results,were considered.Those factors that were positively correlated with the analyzed seepage element were initially considered to be the support vector machine(SVM)model input factors,and then the SVM kernel function-based sensitivity analysis was performed to optimize the input factor set and establish the optimized daily variation SVM model.The efficiency and rationality of the two models were verified by case studies of the water level of two piezometric tubes buried under the slope of a concrete gravity dam.Sensitivity analysis of the optimized SVM model shows that the influences of the daily variation of the upstream reservoir water level and rainfall on the daily variation of piezometric tube water level are processes subject to normal distribution.
Keywords:Dam seepage monitoring model;Time lag effect;Support vector machine(SVM);Sensitivity analysis;Base flow;Daily variation;Piezometric tube water level
1.Introduction
Dam safety is significantly influenced by the seepage behavior of a dam's body,foundation,and bank slope.If an abnormal seepage problem is not detected and treated in a timely manner,it will probably result in seepage failure or even dam failure,as in the case of the failure of the Gouhou Concrete-faced Rockfill Dam in China(Li,1994;Malkawi and Al-Sheriadeh,2000).Therefore,it is important to monitor and predict dam seepage behavior.The frequently used monitoring methods at present mainly include piezometric tubes,osmometers,measurement weirs,and distributed optical fibers.The dam seepage behavior is directly reflected by monitored seepage elements,such as the piezometric tube water level,seepage discharge,seepage pressure,and water clarity(Fu et al.,2014;Su et al.,2015b;Alonso and Pinyol,2016).Considering the structural performance of a dam,the prediction and interpretation of these large sets of available data are very important for dam health monitoring,and are mainly based on mathematical or physical models(Rankovi´c et al.,2014;Wu et al.,2016).
The upstream reservoir water level and rainfall are the main factors influencing dam seepage,and previous research results have indicated that the influences of these two factors show a strong time lag effect.Specifically,the change of the piezometric tube water level lags behind the change of the reservoir water level and rainfall(Liu and Sun,2011).To solve this problem,Gu and Wu(2006)established statistical models in different forms for dam seepage monitoring,and the previous segmental average values and equivalent values of the upstream reservoir water level and rainfall were used as model factors.The average value method is frequently used,combined with multiple linear regression(MLR,in which the least squares regression and stepwise regression are frequently used),due to its simplicity(Hu and Ma,2016).However,the influence of the actual time lag effect on dam seepage gradually increases to a great extent and disappears later on,and the time lag effect cannot be appropriately reflected by an average process.As for the equivalent value method,the time lag effect is mostly considered to follow a normal distribution,and the lag time and influencing time are the key parameters that need to be accurately determined.To optimize these two parameters,artificial intelligence algorithms,such as the adaptive linear neuron(Yu et al.,2010)and genetic algorithms(Qiu et al.,2016;Wei et al.,2018),are frequently used.Wang and Bao(2013)also proposed a daily variation monitoring model for seepage elements using the previous equivalent incremental value of reservoir water level.Besides the statistical model,an autoregressive moving average(ARMA)model has also been used to predict dam seepage elements.However,it is incapable of explaining the abnormal phenomenon in the predicted results(Adamowski and Chan,2011).
Artificial intelligence algorithms,such as the artificial neural network(ANN)and the support vector machine(SVM),have been developed in recent years and can be used to establish a nonlinear mapping relationship between the input and output of a system.The essence of the dam safety monitoring model is to establish relationships between a monitored dam effect quantity and its factors,which can be respectively used as the output and input variables.Then,according to the observation data,monitoring models can be established by developing the learning rules between input and output samples with the artificial intelligence algorithm(Kao and Loh,2011;Monjezi et al.,2013;Zheng et al.,2013;Mata,2011).Rankovi´c et al.(2014)developed a nonlinear feedforward neural network(FNN)model to predict the piezometric tube water level in dams,and this approach shows higher prediction accuracy than the traditional MLR method.The SVM is based on the minimization principle of structural risk and can effectively solve the high-dimensional nonlinear problem with small samples;its fitting ability can be optimized by the genetic algorithm(GA),particle swarm optimization(PSO),etc.Thus,SVM models are frequently used for dam safety monitoring.To reduce the modeling time without decreasing the prediction accuracy,Su et al.(2015b)conducted sensitivity analysis of SVM model input factors with respect to output factors.The SVM model is very adaptable to the situation in which the factors of dam effect quantities have a great deal of uncertainty.The aforementioned situation can also be solved through cooperation between the principal component analysis(PCA)and the SVM,in which the main features of the uncertain input factors are primarily extracted by PCA before establishing the SVM model(Chen et al.,2013).
In order to accurately evaluate the dam seepage behavior,the piezometric tube water level was used as an example to establish the monitoring models for the base flow effect and daily variation of dam seepage elements,respectively,in this study.The base flow effect monitoring model was used to separate the time effect component from the monitored seepage elements,so as to avoid the influence of seepage lag effect.The model can be used to predict and evaluate the longterm development trend of the dam seepage behavior.To monitor the daily variation of dam seepage elements,the SVM was used to establish the nonlinear mapping relationship between the daily variation of a seepage element and its factors,and the seepage lag effect-induced uncertainty of the factors was optimized through sensitivity analysis.
2.Time lag effect of monitored dam seepage elements
Due to the water level fluctuation of a reservoir,the dam body and its foundation are in an unsteady seepage state.The resistance caused by the weak permeability of dam materials leads to a change of water pressure in different parts of the dam-foundation system lagging behind the fluctuation of the reservoir water level and the in filtration of rainfall.The relationship between the monitored water level of a piezometric tube embedded behind the impervious curtain and the reservoir water level of the Chencun Arch Dam,with other factors almost remaining the same,is shown in Fig.1.It can be seen that,at the same reservoir water level,the monitored piezometric tube water level at the rising stage of the reservoir water level is lower than that at the dropping stage.This phenomenon is mainly caused by the time lag effect of unsteady seepage.

Fig.1.Relationship between upstream reservoir water level and piezometric tube water level of Chencun Arch Dam.
To study the mechanism of seepage lag effect,assumptions for a piezometric tube are as follows:(1)the upstream reservoir water levelHand the piezometric tube water levelhare respectively kept constant for a long time in the steady seepage state;and(2)the reservoir water level rises or drops by a certain amplitude and then remains constant,while other environmental variables remain unchanged.Statistical analyses show that the change of the piezometric tube water level occurs later than that of the reservoir water level,and it takes a longer time for the piezometric tube water level to reach a steady state,as shown in Fig.2.During this process,the seepage lag effect is mainly caused by three factors(Wang and Bao,2013):(1)the time interval for water pressure transmission induced by water filling into or discharging from a porous medium,which is the main factor of the seepage lag effect;(2)the time interval induced by monitoring methods,e.g.,for a piezometric tube,a time interval is needed for water to fill into or discharge from its interior,and the delayed time increases with the size of the tube;and(3)the time interval required for squeezing the air and filling the porous medium,which mainly occurs in the seepage transition zone.
As for the factors of dam seepage elements,monitoring results show that the piezometric tube water level is mainly influenced by the upstream and downstream reservoir water levels,rainfall,temperature,and time effect,with their components denoted ashu,hd,hP,hT,andhθ,respectively.To consider the seepage lag effect corresponding to the upstream reservoir water level and rainfall,the previous segmental average values of these two factors have mostly been used.Therefore,the traditional hydraulic,precipitation,temperature,and time effect(HPTT)statistical model for piezometric tube water levelhis generally as follows(Gu and Wu,2006):
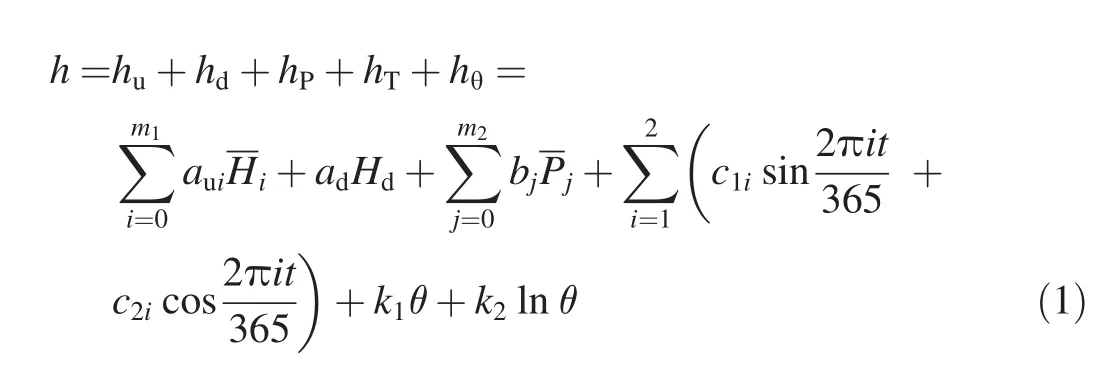
whereHi(i=0,1,…,m1)is theith previous segmental average value of the upstream reservoir water level;Pj(j=0,1,…,m2)is thejth previous segmental average value of rainfall;Hdis the downstream water level,monitored simultaneously with the seepage element;tis the cumulative monitoring time;θ=t/100;andaui,ad,bj,c1i,c2i,k1,andk2are the regression coefficients.
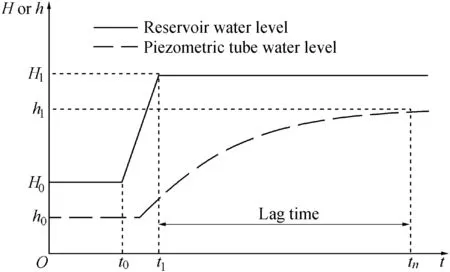
Fig.2.Sketch of seepage lag effect represented by piezometric tube water level.
3.Monitoring model for base flow effect
The seepage field of a dam-foundation system continuously changes with the development of environmental factors.The base flow shows the basic effects of the main factors,the hydraulic pressure and time effect,on dam seepage,and its development rule can be used to evaluate the performance of the dam seepage prevention and drainage system.Therefore,to avoid the influences of the reservoir water level change and seepage lag effect,it is necessary to establish a base flow effect monitoring model,which can be used to estimate the time effect component and the long-term seepage behavior.
3.1.Extraction of base flow effect
Generally,the reservoir water level and piezometric tube water level both fluctuate around certain base values,which are respectively denoted as Hband hb.Then,for any time,the reservoir water level and piezometric tube water level can be denoted asHb+ΔHandhb+ Δh,respectively,where ΔHand Δhare the water level variations with respect toHbandhb,respectively.However,a seepage element is monitored as a comprehensive value influenced by different factors.The effect of an individual factor is unknown and can only be separated by mathematical models or other signal separation methods.In general,each factor has a certain frequency.Therefore,according to the frequency of a factor and its seepage component,the monitored comprehensive value of the seepage element can be separated in the frequency domain,and components of different factors can be distinguished by their frequencies(Wang et al.,2018).Generally,the base flow effect is represented by the separated low-frequency component with a cycle period of more than one year.
The wavelet multi-resolution analysis is a signal analysis method in the frequency domain,by which a time series can be decomposed into components of different frequencies,and thus it can be applied to the multi-scale analysis of seepage elements.The decomposition diagram of the wavelet multiresolution analysis is shown in Fig.3.During the decomposition of a time series,only the low-frequency component obtained in the previous step is decomposed again.The decomposition of a time series in the wavelet multi-resolution analysis can be expressed as follows:

wheref0is the original signal;andfianddiare,respectively,the low-and high-frequency components decomposed from the low-frequency componentfi-1of the previous step.

Fig.3.Decomposition diagram of wavelet multi-resolution analysis.
3.2.Base flow effect monitoring model based on wavelet multi-resolution analysis
Of all those dam seepage factors,the environmental temperature and rainfall usually cycle with annual periodicity.However,the variation period of the reservoir water level differs from dam to dam,and it varies from daily regulation to multi-year regulation,even without obvious periodicity.Therefore,to establish a monitoring model for the base flow effect of dam seepage,multi-layer wavelet decompositions are first conducted of seepage elements and the reservoir water level.When the frequency of a decomposed low-frequency component of the monitored time series is lower than that of annual periodicity,the decomposed low-frequency component at this decomposition layer can be determined as the base value,and thus,the monitoring model for the base flow effect is established.
Based on the frequency characteristic,the base flow of dam seepage is mainly caused by the time effect and the long-term hydraulic action.Thus,the base flow effect of the piezometric tube water level can be expressed with the following monitoring model:

whereahis the regression coefficient.
4.Daily variation SVM model for dam seepage elements
In engineering practice,monitoring models are used for safety analysis and abnormality mechanism interpretation of the dam-foundation system.The abnormality is diagnosed based on the variation of monitored variables,for example,the sudden increase or decrease of the piezometric tube water level usually reveals the failure of the seepage prevention and drainage system or the blockage of the piezometric tube.The base value of the piezometric tube water level mostly reflects the overall quality of the seepage prevention and drainage system,rather than the abnormality diagnosis.Therefore,a monitoring model for the daily variation of the piezometric tube water level with consideration of the time lag effect needs to be established.
The SVM is based on the statistical learning theory and has a strong nonlinear mapping ability in high dimensional space.Therefore,the SVM was adopted in this study to establish a nonlinear relationship between the daily variation of a seepage element and its factors.
4.1.Factors of daily variation of dam seepage elements
The daily variation of the piezometric tube water level is mainly induced by the variations of reservoir water level,rainfall,and temperature.Considering that the downstream reservoir water level changes slightly for most dams,its influence on the daily variation of the piezometric tube water level can be ignored.Therefore,the daily variation of the piezometric tube water level consists of three parts,as follows:

where Δh′, Δhu, ΔhP,and ΔhTare the daily variation of the piezometric tube water level and its components caused by the variations of upstream hydraulic pressure,rainfall,and temperature,respectively.
To consider the seepage lag effect,the previous daily variations of the upstream reservoir water level are initially determined as the hydraulic factors.Thus,the hydraulic component of the daily variation of the piezometric tube water level can be determined as follows:
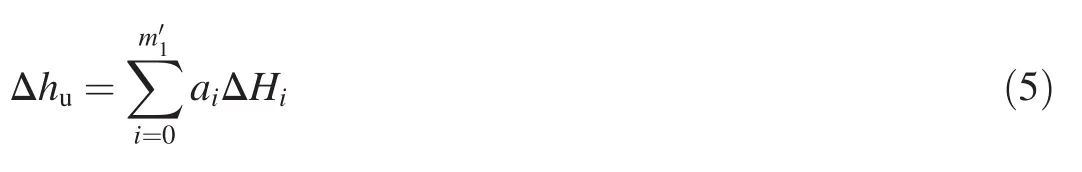
where ΔHi(i=0,1,…)is the daily variation of the upstream reservoir water level that is monitoredidays before the seepage element monitoring time,andaiis the regression coefficient.
The influence of rainfall on the daily variation of the piezometric tube water level is not an average process,and it can be evaluated with the previous rainfallPj(j=0,1,…,)that is monitoredjdays before the seepage element monitoring time:
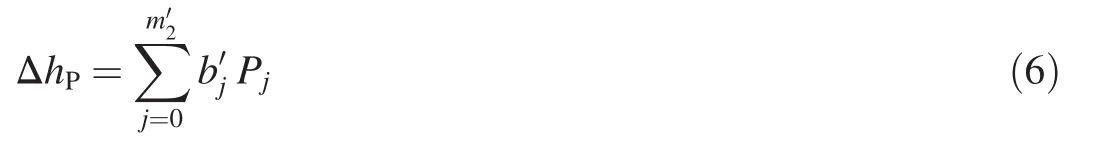
whereis the regression coefficient.
The temperature component in the daily variation of the piezometric tube water level is determined by the periodic function as shown in Eq.(1).
4.2.Optimization of input factors of SVM model
As for a given sample combination {(xi,yi),i=1,2,…,n},a linear function can be determined to express the relationship between an input vector xi= (xi1,xi2,…,xir)and an output valuef(xi).f(xi)is determined according to the criterion of minimum cumulative square deviation between the output valuef(xi)and the actual valueyi.When using the nonlinear regression,the input vector is first mapped into a high dimensional space using the nonlinear mapping φ :xi→φ(xi),and then the nonlinear problem is transformed into a linear problem in the high dimensional space.Thus,the relationship between the SVM input and output vectors can be expressed asf(xi)=ωT·φ(xi)+b,and the corresponding optimization criterion is defined as follows:
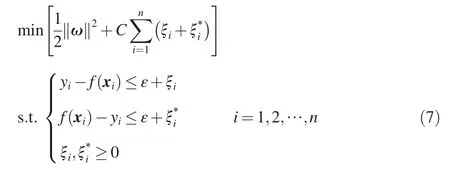
where ω is a one-dimensional vector andbis a parameter determined in the optimization process,respectively;ξiandare the slack variables introduced due to the allowance of fitting error;andCis the penalty factor of the sample whose training error is greater than the threshold ε,whereC> 0.
Sensitivity analysis is an effective method of studying the importance of each input factor.To reduce the input space dimension of the SVM with high prediction accuracy,the initially determined uncertain input factors of the initial SVM model are optimized through sensitivity analysis,and some unimportant factors can be eliminated.The sensitivity of an SVM input factor to an output factor can be expressed as the partial derivative of the model output factor with respect to the input factor,and the sensitivity of thelth SVM input factor to the output factorf(xi)is defined as follows(Su et al.,2015a):
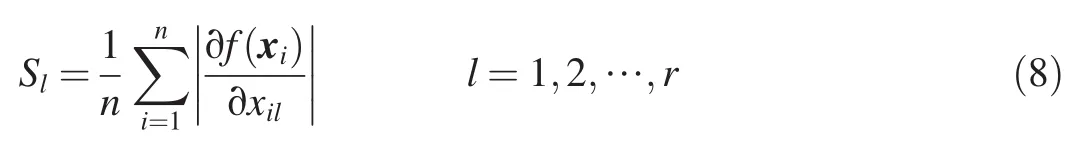
wherenis the total number of training samples,andris the total amount of the used input factor.
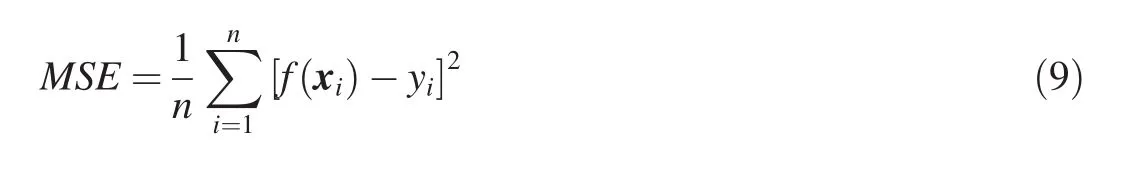
To evaluate the prediction performance of the established SVM model,the mean square error(MSE)is calculated as follows:
4.3.Establishment of daily variation SVM model
Due to the uncertainty of the lag time of the piezometric tube water level with respect to the reservoir water level and rainfall,it is difficult to determine the previous factors in Eqs.(5)and(6),of which the measured time series prior to the monitoring time of the piezometric tube water level may have certain influence on the monitored results.Therefore,to achieve the highest prediction accuracy with the least number of model input factors,a daily variation SVM model for dam seepage elements was developed as follows:
Step 1:The correlation coefficients between the daily variation of the piezometric tube water level and the previously measured time series of rainfall and the daily variation of the reservoir water level are calculated,and the factors that have positive correlation coefficients with the daily variation of the piezometric tube water level are determined.
Step 2:An initial SVM model with the initially determined input factor set is established.
Step 3:The sensitivities of the input factors to the output factor in the SVM model are calculated with Eq.(8).
Step 4:The input factor with the least amount of sensitivity is eliminated,and a new input factor set with the remaining input factors is developed.
Step 5:A new SVM model is established based on the optimized input factor set.
Step 6:TheMSEof the newly established SVM model is calculated,and theMSEis used as the performance evaluation index of the SVM model during the process of eliminating unimportant input factors.
Step 7:It is determined whether the initially removed input factor in Step 4 should be finally eliminated or not.If theMSEof the newly established SVM model decreases or increases with a relative increment of theMSEsmaller than the preset threshold ε0,which means that the elimination of this input factor either can increase the prediction accuracy or has little influence on the prediction accuracy of the SVM model,this input factor can be eliminated.Then,the sensitivity analysis should be continued by returning to Step 3.Otherwise,if theMSEof the newly established SVM model increases,with a relative increment of theMSElarger than the preset threshold ε0,which means that the elimination of this input factor will significantly reduce the prediction accuracy of the SVM model,this input factor should be retained,and the optimization process of input factors is stopped.
A flow chart for establishing the daily variation SVM model of dam seepage elements is shown in Fig.4.
5.Case study
The Mianhuatan Dam is located on the Tingjiang River of Fujian Province,China.The crest elevation and maximum dam height of this roller-compacted concrete gravity dam are 179.0 m and 113.0 m,respectively.To monitor the seepage behavior at the abutment,seven piezometric tubes were embedded under the left and right dam slopes.Several piezometric tubes were located further downstream,and their water levels changed slightly.Two piezometric tubes with high sensitivity to environmental factors were selected to establish the monitoring models for the base flow effect and daily variation of dam seepage elements.These two piezometric tubes were embedded in front and at the back of the impervious curtain of the right dam abutment,marked as R1 and R3,respectively,in Fig.5.The plane layout of the dam and the locations of the analyzed piezometric tubes are shown in Fig.5.
5.1.Monitoring model for base flow effect

Fig.4.Flow chart for establishing daily variation SVM model of dam seepage elements.
To establish the base flow effect monitoring model,time series of the two piezometric tube water levels were first decomposed with the wavelet multi-resolution analysis method.The dam was constructed together with a reservoir with incomplete annual regulation.When the piezometric tube water levels were decomposed to the eighth layer,the periods of the high-frequency and low-frequency components were respectively 341 days and 512 days,and thus the lowfrequency component could be determined as the base value.Time series of the two piezometric tube water levels and extracted base values are shown in Fig.6.It can be seen that the base values of the piezometric tube water level and reservoir water level are basically in a steady state,the piezometric tube water level changes in significant correlation with the reservoir water level,and the time lag effect clearly exists.Due to the higher embedment elevation under the abutment slope and the location in front of the impervious curtain,the water level of the piezometric tube R1 is higher than the reservoir water level.According to Eq.(3),the monitoring models for the base flow effect of the two piezometric tube water levels are as follows:
(1)Piezometric tube R1:

(2)Piezometric tube R3:

The multi-correlation coefficient between the monitored and fitted base values of the piezometric tube water level andMSEvalue were 0.91 and 0.084 for the base flow effect monitoring model of R1,and 0.94 and 0.028 for the base flow effect monitoring model of R3,respectively,indicating that the two established models could better reflect the monitored base values.Fig.6 shows that the time effect components of the piezometric tube water level base values increase quickly at the initial stage of the analyzed period and slightly decrease in the long-term operation.The evolution of these two piezometric tube water levels shows that the seepage behavior of the right abutment slope was stable.
5.2.Daily variation SVM model for dam seepage elements
The correlation coefficients between the daily variation of the piezometric tube water level and the previous factors were first calculated,as shown in Fig.7.On this basis,the previous input factors were determined:daily variations of the reservoir water level within the previous 21 days(ΔH1through ΔH21)and 23 days(ΔH1through ΔH23),and rainfalls within the previous 23 days(P1throughP23)and 16 days(P1throughP16),were respectively considered in the initial SVM models of R1 and R3.Therefore,taking the temperature factors and the two current factors(ΔH0andP0)into account,there were in total 50 and 45 input factors,respectively,for the two initial SVM models.
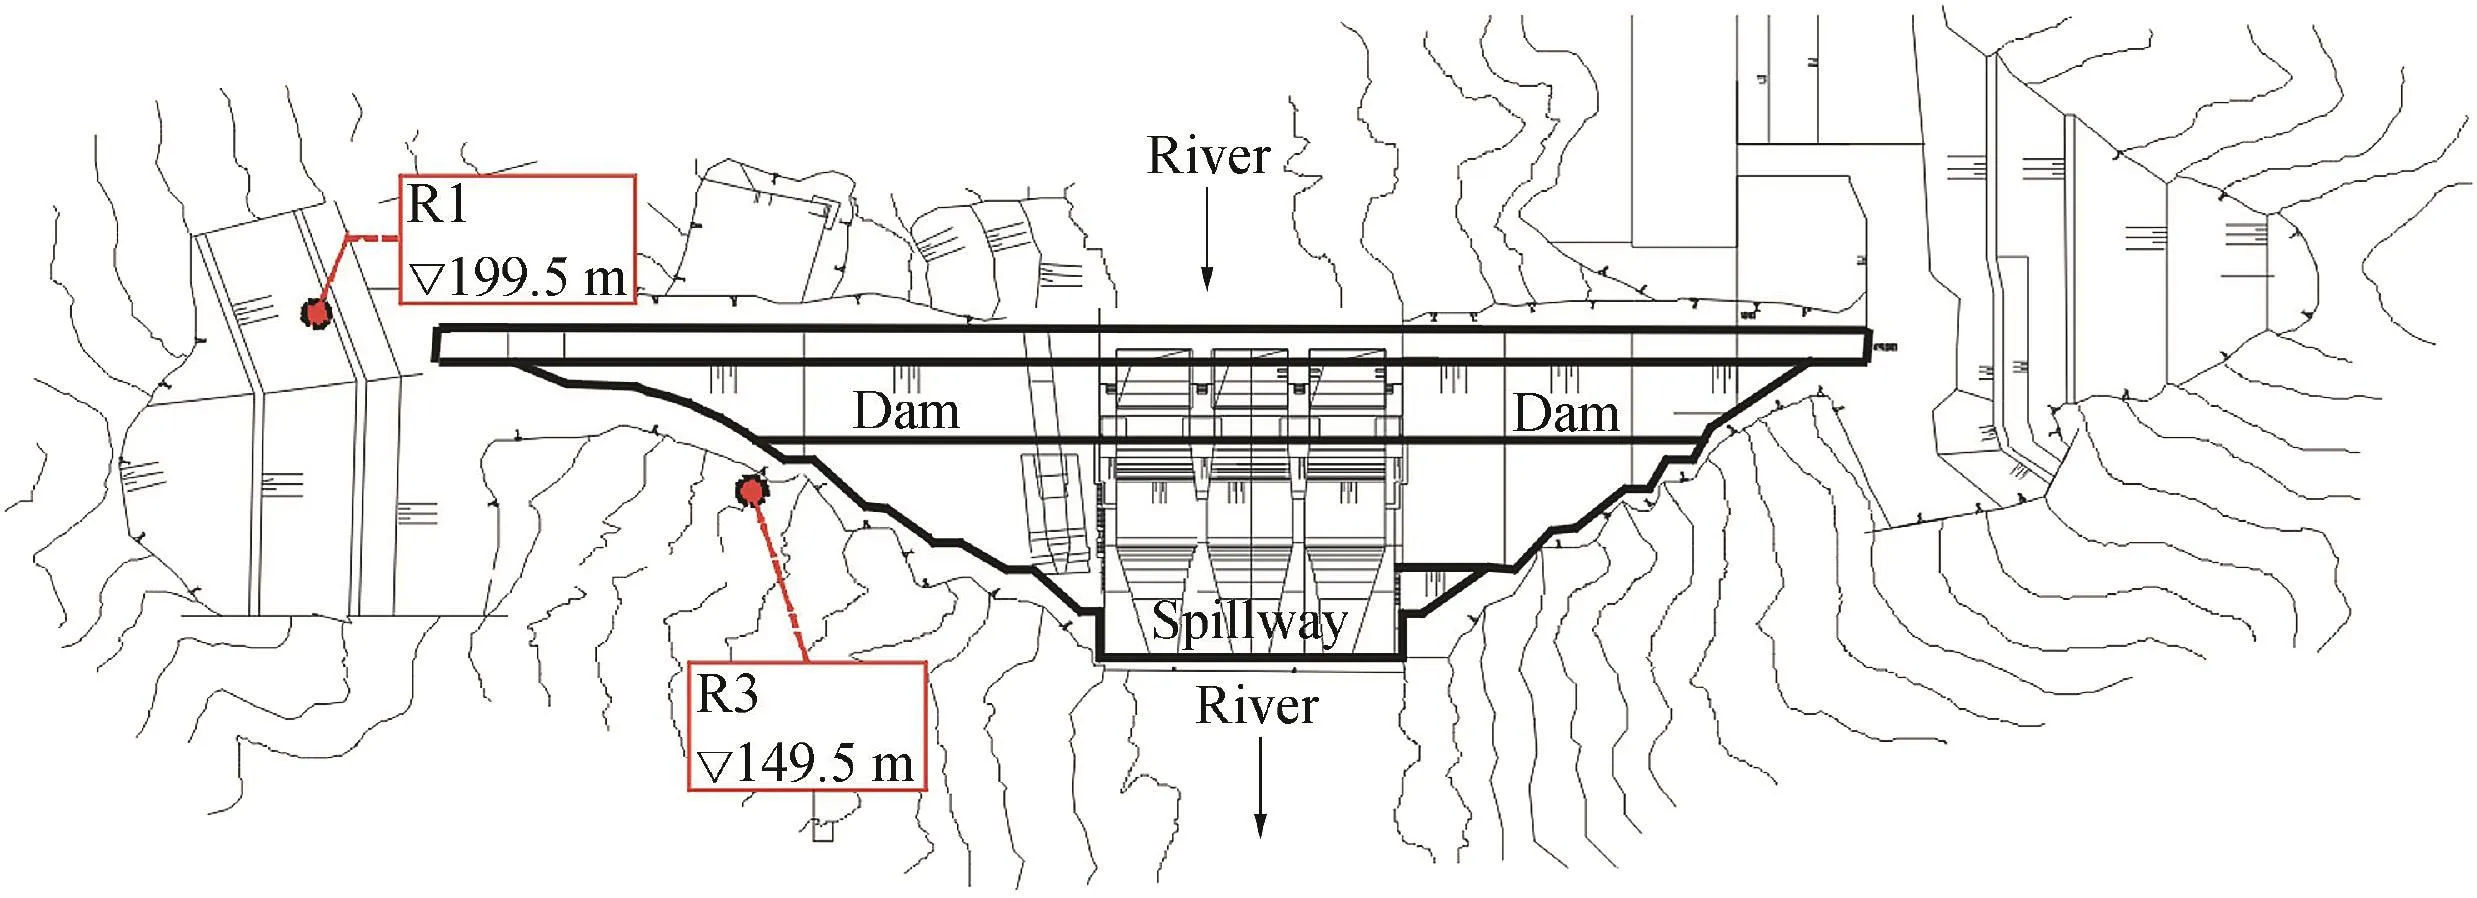
Fig.5.Plane layout of dam and locations of piezometric tubes.
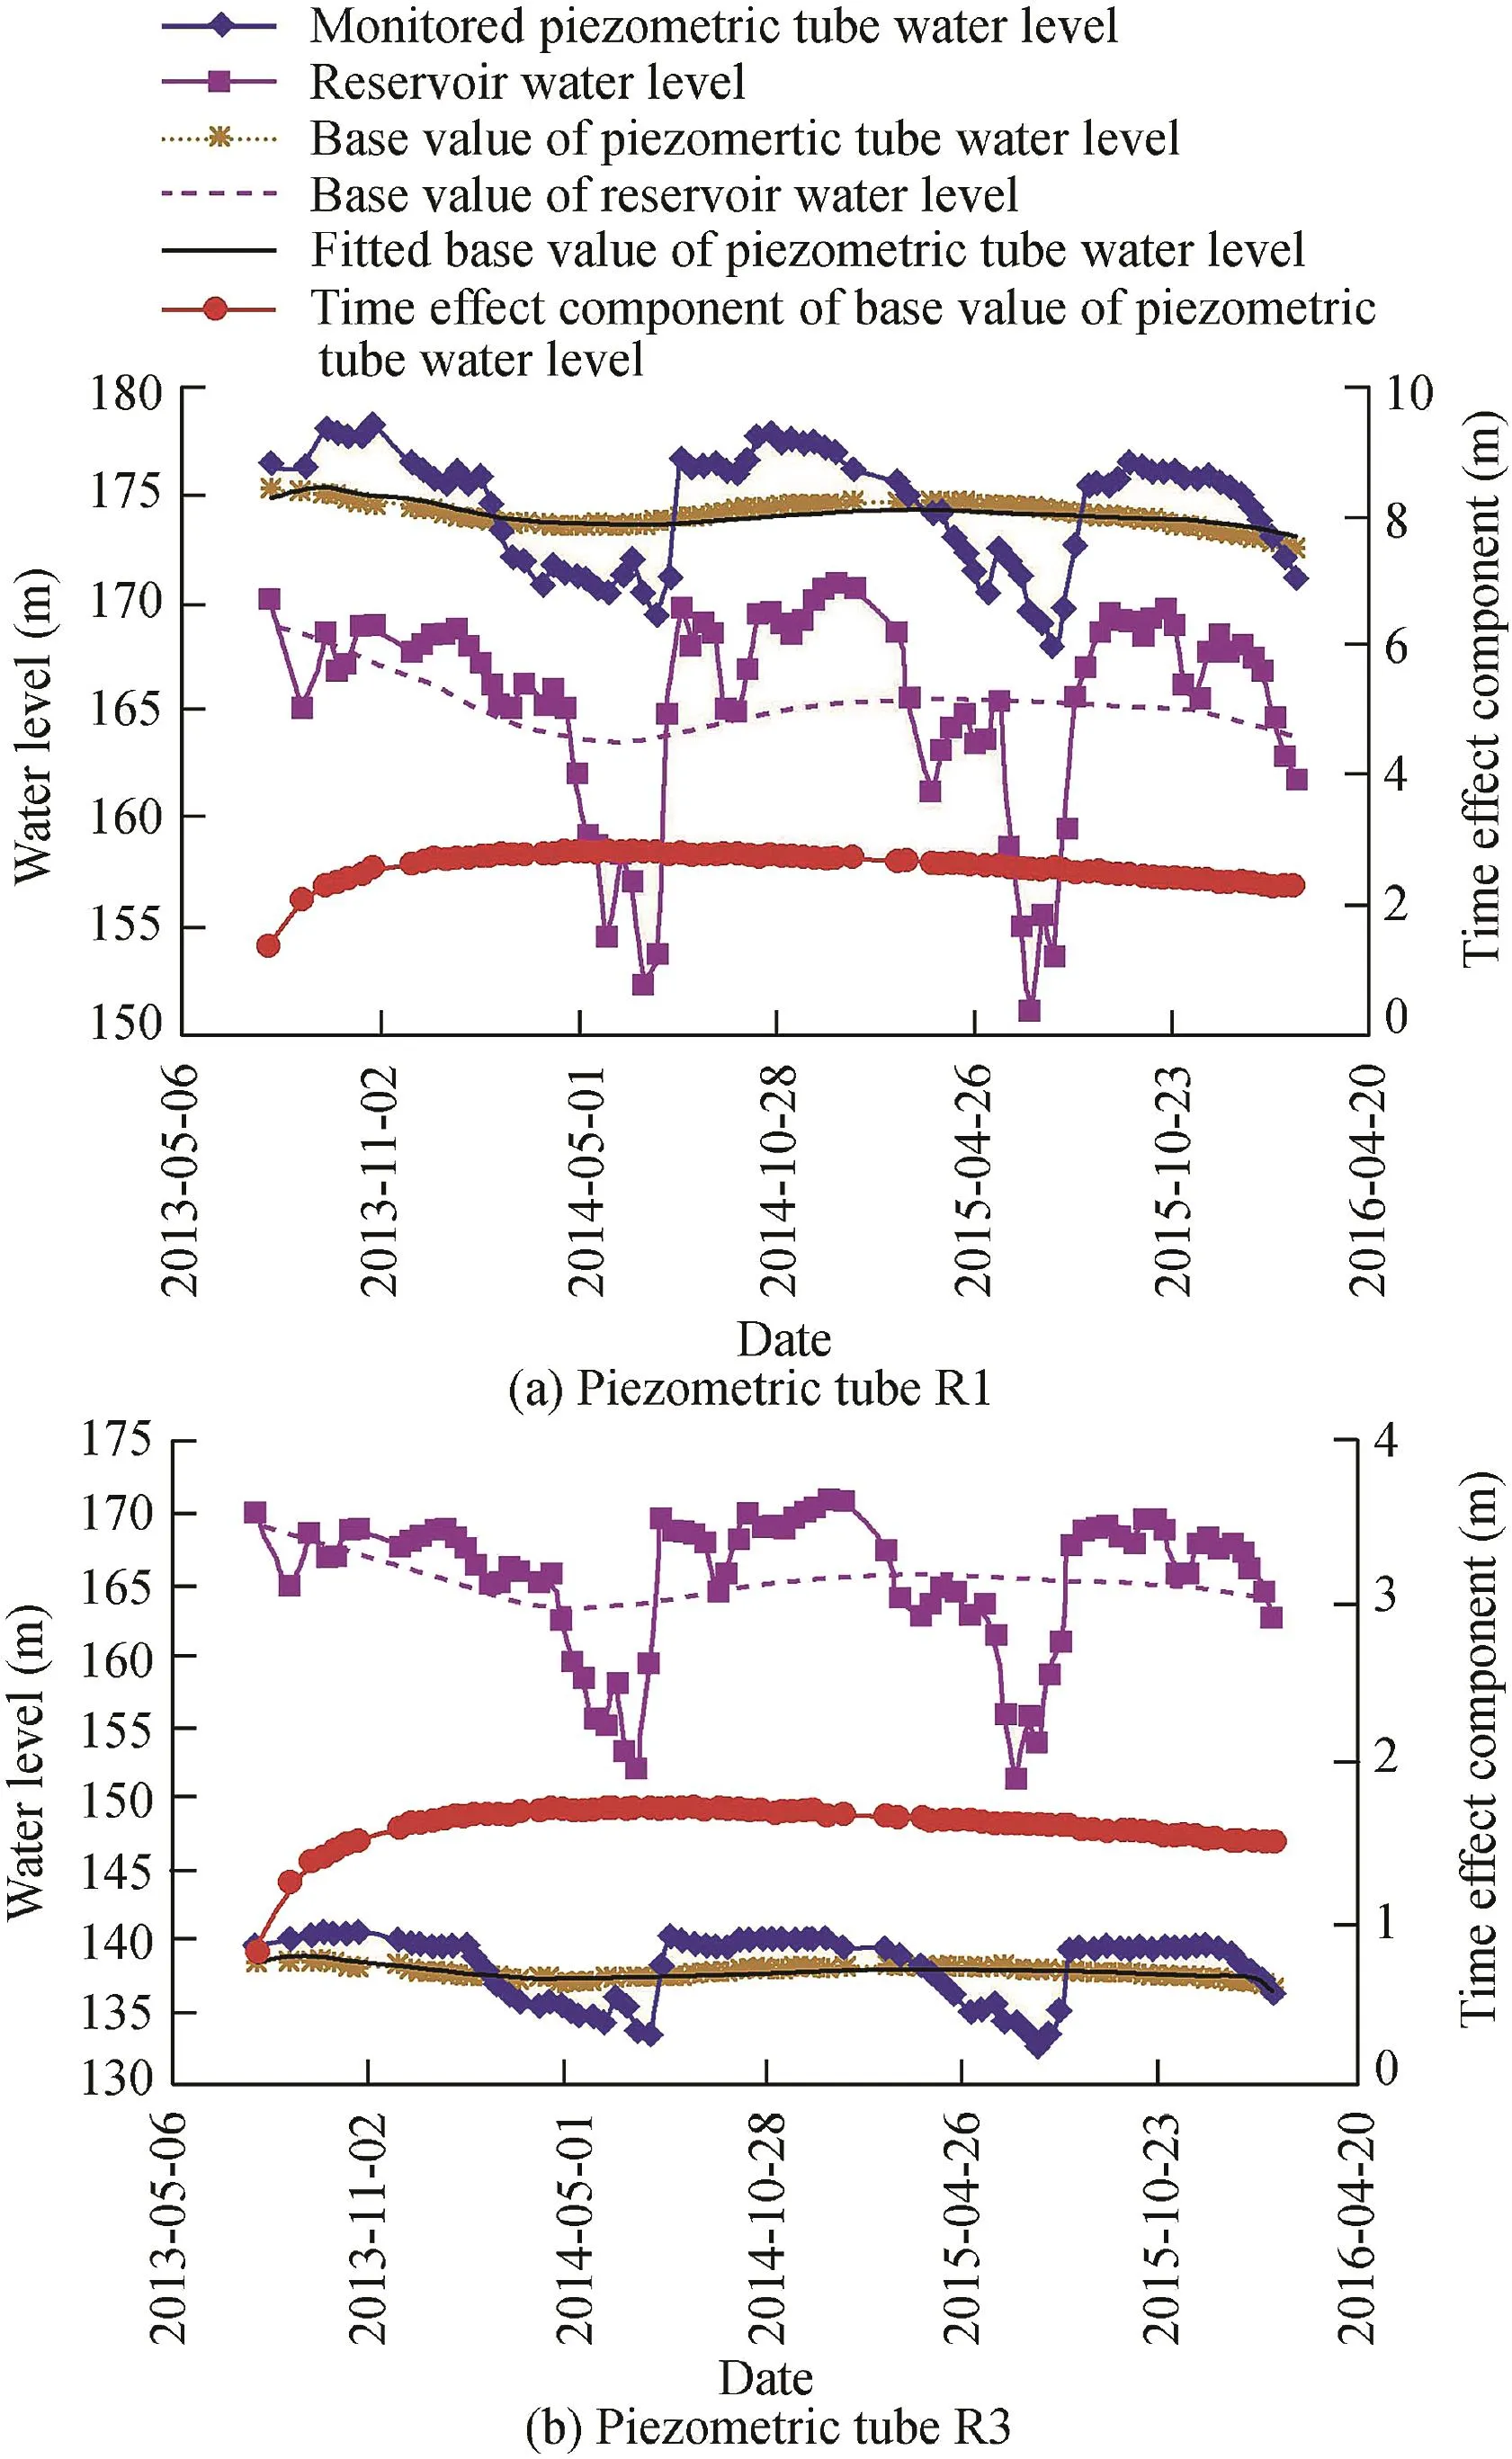
Fig.6.Time series of two piezometric tube water levels and reservoir water level.
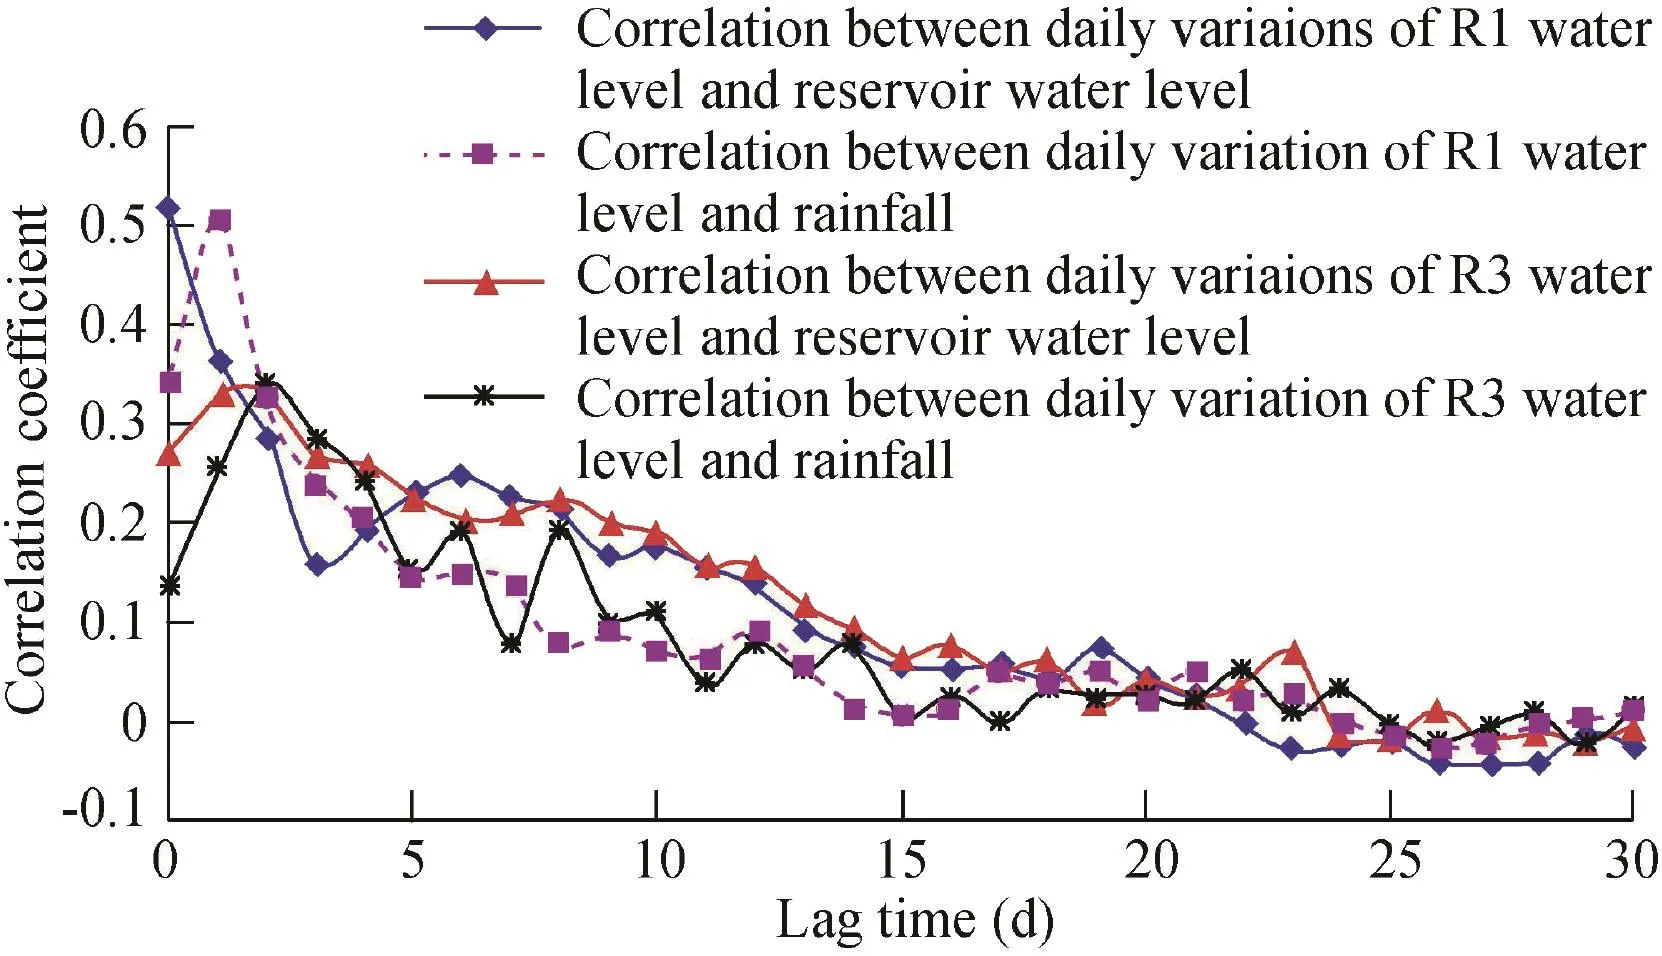
Fig.7.Relationships between lag time and correlation coefficient between daily variation of piezometric tube water level and its previous factors.
According to Fig.4,the daily variation SVM model was established for the water levels of the two piezometric tubes.The total number of monitoring samples was 630,of which 600 samples were used for training the SVM model and the remaining 30 samples were used for testing.Evolution of theMSEvalue during the process of optimizing the SVM model input factors is shown in Fig.8,which demonstrates that the minimumMSEvalues were 7.5×10⁻³and 4.46×10⁻³for R1 and R3,respectively.The SVM model input factor optimization processes for R1 and R3 are shown in Tables 1 and 2,respectively,in which 29 and 21 input factors were respectively eliminated in turn for the SVM models of R1 and R3.A threshold of theMSEincrease ratio,relative to the minimumMSEvalue of each optimization process,was preset as 5%in this study.Therefore,the 29th model and 21st model,with the optimalMSEvalues of 7.87×10⁻³and 4.49×10⁻³,were respectively determined to be the best daily variation SVM models for R1 and R3.
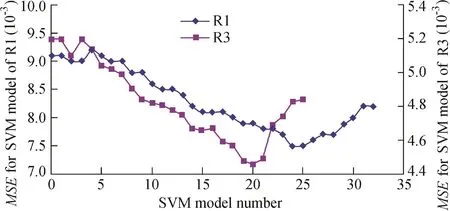
Fig.8.Evolution of MSE during process of optimizing SVM model input factors.
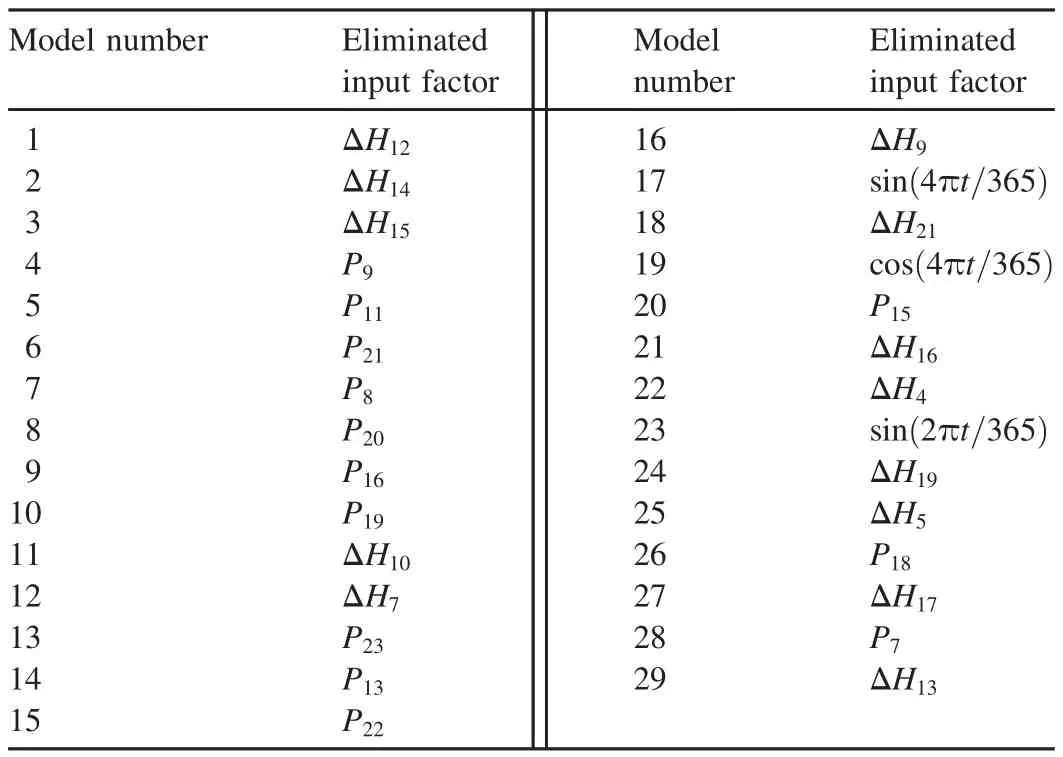
Table 1 Input factor optimization process for SVM model of R1.
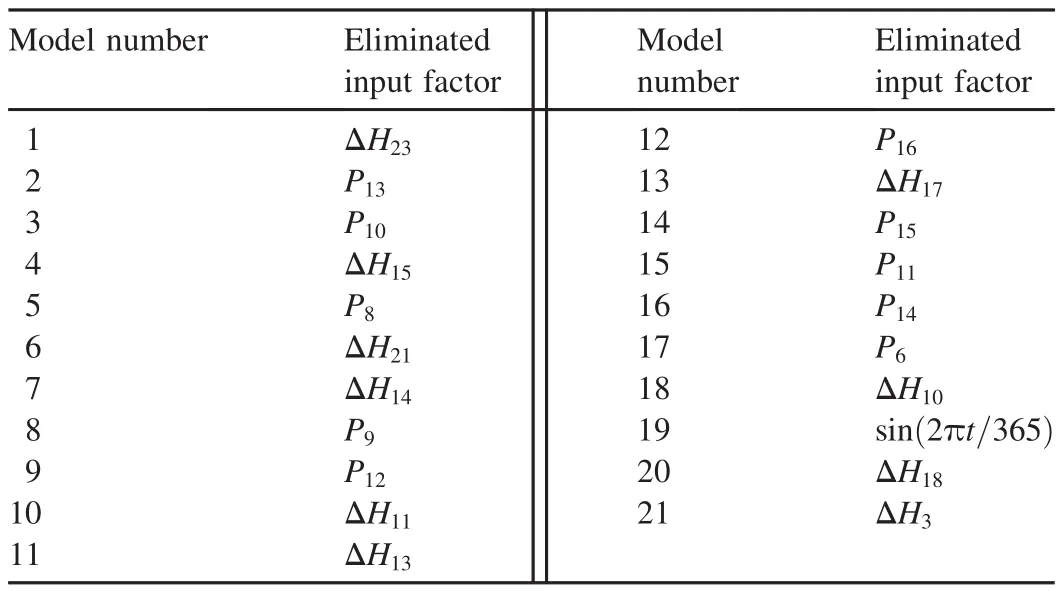
Table 2 Input factor optimization process for SVM model of R3.
With the optimized SVM model and its input factors,the daily variations of the two piezometric tube water levels were respectively fitted,as shown in Fig.9.As can be seen,the daily variations of the monitored value and the fitted value of the SVM model are basically the same,except for a few large errors caused by monitoring errors or some other reasons.Therefore,the established daily variation SVM model can be used to predict and evaluate the fluctuation of the piezometric tube water level with the change of environmental factors.
To evaluate the accuracy of the optimized SVM model,boxplots of residuals were used to conduct the error analysis.The boxplot consisted of the mean,the median,the upper quartileQ3,the lower quartileQ1,and the minimum and maximum values of the residuals.Outliers could be identified when they were beyond the minimum limit and maximum limit.Boxplots of residuals for the optimized SVM model and initial SVM model are shown in Fig.10,in which the small box is used to express the mean value.The figure clearly shows that the optimized SVM models for R1 and R3 have no outliers,and the residuals are in normal distribution.Therefore,the data mining ability of the optimized SVM model is better than that of the initial SVM model.
5.3.Discussion
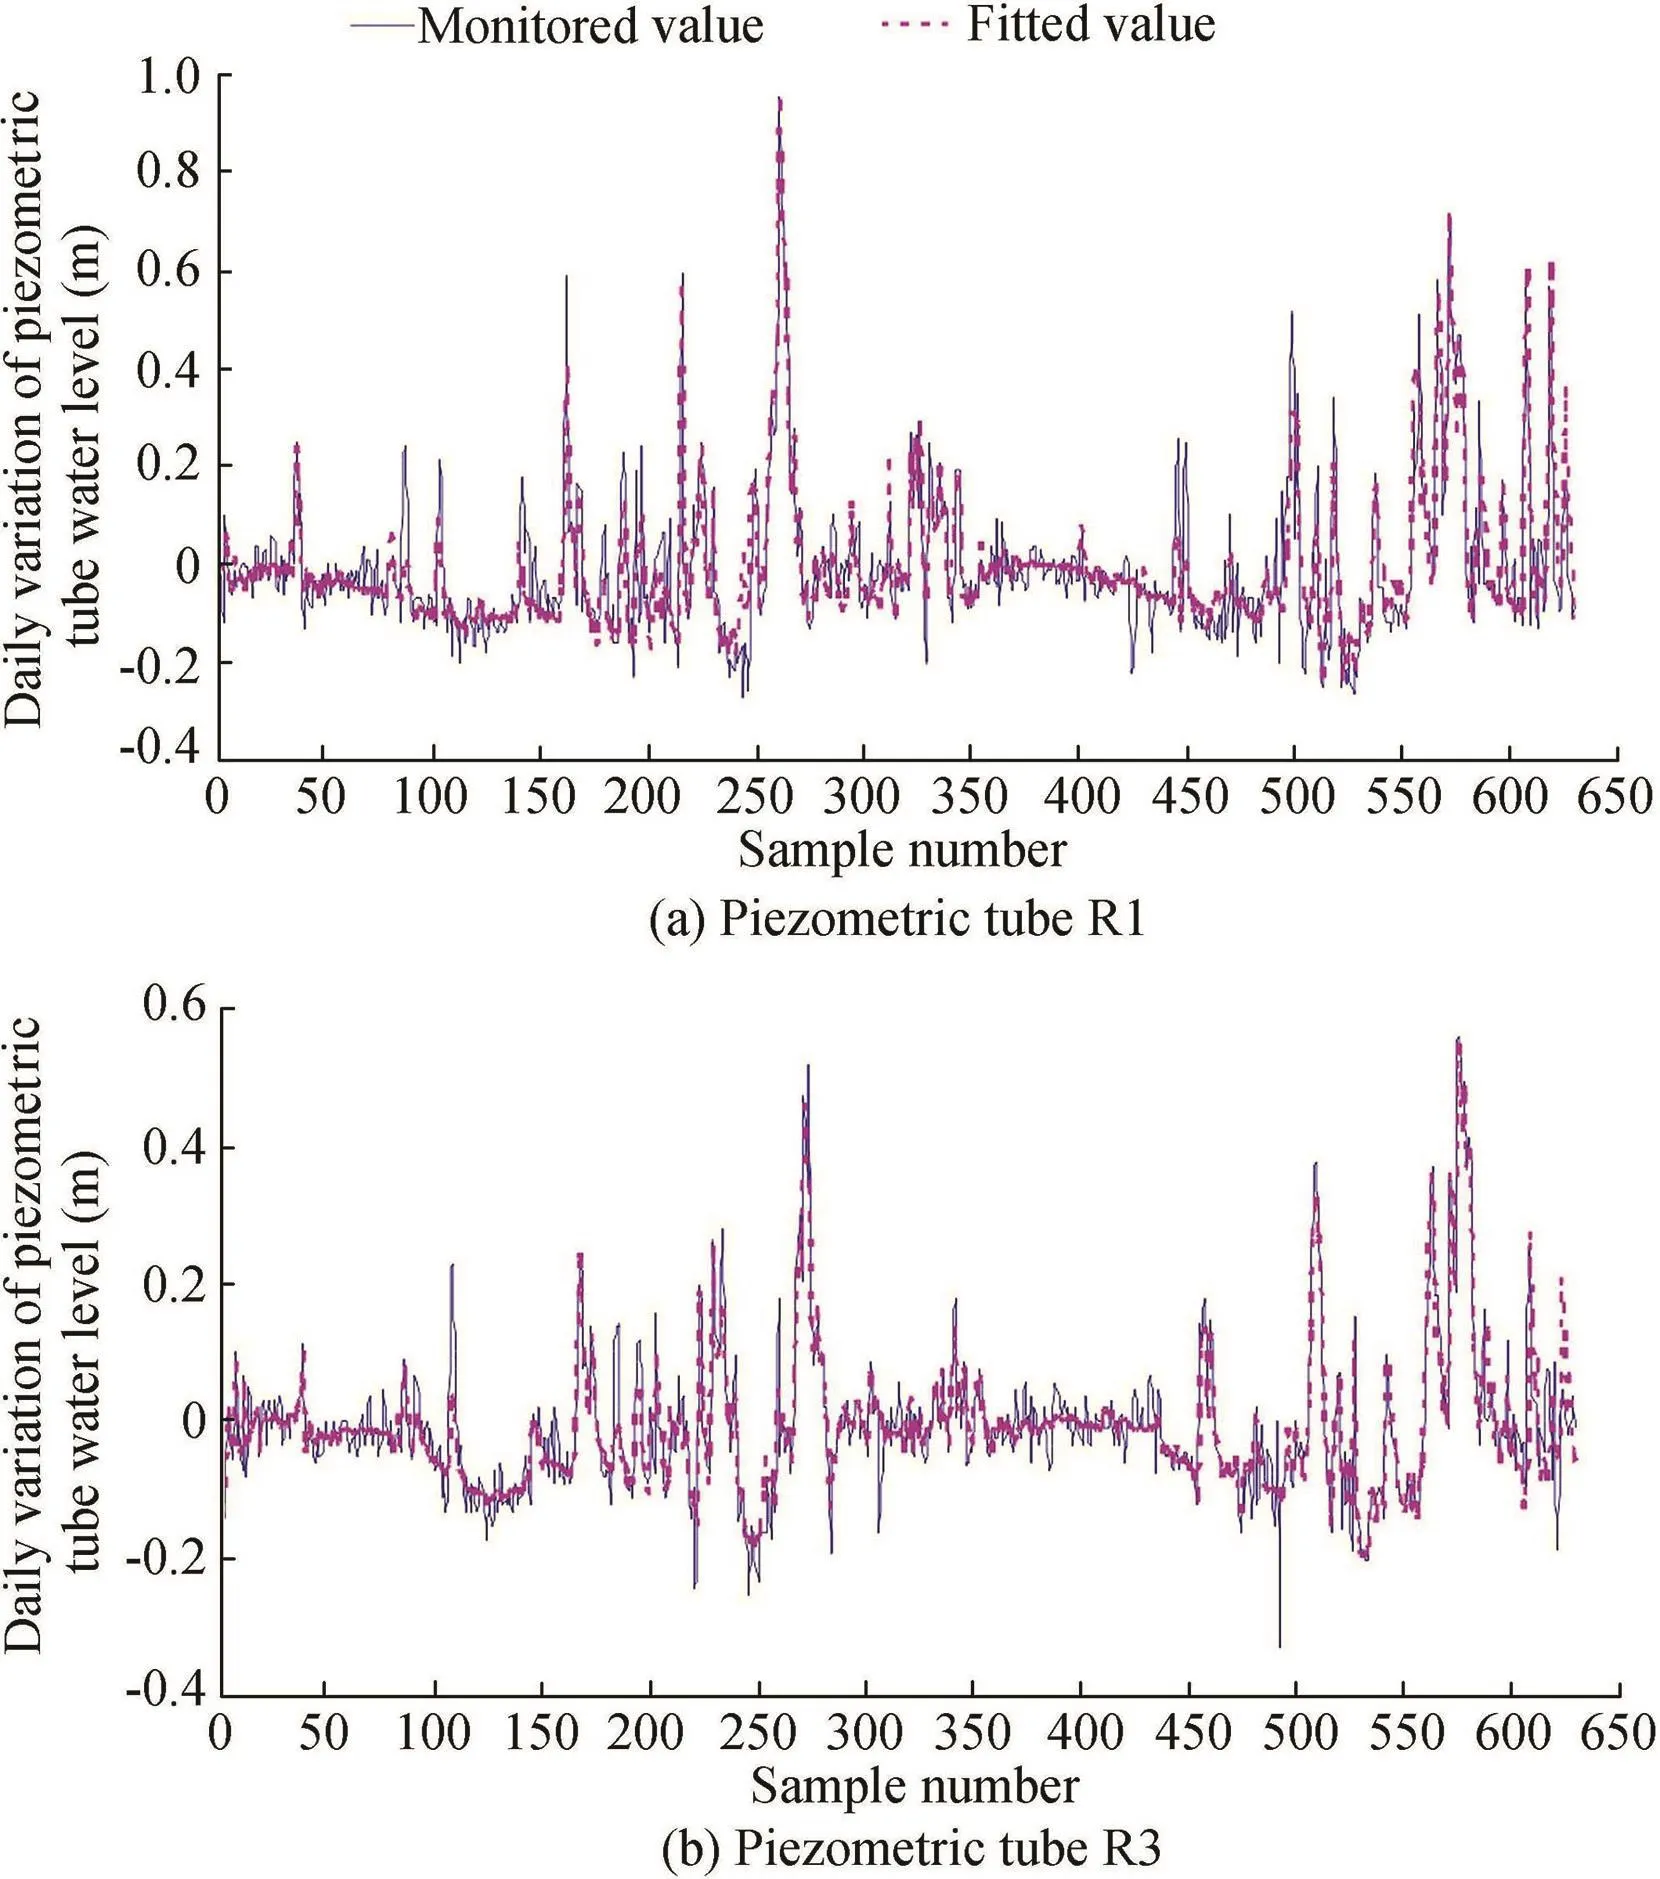
Fig.9.Monitored and fitted daily variations of piezometric tube water level.
Traditional HPTT models were also established for R1 and R3 with the stepwise regression method.Regression coefficients in Eq.(1)are shown in Table 3,and time series of the separated components are shown in Fig.11.It needs to be noted that these two piezometric tubes were all located higher than the downstream reservoir water level,so the downstream hydraulic componenthdwas not considered in the HPTT model.It can be seen that the time effect components separated by the proposed base flow effect monitoring model and the traditional HPTT model are very close,and the maximum values were 2.80 m and 2.83 m for R1,and 1.62 m and 1.38 m for R3,respectively.During the stepwise regression process,the previous factorsH1andH2were eliminated,whileH0,,andwere retained.This phenomenon is not consistent with the seepage lag effect,which presents with a continuous normal distribution,indicating that the HPTT model could not fully explain the variation of the piezometric tube water level in this study.
Fig.11 shows that the proportions of rainfall and temperature components are very small,and the base value of the piezometric tube water level is mainly interpreted by the hydraulic component and time effect component.Fig.12 shows the time series of the fitted base values of the piezometric tube water level.It can be seen that the fitted base values obtained by the two methods are almost consistent,and the proposed method can better reflect the tendency change.Therefore,the proposed base flow effect monitoring model is feasible.
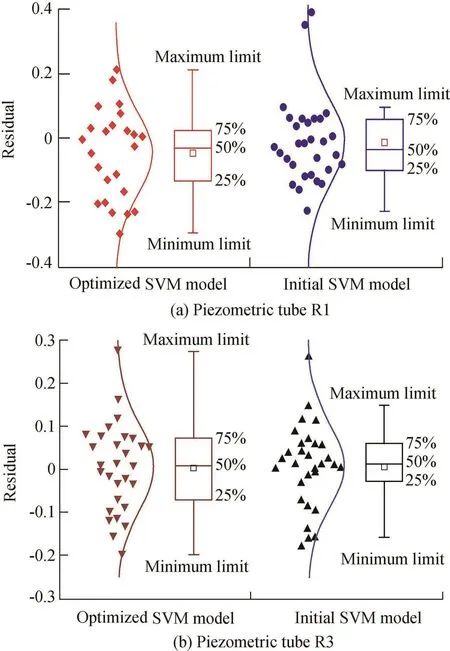
Fig.10.Boxplots of residuals for optimized SVM model and initial SVM model.
Sensitivity analysis of the input factors of the daily variation SVM models for R1 and R3 was conducted.The distributions of sensitivities of the daily variation of the upstream reservoir water level and rainfall with lag time are shown in Figs.13 and 14.The results show the following:(1)Sensitivities of the daily variation of the upstream reservoir water level and rainfall follow normal distribution,especially for the daily variation of the upstream reservoir water level of the SVM model for R1 and the rainfall of the SVM model for R3.It is in accordance with the results that the influences of the reservoir water level and rainfall on seepage elements follow normal distribution(Gu and Wu,2006;Qiu et al.,2016).(2)Sensitivities of rainfall input factors are obviously higher than those of the daily variation of the upstream reservoir water level,e.g.,for the SVM model of R1,the maximum sensitivities of rainfall and the daily variation of the upstream reservoir water level were 0.5705(P1)and 0.1797(ΔH6),and the average sensitivities of rainfall and the daily variation of the upstream reservoir water level were 0.1686 and 0.1115,respectively.This means that rainfall has a more significant impact on the piezometric tube water level.The reason for this is that these two piezometric tubes were buried under the slope of the dam's right bank,which made the rainfall more likely to seep into the piezometric tube than reservoir water.(3)The seepage lag time and influencing period of rainfall are both shorter than those of the daily variation of the upstream reservoir water level.For the rainfall,the seepage lag time and influencing period were one day and three days for R1,and one day and six days for R3,respectively.However,the difference between influences caused by the previous daily variations of the upstream reservoir water level on the two piezometer tube water levels is not clear,and the lag time and influencing period of the daily variation of the upstream reservoir water level for R3 were determined to be four days and eight days,respectively.This phenomenon can be interpreted by the fact that the seepage path of rainfall is shorter than that of the upstream reservoir water.

Table 3 Coefficients of HPTT models for R1 and R3.
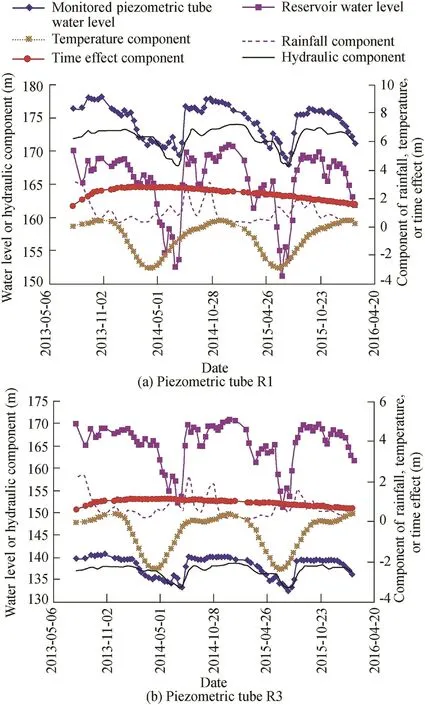
Fig.11.Time series of separated components obtained with HPTT model.
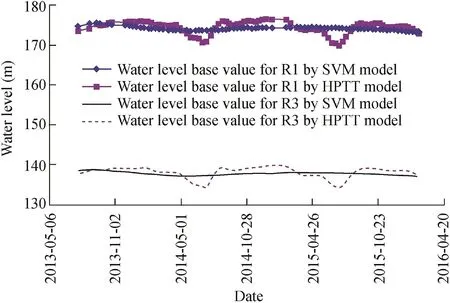
Fig.12.Time series of fitted base value of piezometric tube water level.
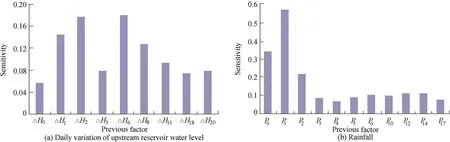
Fig.13.Sensitivity distributions of daily variation of upstream reservoir water level and rainfall for SVM model of R1.
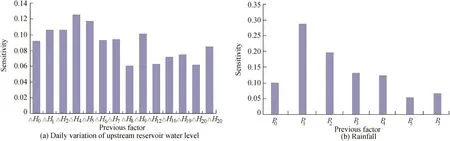
Fig.14.Sensitivity distributions of daily variation of upstream reservoir water level and rainfall for SVM model of R3.
The aforementioned analyses can also verify the rationality of the proposed daily variation SVM model.In contrast to theMSEvalues of the initial SVM model with non-optimized input factors,which were 9.14×10⁻³and 5.22×10⁻³for R1 and R3,respectively,theMSEvalues of the optimized SVM model were 7.87×10⁻³and 4.49×10⁻³for R1 and R3,13.4%and 14.0%lower,respectively.On the other hand,the time intervals between the monitoring time of the remaining input factors after optimization and that of the piezometric tube water level are generally smaller,and the sensitivity distributions of the input factors accord with the lag influence rule of unsteady seepage,which present with continuous normal distribution.
6.Conclusions
To investigate the base flow effect and time lag effect of unsteady seepage,monitoring models for the base flow effect and daily variation of dam seepage elements were respectively established to predict and evaluate the long-term trend and short-term fluctuation of the dam seepage behavior in this study.The following conclusions are drawn:
(1)The base flow effect of the piezometric tube water level is mainly interpreted by the hydraulic component and time effect component.The time effect component and fitted base value obtained with the proposed base flow effect monitoring model are close to those obtained with the traditional HPTT model,and the interpretation rationality of the proposed model is better than that of the traditional HPTT model.Therefore,the proposed base flow effect monitoring model is feasible.
(2)Sensitivity analysis of the input factors of the optimized SVM model shows that the influences of the daily variation of the reservoir water level and rainfall on the daily variation of the piezometric tube water level follow normal distribution.The SVM-based sensitivity analysis can also be used to optimize the lag time and influencing period in the equivalent value method of the statistical model.
(3)Under the normal condition of a dam-foundation impervious curtain,the seepage behavior of the dam bank slope is more likely influenced by rainfall,while the difference between the influences caused by the previous daily variations of the upstream reservoir water level on seepage elements is not clear.The time lag effect of external factors on seepage elements should be considered in diagnosing the abnormity of dam seepage behavior.
 Water Science and Engineering2018年4期
- Water Science and Engineering的其它文章
- Numerical models and theoretical analysis of supercritical bend flow
- A regional suspended load yield estimation model for ungauged watersheds
- Free-surface long wave propagation over linear and parabolic transition shelves
- A comparative study of pseudo-static slope stability analysis using different design codes
- A simple permanent deformation model of rockfill materials
- Seismic design of Xiluodu ultra-high arch dam