
西安南郊夏季空气二氧化碳浓度时空变化
2017-11-15 06:39周点芳赵景波
地球环境学报 2017年5期
成 洁,宋 怡,李 黎,周点芳,赵景波,
1.陕西师范大学 旅游与环境学院,西安 710119
2.中国科学院地球环境研究所 黄土与第四纪地质国家重点实验室,西安 710061
西安南郊夏季空气二氧化碳浓度时空变化
成 洁1,宋 怡1,李 黎1,周点芳1,赵景波1,2
1.陕西师范大学 旅游与环境学院,西安 710119
2.中国科学院地球环境研究所 黄土与第四纪地质国家重点实验室,西安 710061
利用红外CO2监测仪对西安南郊3种人工植被不同高度下空气CO2浓度分别进行了3次昼夜观测,探讨了不同高度空气中CO2的浓度动态日变化规律及其影响因素。结果表明:西安南郊地区夏季一昼夜内空气中CO2浓度具有明显变化,从当日上午08:00到次日上午08:00,空气中CO2浓度变化呈现出由高变低再变高的规律,这种变化特点与昼夜温度变化基本一致,但两者在时间上并不完全同步。CO2浓度昼夜变化分为四个阶段,第一阶段在08:00 — 12:00,为CO2浓度较高阶段,平均浓度为516 μL ∙ L−1;第二阶段在13:00 — 21:00,为CO2浓度最低阶段,平均浓度为483 μL ∙ L−1;第三阶段在22:00到次日04:00,为CO2浓度较低阶段,平均浓度为502 μL ∙ L−1;第四阶段在05:00 — 07:00,为CO2浓度最高阶段,平均浓度为533 μL ∙ L−1。在2 m高度范围内,空气中CO2浓度与高度呈负相关关系,与空气湿度呈正相关关系,风速对CO2昼夜浓度影响较小。白天光合作用强,空气对流作用强,空气中CO2浓度明显低于夜间。
西安南郊;空气CO2浓度;昼夜变化阶段与规律;影响因素;人工植被
CO2气体是人类活动向大气排放的主要温室气体之一,它在自然条件下无法像水汽一样发生相变进而自发调节在大气中的含量(刘晓曼等,2015)。它强烈的温室效应对气候变暖的作用远超过其他气体(童心刚和赵景波,2003)。世界气象组织《温室气体公报》第11期指出,2014年全球范围内大气 CO2的浓度已经达到 397.7 μL ∙ L−1,是工业革命前的143%,且大气CO2浓度上升与水汽互相作用放大了温室效应(World Meteorological Organization,2015)。 因此,空气中CO2浓度的变化引起了科学家们的广泛关注,其中源汇平衡是研究的一个重要热点问题(Bouwman,1990;Anderson,1995;高峰等,2001;李银鹏和季劲钧,2001;Topp and Pattey,2001;贺玉龙和戴本林,2010)。目前对CO2浓度的变化研究比较多。前人的观测表明,校园CO2浓度变化具有明显的昼夜变化和空间变化,昼夜变化趋势呈“V”型曲线(叶尔江∙拜克吐尔汉等,2015),但是对不同高度空气中CO2浓度的变化以及温度、湿度、风速等因素对CO2浓度影响的研究比较少。过去对西安地区土壤CO2释放浓度昼夜变化研究显示,西安东南部不同地点和不同土层中CO2释放规律基本相同(赵景波等,2001;郝玉芬和童心刚,2008),这主要是昼夜土壤温度变化的规律性以及土壤微生物活动的规律性决定的。本文通过分别对3个观测点不同高度空气中CO2浓度的3次昼夜观测,探讨空气中CO2浓度的昼夜变化规律和在高度上的变化,以及CO2浓度与温度、湿度、风速关系。
1 研究地区概况与方法
1.1 研究地区概况
研究区位于西安南郊,地处陕西关中平原中部,渭河之南,秦岭之北,处于渭河二级阶地之上。研究地区属于暖温带半湿润大陆性季风气候,四季分明。褐土发育极为广泛,地表土层以马兰黄土为主,土质疏松且较为均一(陕西师范大学地理系,1988),土层本身对CO2释放量影响小,是观测CO2的理想土层。经过长期的人为改造,该区天然植被已不存在,现代植被以人工林为主(李艳花和赵景波,2006)。
1.2 研究方法
为使研究结果具有代表性,本研究在西安南郊陕西师范大学雁塔校区校园内选择了3个观测点,在天气晴朗的6月21 — 22日,7月17 — 18日和7月21 — 22日对3个观测点分别进行了3次昼夜观测。
观测点A位于陕师大雁塔校区牡丹园内,主要植物以灌木类芍药科植物牡丹(Paeonia suffruticosaAndr.)为主(陈颖,2012),地面土壤较干燥。观测点B位于校园内雪松(Pinaceae)乔木林下,植株高约15 m,植株间距5 m,直径约为90 cm,地面土壤较潮湿。观测点C位于校园内柿子(Ebenaceae)林下,柿子树高5 — 8 m,直径10 — 20 cm,植株间距为2 m,地表土壤较为干燥。利用红外CO2监测仪分别对取样点地面之上0.2 m、1 m和2 m高度空气中的CO2浓度进行昼夜监测,每个小时测定一次,同时测量地面之上0.2 m、1 m和2 m高度处的气温、风速、湿度。利用Excel软件进行分析处理观测结果。
2 结果与分析
2.1 CO2浓度日变化特征
3个观测点三次昼夜观测结果见图 1、图2、图3。根据图1、图2、图3CO2浓度变化,可以将CO2变化浓度曲线分为四个阶段。

图1 西安南郊6月21 — 22日CO2浓度昼夜变化Fig.1 CO2 concentration variation from June 21 to June 22 in south suburb of Xi’an

图2 西安南郊7月17 — 18日CO2浓度和温度昼夜变化Fig.2 CO2 concentration and temperature variation from July 17 to July 18 in south suburb of Xi’an
图1表 明,6月21 — 22日 第 一 阶 段 在08:00 — 12:00,CO2浓度变化范围为 480 — 510 μL ∙ L−1,平均浓度为 492 μL ∙ L−1,该阶段 CO2浓度较高,浓度呈逐渐减小趋势。第二阶段在13:00 — 21:00,CO2浓度变化范围为 420 — 490 μL ∙ L−1,平均浓度为 466 μL ∙ L−1,该阶段 CO2浓度最低,呈先下降后上升变化特点。第三阶段在22:00到次日04:00,CO2浓度变化范围为 470 — 510 μL ∙ L−1,平均浓度为 488 μL ∙ L−1,该阶段 CO2浓度较低,呈上升趋势。第四阶段在05:00 — 07:00,CO2浓度变化范围为 520 — 570 μL ∙ L−1,平均浓度为539 μL ∙ L−1,该阶段 CO2浓度最高,呈先上升后下降的变化。
由图2可知,7月17 — 18日CO2浓度变化第一阶段在08:00 — 12:00,CO2浓度变化范围是 500 — 570 μL ∙ L−1, 平 均 浓 度 为 536 μL ∙ L−1,呈下降趋势,该阶段CO2浓度较高。第二阶段在 13:00 — 21:00,CO2浓 度 变化 范 围为 430 —540 μL ∙ L−1, 平 均 浓 度 是 490 μL ∙ L−1, 呈 先 下降后上升的变化特点,CO2浓度最低。第三阶段在22:00到次日04:00,CO2浓度变化范围为480 — 560 μL ∙ L−1, 平 均 浓 度 为 512 μL ∙ L−1, 呈上升的趋势,该阶段CO2浓度较低。第四阶段在 05:00 — 07:00,CO2浓度变 化范 围 为 510 —580 μL ∙ L−1,平均浓度是 544 μL ∙ L−1,呈先上升后下降的变化特点,CO2浓度最高。

图3 西安南郊7月21 — 22日CO2浓度和温度昼夜变化Fig.3 CO2 concentration and temperature variation from July 21 to July 22 in south suburb of Xi’an
图3显示,7月21 — 22日CO2浓度昼夜变化的第一阶段在08:00 — 12:00,CO2浓度变化范围 为 500 — 560 μL ∙ L−1, 平 均 浓 度 为 520 μL ∙ L−1,浓度较高,呈下降趋势。第二阶段在13:00 —21:00,CO2浓 度 变 化 范 围 为 460 — 580 μL ∙ L−1,平均浓度为 493 μL ∙ L−1,浓度最低,呈先下降后上升的变化特点。第三阶段在22:00到次日04:00,CO2浓度变化范围为 480 — 550 μL ∙ L−1,平均浓度为 507 μL ∙ L−1,浓度较高,呈先下降后上升的变化特点。第四阶段在05:00 — 07:00,CO2浓度变化范围为 500 — 540 μL ∙ L−1,平均浓度517 μL ∙ L−1,浓度最高,变化较小。
2.2 CO2浓度在高度上的变化
2.2.1 A点CO2浓度在高度上的变化
根据A点地面以上0.2 m、1 m和2 m处3次昼夜观测结果(表1)作出了图4。由表1和图4可知,6月21 — 22日A观测点地面之上0.2 m处、1 m处、2 m处CO2浓度昼夜变化范围分别在 420 — 550 μL ∙ L−1、420 — 590 μL ∙ L−1、430 —540 μL ∙ L−1, 平 均 浓 度 为 分 别 为 492 μL ∙ L−1、484 μL ∙ L−1、475 μL ∙ L−1。 地 面 之 上 0.2 m 处 CO2浓度最高值为 550 μL ∙ L−1,并列出现在 05:00 和14:00,最低值为 420 μL ∙ L−1出现在 20:00。地面之 上 1 m 处 CO2浓 度 最 高 值 为 590 μL ∙ L−1,都出现在 15:00,最低值为 420 μL ∙ L−1,出现在20:00。地面之上 2 m 处最高值为 540 μL ∙ L−1,出 现 在 06:00, 最 低 值 为 430 μL ∙ L−1, 出 现 在20:00。地面之上0.2 m处空气中CO2浓度最高,1 m处空气中CO2浓度居中,2 m处空气中CO2浓度最低。
7月17 — 18日A观测点地面之上0.2 m处、1 m处、2 m处CO2浓度昼夜变化范围分别 在 450 — 570 μL ∙ L−1、440 — 560 μL ∙ L−1、440 — 560 μL ∙ L−1,平均浓度分别为 521 μL ∙ L−1、516 μL ∙ L−1、514 μL ∙ L−1。 地 面 之 上 0.2 m 处CO2浓度最高值为 570 μL ∙ L−1,出现在 06:00,最低值为 450 μL ∙ L−1,出现在 17:00。地面之上1 m 处空气中 CO2浓度最高值为 560 μL ∙ L−1,并列出现在08:00和09:00,最低值为440 μL ∙ L−1, 出 现 在 17:00。 地 面 之 上 2 m 处CO2浓 度 最 高 值 为 560 μL ∙ L−1, 并 列 出 现 在08:00 和 09:00,最低值为 440 μL ∙ L−1,出现在17:00。地面之上0.2 m处空气中CO2浓度最高,1 m处空气中CO2浓度居中,2 m处空气中CO2浓度最低。
7月21 — 22日A观测点地面之上0.2 m处、1 m处、2 m处CO2浓度昼夜变化范围分别是 470 — 580 μL ∙ L−1、470 — 540 μL ∙ L−1、470 —540 μL ∙ L−1, 平 均 浓 度 为 分 别 为 517 μL ∙ L−1、507 μL ∙ L−1、508 μL ∙ L−1。地面之上 0.2 m 处空气中 CO2浓度最高值为 580 μL ∙ L−1,出现在 21:00,最低值为 470 μL ∙ L−1,出现在 14:00。地面之上1 m 处 空 气 中 CO2浓 度 最 高 值 为 540 μL ∙ L−1,并列出现在02:00、06:00、21:00,最低值为470 μL ∙ L−1出现在 14:00。地面之上 2 m 处最高值为 540 μL ∙ L−1,并列出现在 06:00 和 21:00,最低值为 470 μL ∙ L−1,出现在 14:00。地面之上 0.2 m 处空气中CO2浓度最高,1 m处空气中CO2浓度最低,2 m处空气中CO2浓度居中。

表1 A点不同高度下空气CO2的浓度变化Tab.1 Air CO2 concentration changes at different height in location A
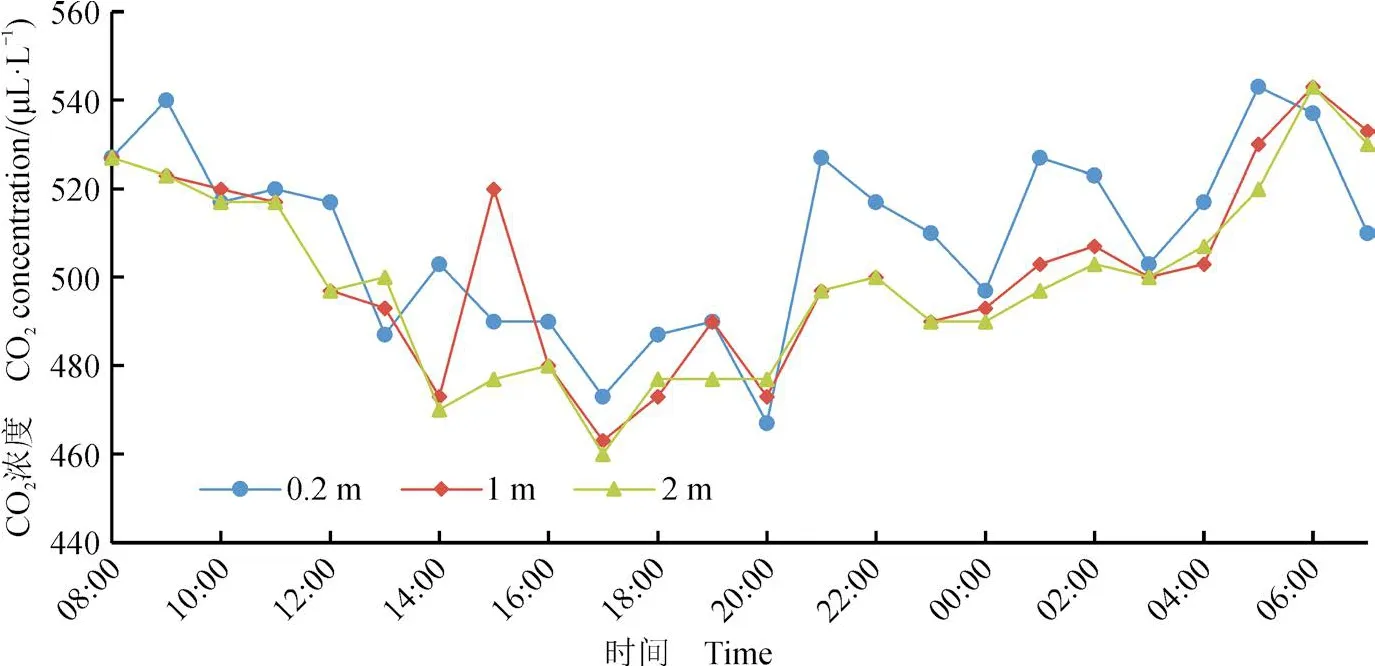
图4 西安南郊A地空气中CO2浓度日变化Fig.4 CO2 concentration variation at location A in south suburb of Xi’an
2.2.2 B点CO2浓度在高度上的变化
根据B点地面以上0.2 m、1 m和2 m处进行3次昼夜观测结果(表2)做出了图5。由图5可知,在6月21 — 22日地面之上0.2 m、1 m和2 m处CO2浓度昼夜变化范围分别是 420 — 580 μL ∙ L−1、430 — 570 μL ∙ L−1、430 — 560 μL ∙ L−1, 平 均 浓 度 分别 为 497 μL ∙ L−1、499 μL ∙ L−1、489 μL ∙ L−1。 地 面之上 0.2 m 处空气中 CO2浓度最高值为 570 μL ∙ L−1,出 现 在 06:00,CO2浓 度 最 低 值 为 430 μL ∙ L−1,出现在 17:00。1 m处空气中CO2浓度最高值为560 μL ∙ L−1,并列出现在 06:00 和 11:00,CO2浓度最低值为 440 μL ∙ L−1,并列出现在 19:00 和 20:00。2 m 处空气中 CO2浓度最高值为 570 μL ∙ L−1,出现在06:00,最低值为 430 μL ∙ L−1,并列出现在 19:00 和20:00。地面之上 1 m处空气中CO2浓度最高,0.2 m处CO2浓度居中,2 m处CO2浓度最低。
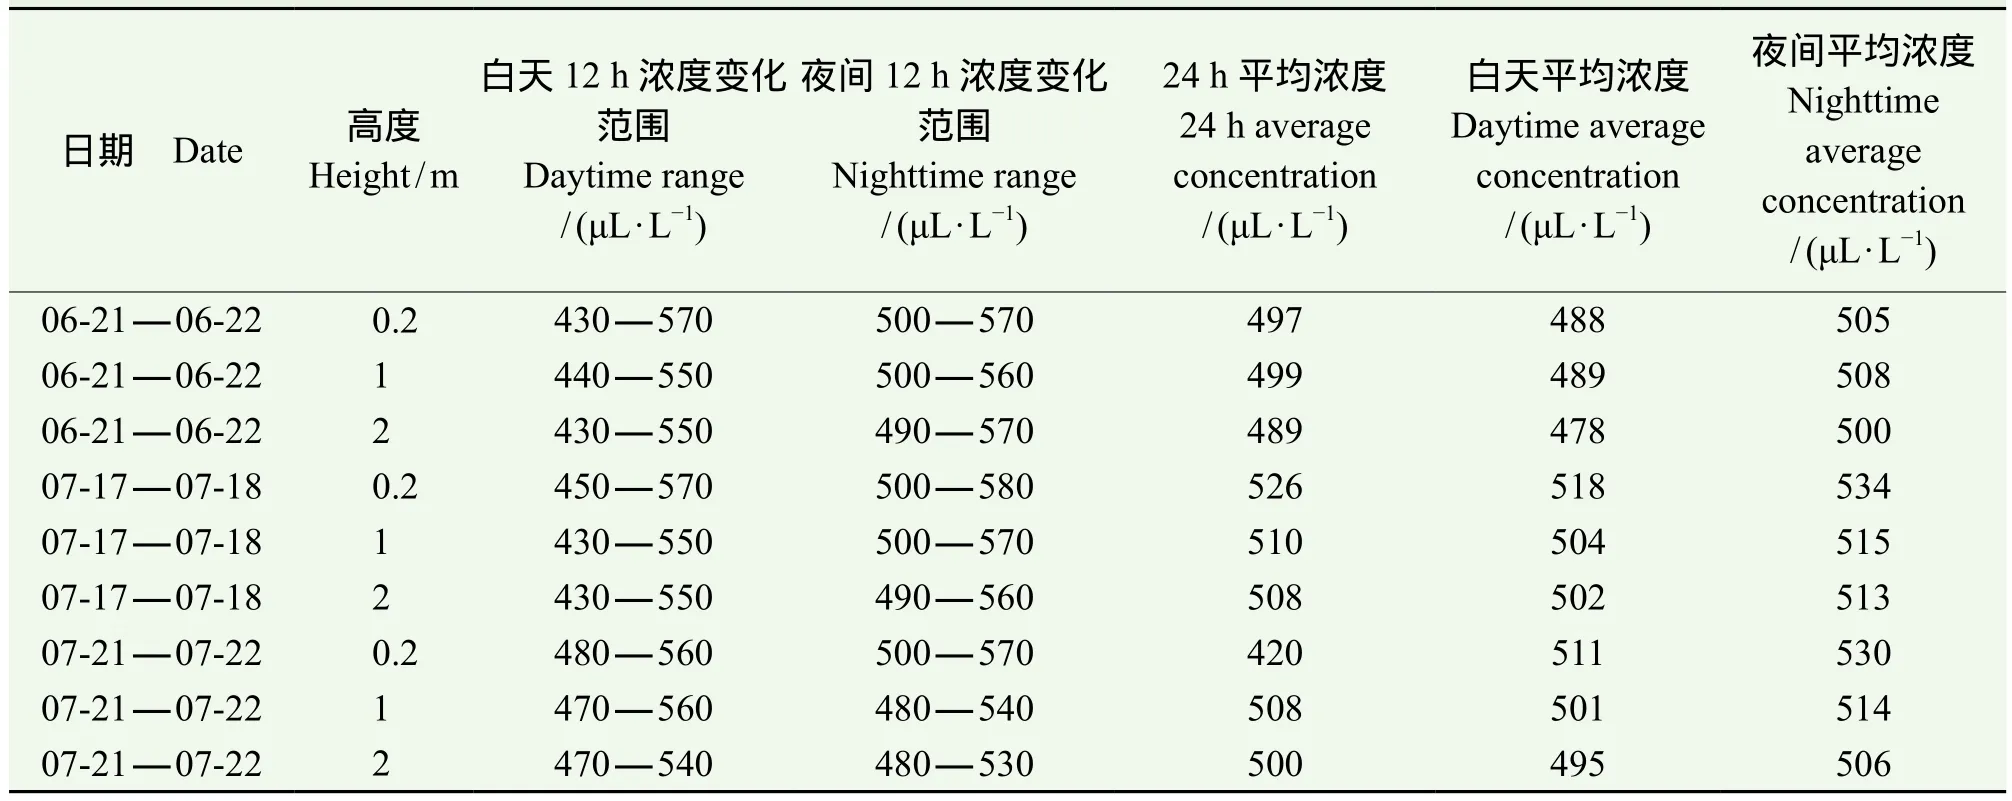
表2 B点不同高度下空气CO2的浓度变化Tab.2 Air CO2 concentration changes at different height in location B

图5 西安南郊B点空气中CO2浓度日变化Fig.5 CO2 concentration variation at location B in south suburb of Xi’an
由图5可知,7月17 — 18日地面之上0.2 m、1 m和2 m处CO2浓度昼夜变化范围分别是450 — 580 μL ∙ L−1、430 — 570 μL ∙ L−1、480 —560 μL ∙ L−1, 平 均 浓 度 分 别 为 526 μL ∙ L−1、510 μL ∙ L−1、508 μL ∙ L−1。地面之上 0.2 m 处空气中 CO2浓 度 最 高 值 为 580 μL ∙ L−1, 并 列 出 现 在06:00 和 07:00,CO2浓 度最低值为 450 μL ∙ L−1,出现在 17:00。1 m处空气中CO2浓度最高值为570 μL ∙ L−1, 出 现 在 06:00,CO2浓 度 最 低 值 为430 μL ∙ L−1, 出现在 19:00。2 m 处空气中 CO2浓度最高值为 560 μL ∙ L−1,出现在 07:00,CO2浓度最低值为 430 μL ∙ L−1,出现在 19:00。地面之上0.2 m处空气中CO2浓度最高,1 m处空气中CO2浓度居中,2 m处空气中CO2浓度最低。
由图5得知,7月21 — 22日地面之上0.2 m、1 m和2 m处CO2浓度昼夜变化范围分别是480 — 570 μL ∙ L−1、470 — 560 μL ∙ L−1、470 —540 μL ∙ L−1, 平 均 浓 度 分 别 为 420 μL ∙ L−1、508 μL ∙ L−1、500 μL ∙ L−1。地面之上 0.2 m 处空气中 CO2浓度最高值为 570 μL ∙ L−1,出现在 21:00,CO2浓度最低值为 480 μL ∙ L−1,出现在 16:00。1 m 处 空 气中 CO2浓度最高值为 560 μL ∙ L−1,出现在 11:00,CO2浓度最低值为 470 μL ∙ L−1,并列出现在16:00和18:00。2 m处空气中CO2浓 度 最 高 值为 540 μL ∙ L−1, 出现 在 11:00,CO2浓度最低值为 470 μL ∙ L−1,并列出现在 16:00 和18:00。地面之上 1 m处空气中CO2浓度最高,2 m处空气中CO2浓度居中,0.2 m处空气中CO2浓度最低。
2.2.3 C点CO2浓度在高度上的变化
根据C点地面以上0.2 m、1 m和2 m处进行3次昼夜观测结果(表3)做出了图6。由图6可知,6月21日 — 22日C点地面之上0.2 m、1 m、2 m处的CO2浓度昼夜变化范围分别是440 —560 μL ∙ L−1、430 — 540 μL ∙ L−1、430 — 540 μL ∙ L−1,平均浓度分别为 491 μL ∙ L−1、485 μL ∙ L−1、478 μL ∙ L−1。地面之上0.2 m处空气中CO2浓度最高值为560 μL ∙ L−1,出现在 07:00,最低值为 440 μL ∙ L−1,出现在19:00。地面之上1 m处空气中CO2浓度最高值为 630 μL ∙ L−1, 出现在 14:00,最低值为430 μL ∙ L−1,出现在 19:00。地面以上 2 m 处空气中 CO2浓度最高值为 540 μL ∙ L−1,出现在 07:00,最低值为 430 μL ∙ L−1,并列出现在 18:00、19:00、20:00。地面之上0.2 m处空气中CO2浓度最高,地面以上1 m处空气中CO2浓度居中,地面以上2 m处空气中CO2浓度最低。

表3 C点不同高度下空气CO2的浓度变化Tab.3 Air CO2 concentration changes at different height in location C

图6 西安南郊C地空气中CO2浓度日变化Fig.6 CO2 concentration variation at location C in south suburb of Xi’an
由图6可知,7月17日 — 18日C点地面之上0.2 m、1 m、2 m处的CO2浓度昼夜变化范围分别 是 450 — 560 μL ∙ L−1、440 — 550 μL ∙ L−1、430 —550 μL ∙ L−1, 平 均 浓 度 分 别 为 510 μL ∙ L−1、501 μL ∙ L−1、496 μL ∙ L−1。 地 面 以 上 0.2 m 处空 气 中 CO2浓 度 最 高 值 为 560 μL ∙ L−1, 出现 在 07:00, 最 低 值 为 450 μL ∙ L−1, 出 现 在17:00。地面以上1 m处空气中CO2浓度最高 值 为 550 μL ∙ L−1, 出 现 在 07:00, 最 低 值 为440 μL ∙ L−1,出现在 17:00。地面以上 2 m 处空气中 CO2浓度最高值为 550 μL ∙ L−1,出现在 07:00,最低值为 430 μL ∙ L−1,出现在 17:00。地面以上0.2 m处空气中CO2浓度最高,地面以上1 m处空气中CO2浓度居中,地面以上2 m处空气中CO2浓度最低。
图6表明,7月21 — 22日C点地面之上0.2 m、1 m、2 m处的CO2浓度昼夜变化范围分别是470 — 540 μL ∙ L−1、470 — 530 μL ∙ L−1、460 —520 μL ∙ L−1, 平 均 浓 度 分 别 为 504 μL ∙ L−1、496 μL ∙ L−1、493 μL ∙ L−1。地面以上 0.2 m 处空气中 CO2浓度最高值为 540 μL ∙ L−1,出现在 21:00,最低值为 470 μL ∙ L−1,并列出现在 15:00、16:00、20:00。地面以上1 m处空气中CO2浓度最高值为530 μL ∙ L−1,出现在 11:00,最低值为 470 μL ∙ L−1,出现在14:00。地面以上2 m处空气中CO2浓度最高值为 520 μL ∙ L−1,出现在 07:00,最低值为460 μL ∙ L−1,出现在 14:00。地面以上 0.2 m 处空气中CO2浓度最高,地面以上1 m处空气中CO2浓度居中,地面以上2 m处空气中CO2浓度最低。
3 讨论
3.1 空气CO2浓度昼夜变化规律及其原因
3次昼夜观测实验结果表明,在08:00 — 12:00的第一阶段,空气中CO2浓度较高,其原因是土壤释放和人类活动等产生的CO2在近地层大气中积累,加之这一阶段空气对流作用弱,CO2聚集不易扩散,造成CO2浓度较高。在13:00 — 21:00的第二阶段,空气中CO2浓度最低,其原因一是这一阶段空气湍流作用强,一部分CO2通过对流扩散到大气高层,使得CO2浓度减小(赵景波等,2001);二是这一阶段植物光合作用较强,吸收了空气中的CO2。在22:00到次日04:00的第三阶段,空气中CO2浓度较低,其原因应是这一阶段人类的生产与生活活动减弱,产生的CO2很少,导致CO2浓度较低。在05:00 — 07:00的第四阶段,空气中CO2浓度最高,其原因应是空气处于下沉阶段,土壤释放的CO2不断积累,造成CO2浓度最高。
3.2 温度对空气CO2浓度的影响
由图1、图2和图3可以看出,土壤CO2释放量与气温之间表现为一种负相关的关系,所有的观测结果除了个别观测值在某些阶段有一些差异外,都有这样的显示。但是空气CO2浓度的最高值和气温的最低值以及空气CO2浓度的最低值和气温的最高值并不是一一对应的,且昼夜CO2浓度与温度变化在时间上不完全相同,这是空气CO2浓度相对于大气温度变化的滞后性造成的。根据图1、图2、图3得知,CO2浓度的变化滞后于气温约3 — 4 h。据前人研究得知,在一昼夜内CO2空气中CO2浓度变化滞后于气温变化约4 — 6 h(郝玉芬和童心刚,2008)。气温升高一是引起光合作用增强,会吸收空气中更多的CO2,造成CO2浓度降低;二是温度升高导致空气垂向对流作用加强,使得地面空气中的CO2浓度降低(叶尔江∙拜克吐尔汉等,2015)。
3.3 空气CO2浓度在高度上的变化原因
对图4、图5、图6和表1、表2、表3分析可知,A、B、C三点CO2浓度普遍随高度的增高而降低,0.2 m高度处CO2浓度最高,2 m高度处CO2浓度最低,这是因为0.2 m处更接近土壤,土壤的释放的CO2使得0.2 m处的CO2浓度增大。由于CO2的分子量为44,空气的分子量约为29,导致CO2易聚集在空气下部,所以空气CO2浓度随着高度的增高而降低。
3.4 湿度和风速对空气CO2浓度的影响及其原因
空气湿度的变化,会对空气中CO2的浓度产生影响(陈颖,2012)。如夜晚空气湿度较大时,空气对流扩散作用弱,导致空气中CO2沉降积累,CO2浓度升高;而白天空气湿度较小时,空气对流作用强,空气中CO2通过对流扩散使得CO2浓度降低。因此,空气湿度与CO2浓度含量呈正相关。
观测结果显示,风速对CO2浓度影响甚微,CO2的浓度并没有因为风速变小而变大。这可能与测量的季节有关。西安地区夏天少风并且风速较小,因此,风速并不是CO2浓度变化的主要影响因素。
4 结论
综上所述,可以得出以下结论:
(1)西安南郊3个观测点的CO2浓度变化均呈现明显的日变化规律。CO2浓度昼夜变化可分为四个阶段。第一阶段在08:00 — 12:00,为CO2浓度较高阶段,浓度呈下降趋势。第二阶段在中午12:00 — 21:00,为CO2浓度最低阶段,浓度呈先下降后上升的变化特点。第三阶段在22:00到次日04:00,为CO2浓度较低阶段,浓度呈上升趋势。第四阶段在04:00 — 07:00,为CO2浓度最高阶段,呈先上升后下降的变化特点。
(2)白天CO2浓度低于夜间,原因一是白天植物的光合作用吸收了空气中的CO2,原因二是白天空气对流扩散作用强使得CO2浓度降低。
(3)空气CO2浓度与气温之间表现为负相关的关系,但昼夜CO2浓度与温度变化在时间上不完全相同,这是CO2释放量相对于大气温度变化的滞后性造成的,在一天中CO2释放量的变化滞后于气温约3 — 4 h。空气湿度大,CO2浓度高,原因是空气湿度大不利于空气对流扩散,利于CO2聚集。
(4)在2 m高度范围内,A、B、C三点空气CO2浓度普遍随高度增高而降低。
陈 颖. 2012. 西安南郊城区春季空气CO2浓度变化研究[D].西安: 陕西师范大学.[Chen Y. 2012. Research on CO2emission in Spring in the south suburb of Xi’an [D]. Xi’an:Shaanxi Normal University.]
高 峰, 孙成权, 曲建升. 2001. 全球气候变化研究的新认识 — IPCC第三次气候评价报告第一工作组报告概要 [J].地球科学进展, 16(3): 442 – 445. [Gao F, Sun C Q,Qu J S. 2001. New understanding of global climate change research: IPCC the third climate assessment report of working group I report overview [J].Advance in Earth Sciences, 16(3):442 – 445.]
郝玉芬, 童心刚. 2008. 西安南郊夏秋季不同土壤碳排放量的变化研究[J].干旱区资源与环境, 22(3):160 – 164. [Hao Y F, Tong X G. 2008. Change of CO2release from soils in Summer and Autumn in southern suburb of Xi’an [J].Journal of Arid Land Resources and Environment, 22(3): 160 – 164.]
贺玉龙, 戴本林. 2010. 大气中CO2的源与汇及其含量增加对环境的影响[J].工业安全与环保, 36(5): 25 – 27. [He Y L,Dai Y L. 2010. The effects of the source and sink of atmospheric CO2and the increase of it in the air on the environment [J].Industrial Safety and Environmental Protection, 36(5): 25 – 27.]
李艳花, 赵景波. 2006. 西安南郊不同深度土壤CO2浓度变化研究[J].干旱区资源与环境, 20(2): 124 – 128. [Li Y H,Zhao J B. 2006. Research on CO2density changes in different depth of the soil in the south suburb of Xi’an [J].Journal of Arid Land Resources and Environment, 20(2): 124 – 128.]
李银鹏, 季劲钧. 2001. 全球陆地生态系统与大气之间碳交换的模拟研究[J].地理学报, 56(4): 379 – 389. [Li Y P, Ji J J. 2001. Simulations of carbon exchange between global terrestrial ecosystem and the atmosphere [J].ActaGeographica Sinica, 56(4): 379 – 389.]
刘晓曼, 程雪玲, 胡 非. 2015. 北京城区二氧化碳浓度和通量的梯度变化特征—I浓度与虚温[J].地球物理学报,58(5): 1502 – 1512. [Liu X M, Cheng X L, Hu F. 2015. Gradient characteristics of CO2concentration and fl ux in Beijing urban area partⅠ: Concentration and virtual temperature [J].Chinese Journal of Geophysics, 58(5): 1502 – 1512. ]
陕西师范大学地理系. 1988. 西安市地志[M]. 西安: 陕西人民 出 版 社 : 88 – 95: 102 – 105. [Shaanxi Normal University.Geography Department. 1988. Xi’an Geography [M]. Xi’an:Shaanxi People’s Publishing House: 88 – 95: 102 – 105. ]
童心刚, 赵景波. 2003.西安南郊和蓝田夏季土壤CO2排放量和释放规律研究[J].陕西师范大学学报(自然科学版), 29(2): 83 – 85. [Tong X G, Zhao J B. 2003. Change law of release amount of CO2from soils in summer in southern suburb of Xi’an and Lantian [J].Journal of Shaanxi Normal University (Natural Science Edition), 29(2): 83 – 85.]
叶尔江∙拜克吐尔汉, 康 剑, 王雅佩, 等. 2015. 校园二氧化碳浓度时空动态特征[J].环境科学导刊, 34(4): 42 – 46.[Baiketuerhan Y, Kang J, Wang Y P, et al. 2015. Temporal and spatial dynamic characteristics of CO2concentration on Xinjiang Agricultural University campus [J].Environmental Science Survey, 34(4): 42 – 46.]
赵景波, 袁道先, 杜 娟, 等. 2001. 西安东南部7月份土壤CO2释放量和释放规律研究[J].陕西师范大学学报(自然科学版), 29(2): 81 – 86. [Zhao J B, Yuan D X, Du J, et al. 2001. Release amount and its change law of CO2from soils on July in Xi’an area [J].Journal of Shaanxi Normal University (Natural Science Edition), 29(2):81 – 86.]
Anderson D W. 1995. Decomposition of organic matter and carbon emission from soils [M]// Lal R, Kimble J, Levine E, et al. Advances in soil science: Soils and global change.Boca Raton: CRC Press: 165 – 176.
Bouwman A F. 1990. Exchange of greenhouse gases between terrestrial ecosystem and atmosphere [M]// Bouwman A F.Soil and the greenhouse effect. Chichester: Wiley: 61–127.
Topp E, Pattey E. 1997. Soils as sources and sinks for atmosphere methane [J].Canadian Journal of Soil Science, 7: 167 – 178.
World Meteorological Organization. 2015. WMO greenhouse gas bulletin (GHG Bulletin)-No. 11: the state of greenhouse gases in the atmosphere based on global observations through 2014 [R/OL]. https://library.wmo.int/pmb_ged/ghgbulletin_11_en.
Research on temporal and spatial variation of carbon dioxide concentration of summer air in southern suburbs of Xi’an
CHENG Jie1, SONG Yi1, LI Li1, ZHOU Dianfang1, ZHAO Jingbo1,2
1. College of Tourism and Environment, Shaanxi Normal University, Xi’an 710119, China
2. State Key Laboratory of Loess and Quaternary Geology, Institute of Earth Environment, Chinese Academy of Sciences, Xi’an 710061, China
Background, aim, and scopeWhether the diurnal change and height change of urban air CO2have natural change rules is a scientific problem deserved to be found out. About the insufficient change research on CO2concentration of urban air in Xi’an, specifically there is little research on the diurnal change rule of CO2concentration within 2 m height. Aiming at the def i ciency, this paper develops the diurnal observation and research on CO2concentration within 2 m height. The research purpose of the paper is to reveal the diurnal change of CO2concentration of summer air in southern suburbs of Xi’an and the change within 2 m height;and scientif i c basis is provided to relieve the adverse effect of CO2.Materials and methodsIn order to make the research result have representativeness, the paper has selected three observation points in Yanta campus of Shaanxi Normal University in southern suburbs of Xi’an; and the three observation points are subjected to three times of diurnal observation from June 21 to June 22, from July 17 to July 18 and from July 21 to July 22 with clear weather. The observation point A is located in Peonies Garden majoring in peonies in the campus; the observation point B is located below the cedar forest; and the observation point C is located below the persimmon forest. The CO2concentration of the air at 0.2 m, 1 m and 2 m height above the ground of the observation points is subjected to diurnal observation by infrared CO2monitor; it is determined every one hour; and meanwhile, the air temperature, wind speed and humidity at 0.2 m, 1 m and 2 m height above the ground of the observation points are measured.ResultsThe three times of diurnal observation results of three diurnal observation points show that the CO2concentration change in southern suburbs of Xi’an is divided into four stages. The fi rst stage from July 21 to July 22 is from 08:00 to 12:00; the change range of CO2concentration is 480 — 510 μL ∙ L−1; the average concentration is 492 μL ∙ L−1; and it is the stage with higher CO2concentration. The second stage is from 13:00 to 21:00; the change range of the CO2concentration is 420 — 490 μL ∙ L−1; the average concentration is 466 μL ∙ L−1;and it is the stage with minimum CO2concentration. The third stage is 22:00 — 04:00 of the next day; the change range of the CO2concentration is 470 — 510 μL ∙ L−1; the average concentration is 488 μL ∙ L−1; and it is the stage with lower CO2concentration. The fourth stage is 05:00 to 07:00; the change range of CO2concentration is 520 — 570 μL ∙ L−1; the average concentration is 539 μL ∙ L−1; and it is the stage with maximum CO2concentration. The diurnal change range of CO2concentration at 0.2 m, 1 m and 2 m above the ground of A observation point from June 21 to June 22 is 420 — 550 μL ∙ L−1, 420 — 590 μL ∙ L−1and 430 — 540 μL ∙ L−1; the average concentration is 492 μL ∙ L−1, 484 μL ∙ L−1and 475 μL ∙ L−1. Along the increased height, CO2concentration is reduced. CO2change of other observation points within 2 m height is similar with the above conditions.DiscussionThree times of diurnal observation results show that in the fi rst stage from 08:00 to 12:00, the main reason of higher CO2concentration in air is caused by the CO2released by soil and accumulated CO2generated by human activities in surface layer atmosphere; and it is decided by weak air convection and slow CO2diffusion in this stage. In the second stage from 13:00 to 21:00, the reason of minimum CO2concentration in air is caused by strong air turbulence effect in this stage; CO2is reduced by convective diffusion concentration and the stronger plant photosynthesis in this stage can absorb SO2in the air. In the third stage from 22:00 to 04:00, the reason of lower CO2concentration in the air is caused by industrial production and weak production activities in this stage;and it generates little CO2. In the fourth stage from 05:00 to 07:00, the reason of maximum CO2concentration in the air is that the air is in sinking stage; the CO2relieved by soil is continuously accumulated so as to result in maximum CO2concentration. The air temperature in south suburbs of Xi’an is in negative correlation with CO2concentration; and it is caused by the increased photosynthesis of raised air temperature and air vertical convection diffusion. CO2concentration within 2 m height is reduced along the increased height; and reason is that the lower part is close to the CO2release source from the soil. CO2concentration at night is higher than that in daylight, because the air humidity at night is greater than that in daylight; the weak air convection diffusion results in accumulated CO2settlement in the air and CO2concentration rises. Air humidity is in positive correlation with CO2concentration content.ConclusionsThe diurnal change of CO2concentration of three observation points in southern suburbs of Xi’an is divided into four stages. CO2concentration change is in higher, minimum, lower and maximum change; and it ref l ects that low-level CO2concentration diurnal change rule in city is controlled by the natural factors. Air CO2concentration of A, B, C observation points is reduced along the increased height within 2 m height range; and it ref l ects that the change of low-level CO2concentration in city is mainly controlled by natural factors. CO2concentration in daylight is lower than that in night; and it is caused by the diffused CO2in the air of CO2absorbed by photosynthesis in the air and strong convection in daylight. CO2concentration change in the air is in negative correlation with the air temperature; and it is caused by the increased air temperature,strong photosynthesis and high of air convection diffusion. The air humidity is in positive correlation with CO2concentration; and the great air humidity is not benef i cial to the convection diffusion.Recommendations and perspectivesThis paper develops the research on diurnal change of three plants and CO2concentration within 2 m height range; and it needs to develop the observation research on more plants and greater height; the density of the height observation point must be increased on the height so as to obtain the ration relation between the height and CO2concentration. In addition, the diurnal change of CO2concentration in clear weather and height change of CO2concentration has been researched in this paper; the CO2concentration in cloudy days and haze days is different from the cloud day, so it needs to observe CO2concentration change in cloudy days and haze days.
Date: 2017-07-15; Accepted Date: 2017-09-24
National Undergraduate Training Programs for Innovation and Entrepreneurship of Shaanxi Normal University(201510718028); State Key Laboratory of Loess and Quaternary Geology (SKLLQG1428)
ZHAO Jingbo, E-mail: zhaojb@snnu.edu.cn
the south suburb of Xi’an; CO2concentration; the diurnal variations; inf l uencing factors; artif i cial vegetation
2017-07-15;录用日期:2017-09-24
陕西师范大学大学生创新创业训练计划项目(201510718028);黄土与第四纪地质国家重点实验室项目(SKLLQG1428)
赵景波,E-mail: zhaojb@snnu.edu.cn
成 洁, 宋 怡, 李 黎, 等. 2017. 西安南郊夏季空气二氧化碳浓度时空变化研究[J].地球环境学报, 8(5): 469 – 478.
: Cheng J, Song Y, Li L, et al. 2017. Research on temporal and spatial variation of carbon dioxide concentration of summer air in southern suburbs of Xi’an [J].Journal of Earth Environment, 8(5): 469 – 478.
猜你喜欢
音乐天地(音乐创作版)(2022年1期)2022-04-26
音乐天地(音乐创作版)(2022年1期)2022-04-26
智能城市(2021年3期)2021-04-12
债券(2019年1期)2019-09-05
绿色科技(2019年12期)2019-07-15
当代陕西(2019年6期)2019-04-17
现代青年·精英版(2016年10期)2017-04-04
中国骨科临床与基础研究杂志(2017年5期)2017-01-12
水利科技与经济(2016年10期)2016-04-26
山东建筑大学学报(2015年4期)2015-05-11
