
西安供暖前后细颗粒物化学特征及棕碳吸光特性
2017-11-15 06:39王格慧王佳媛李建军
地球环境学报 2017年5期
张 璐,王格慧,王佳媛,吴 灿,曹 聪,李建军
1.中国科学院地球环境研究所 黄土与第四纪地质国家重点实验室,西安 710061
2.中国科学院大学,北京 100049
西安供暖前后细颗粒物化学特征及棕碳吸光特性
张 璐1,2,王格慧1,2,王佳媛1,2,吴 灿1,2,曹 聪1,2,李建军1
1.中国科学院地球环境研究所 黄土与第四纪地质国家重点实验室,西安 710061
2.中国科学院大学,北京 100049
2015年11月1 — 30日在西安用大流量采样器每12 h进行1次细颗粒物(PM2.5)样品采集,分析供暖前后PM2.5中有机碳(OC),元素碳(EC),水溶性有机碳(WSOC)与无机离子的浓度和棕碳吸光度的变化特征,探讨供暖对城市大气气溶胶理化特性的影响。结果显示:供暖前(11月1 — 15日)与供暖后(11 月 16 — 30 日)PM2.5浓度分别为 127 ± 59 μg ∙ m−3和 164 ± 126 μg ∙ m−3,供暖后比供暖前增加了 30%,其中 K+、Cl−、和分别增加了 30%、70%、40% 和 38%。洁净期(PM2.5< 75 μg ∙ m−3)与灰霾期(PM2.5>150 μg ∙ m−3)对比显示:洁净期Na+、Ca2+、Mg2+的相对含量均大于灰霾期,这是由于灰霾发生时不利的静稳天气条件(风速<1 m ∙ s−1)使得粉尘粒子干沉降效应增加所致。洁净期[]/[]质量比均大于1而灰霾期均小于1,这是因为灰霾期高湿条件有利于二氧化硫液相转化为硫酸盐所致。供暖前灰霾期[]/[]比值要高于供暖后的灰霾期,这与西安及其周边地区燃煤取暖排放二氧化硫增加有关。供暖前后棕碳的质量吸收效率(MAE)值均是洁净期大于灰霾期,表明:与非灰霾天相比,当灰霾发生时不利的静稳天气条件使得细粒子在大气中长时间存留,延长其二次氧化反应时间,使得棕碳中含C = C不饱和键的吸光性物质被深度氧化,从而降低其吸光性能。
棕碳;化学组成;光学特征;来源;形成机制
大气气溶胶通过吸收和散射太阳光而影响全球气候。其中,黑碳组分(black carbon,BC)能高效吸光,而有机碳组分(organic carbon,OC)通常认为仅能散射光(Bond et al,2011,2013)。但是,最近研究表明,在强吸光BC和不吸光OC之间还有一类兼有散光和吸光能力(Laskin et al,2015)、大多显棕黄色或棕褐色的OC,其在300—400 nm的近紫外和可见光区域内有明显吸光特性(Chung et al,2012),这类吸光性有机碳被称为棕碳(brown carbon,BrC)。
大气中棕碳既可来自于污染源的直接排放,也可通过大气光化学氧化形成。Andreae and Gelencsér(2006)研究表明棕碳可能来源于生物质燃烧;Liu et al(2013)通过夏天高速路边采样分析发现:机动车可直接排放棕碳,并通过对流层不同高度气溶胶研究发现:大气棕碳可能来自于二次光化学反应;Hecobian et al(2010)通过水溶性有机碳(water-soluble organic carbon,WSOC)吸光特征的时间变化研究发现:非吸光性的新鲜二次有机气溶胶(secondary organic aerosol,SOA)可迅速转化为各种发色团物质(Laskin et al,2014;Powelson et al,2014;Lin et al,2015)。通常认为棕碳主要包括硝基酚(Zhang et al,2013)、HULIS(Utry et al,2013)、溶于水或有机溶剂的颗粒物、生物质燃烧产生的一次气溶胶(Washenfelder et al,2015)以及非晶体含碳化合物等。但由于棕碳化学组成极其复杂,目前难以在分子水平对其进行完全定量分析,导致对其来源和形成机制认识还不清楚。
我国冬季灰霾频发,采暖所导致的生物质和煤燃烧排放增加是冬季大气PM2.5严重污染的重要原因(Zheng et al,2014;Yan et al,2015)。本研究以北方典型城市西安大气为对象,分析供暖前后PM2.5化学组成及其棕碳光学特性的异同,探讨其来源,以期加深理解我国冬季灰霾成因。
1 采样及分析
1.1 样品采集与处理
采样点位于西安市环境监测站6楼顶(34.4°N,108.9°E),距地面约20 m,时间为2015年11月1 — 30日(供暖前后各15天),每次采样12 h(08:00 am — 08:00 pm),共采集PM2.5样品58个,其中供暖前31个,供暖期间27个。采样器为Andersen GT22001,流量为 1.13 m3∙ min−1。采样前将A4石英纤维滤膜(Whatman QM/A)于450℃灼烧6 h以去除其中的有机物等杂质,所得样品放于干燥罐中干燥24 h后置于−18℃冰柜中待分析。
1.2 化学组分及吸光度测量
样品的OC、EC用DRI 2001热光法碳分析仪IMPROVE A的方法,详情见Shen et al(2014);WSOC和无机离子分别用TOC-L CPH CN200有机碳分析仪和Dionex-600型离子色谱分析,其中可测得的无机离子包括 F−、Cl−、、Br−、、、七种阴离子及Na+、、K+、Mg2+、Ca2+五种阳离子。样品处理过程为:剪取1/8直径为80 mm的滤膜样品置于离心管中,加入50 mL超纯水(>18 MΩ),超声萃取三次,每次15 min,随后在脱色摇床上振荡1 h并静置,取上层清液,用0.45 μm水系滤头过滤,得滤液50 mL,其中30 mL用于分析WSOC,20 mL用于分析无机离子。
棕碳BrC(即WSOC)吸光度用翱艺仪器生产的UV-6100S型双光束紫外可见分光光度计测量(波长范围:190 — 900 nm),测量光程为0.01 m,水提取样品处理过程同上。
1.3 光学特性测定
分光光度计测量吸光度遵循兰博-比尔定律,见公式(1)(黄欢等,2016)。其中I和I0分别为某一波长下的透射光和入射光光强,吸光度Aλ与溶液中吸光性物质的浓度C(μg ∙ mL−1),质量吸 收 效 率ε(MAE,mass absorption ef fi ciency,m2∙ g−1)及吸收光程l(0.01 m)呈线性相关。此研究中用WSOC作为吸光性棕碳的替代物,因此C为WSOC的浓度。

吸收系数Bap(M ∙ m−1)是用来表征大气浓度下吸光特性的参数,计算如公式(2)所示(闫才青等,2014)。其中Vl为滤液体积,Va为所用滤膜的采样体积。为避免液相提取时非棕碳类物质的吸光性干扰,并与前人研究一致,本文选取λ= 365 nm作为棕碳的代表吸收波长,λ= 700 nm处的光吸收作为分析时的基线飘移进行扣除,从负对数形式转化为自然对数(ln10)是为了与通常所采用的大气尺度保持一致。

AAE(absorption Ångstrǒ m exponent)为吸收波长指数,是用来表征棕碳吸光特性与波长关系的指数,计算见公式(3)(Cheng et al,2016)。其中K为常数,与颗粒物的质量浓度有关,而AAE则与颗粒物组成相关。通过测定不同波长对应的Absλ,利用对数函数线性拟合即可求出对应AAE值,本研究选取了300 — 450 nm内7个波长,分别为300 nm、330 nm、365 nm、380 nm、400 nm、420 nm和450 nm(黄欢等,2016)。

2 结果与讨论
2.1 PM2.5化学特征
2.1.1 采样期间PM2.5质量浓度及气象参数变化
本研究将PM2.5浓度低于国家二级标准日均75 μg ∙ m−3的时段定义为洁净期(clean period),PM2.5浓度大于国家二级标准日均 75 μg ∙ m−3两倍的时段定义为灰霾期(haze period),其余为污染过渡期,这里只对比分析洁净期与灰霾期PM2.5化学组成和棕碳光学特征的异同。由图1可以看出,11月15日开始供暖,在此前后分别有一个洁净期(clean)和灰霾期(haze)。供暖前温度平均为10℃左右,11月15日供暖后温度逐步降低(图1a),尤其是供暖后的灰霾期(HazeⅡ),温度均在零下,相对湿度由70%增加至94%(图1b),能见度迅速下降至1 km以下(图1c),而PM2.5浓度由 11 月 26 日 69 μg ∙ m−3增加至 11 月 29日 405 μg ∙ m−3(图 1d)。一方面是由于供暖导致排放增加,另一方面静稳天气下低温高湿的气象条件有利于硫酸盐和硝酸盐等二次粒子的生成与累积,同时高浓度PM2.5导致能见度迅速降低。
2.1.2 供暖前后PM2.5化学组成变化
供暖前(11月1 — 15日)与供暖后(11月16 — 30日)西安PM2.5质量浓度及化学组分如表1所示。供暖前和供暖后PM2.5日均浓度为127 ±59 μg ∙ m−3(39 — 261 μg ∙ m−3)、164±126 μg ∙ m−3(51 — 511 μg ∙ m−3),分别是国家空气质量二级标准(GB 3095 — 2012,75 μg ∙ m−3)的1.7倍和2.2倍,供暖期间PM2.5质量浓度比供暖前增加了30%,表明燃煤取暖排放增加是空气质量降低的重要原因(Zíková et al,2016)。此外,供暖后的静稳天气以及高湿度也有利于污染物累积和二次转化,可导致PM2.5浓度进一步增加。总碳(total carbon,TC,是有机碳(OC)与元素碳(EC)之和)分别占供暖前和供暖后PM2.5质量浓度的21% ± 10%和24% ± 10%,供暖后OC/EC比值为2.4,较供暖前增加了16%,表明西安及周边冬季燃煤和生物质燃烧采暖排放较多有机物(Yang et al,2010)。
供暖前无机离子质量浓度为 67 ± 32 μg ∙ m−3,供暖后为 84 ± 66 μg ∙ m−3,增加了 25%;与供暖前相比,供暖后西安PM2.5中K+和Cl−浓度分别增加了30%和70%,表明周边农村生物质燃烧采暖对城市PM2.5有较大贡献(韩艳妮和王格慧,2016)。此外,采暖带来的燃煤排放增加也可导致K+和Cl−浓度上升。与供暖前相比,供暖后浓度基本不变,但和浓度分别增加了40%和38%,这主要与燃煤采暖导致的二氧化硫排放增强所致。
2.1.3 供暖前后的洁净期与灰霾期PM2.5化学组成对比
图2为11月15日供暖前后不同污染状况下(洁净期与灰霾期)PM2.5中无机离子质量百分比。从中可以看出,供暖前洁净期CleanⅠ阴离子质量浓度之和占总离子的64%,而灰霾期HazeⅠ占总离子质量浓度的73%。其中,洁净期CleanⅠ的质量浓度百分比相对灰霾期Haze I降低了22%,质量浓度百分比相对灰霾期HazeⅠ增加了12%。洁净期Clean Ⅰ由于风速较大,Na+、Ca2+、Mg2+占总离子质量浓度的12%,而灰霾期HazeⅠ由于静风逆温等气象因素使得污染物不易扩散,粉尘粒子干沉降效应增加(Zhang et al,2009),因此Na+、Ca2+、Mg2+之和仅占7%。采暖开始后的灰霾期HazeⅡ与洁净期CleanⅡ无机离子质量百分比变化与采暖之前的灰霾期HazeⅠ与洁净期CleanⅠ呈现出类似的变化特征。
供暖前后的两个洁净期相比,供暖后的洁净期Na+、Ca2+、Mg2+浓度之和的相对百分比增加了4%,其他离子没有太大变化,但供暖前后的两个灰霾期呈现出较明显差异。其中供暖后的灰霾期相对含量降低了9%,而和的相对含量则分别增加了7%和3%。这一方面是缘于供暖燃煤导致二氧化硫较供暖前排放增加,另一方面也是缘于供暖后的灰霾期低温高湿的气象条件有利于硫酸盐液相形成(Wang et al,2016)。洁净期和灰霾期的阳、阴离子当量比值供暖之前为1.44 ± 0.22和1.01 ± 0.07,供暖后则分别 1.65 ± 0.37 和 1.17 ± 0.30,这种灰霾期阴离子相较阳离子有所增加的现象进一步表明灰霾期间的高湿天气有利于二次酸性粒子的形成。与(+ 2 ×)的当量浓度比值,在洁净期与灰霾期分别为1.0 ± 0.1和0.8 ± 0.2,表明铵离子在洁净期以NH4NO3和(NH4)2SO4两种形式存在,而在灰霾期则是以NH4NO3、(NH4)2SO4和NH4HSO4三种形式存在,这是由于灰霾期高湿天气更加有利于二氧化硫液相氧化,形成更多酸性气溶胶硫酸盐所致(Wang et al,2016)。

图1 采样期间PM2.5质量浓度及气象参数变化Fig.1 PM2.5 concentrations and meteorological parameters during the sampling period
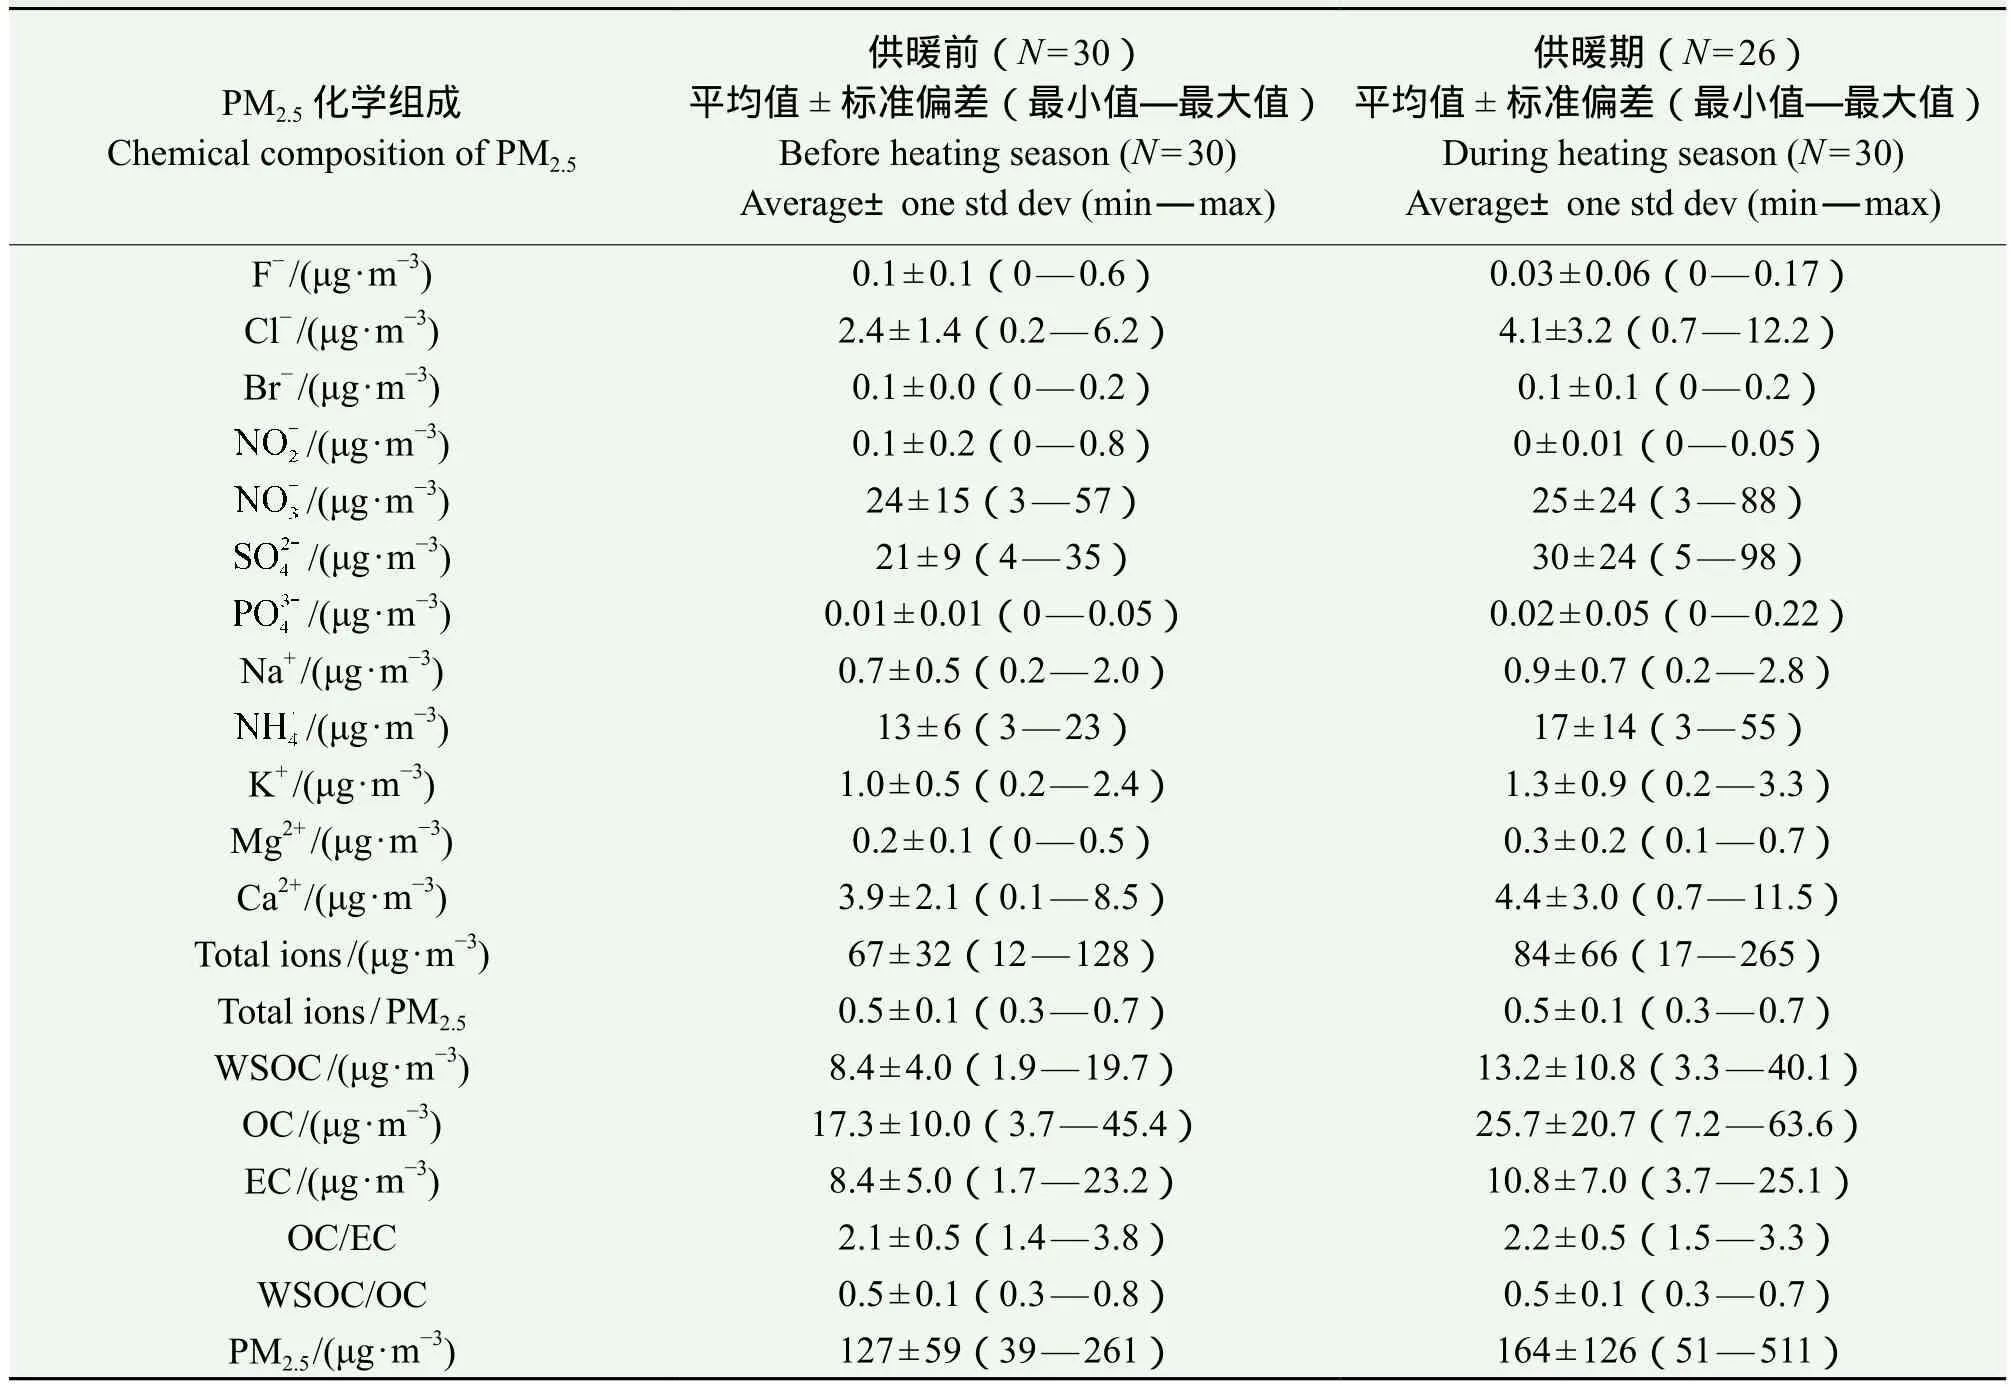
表1 供暖前后西安PM2.5质量浓度及化学组成Tab.1 Concentrations of particle mass and major components of PM2.5 before and during heating season in Xi’an
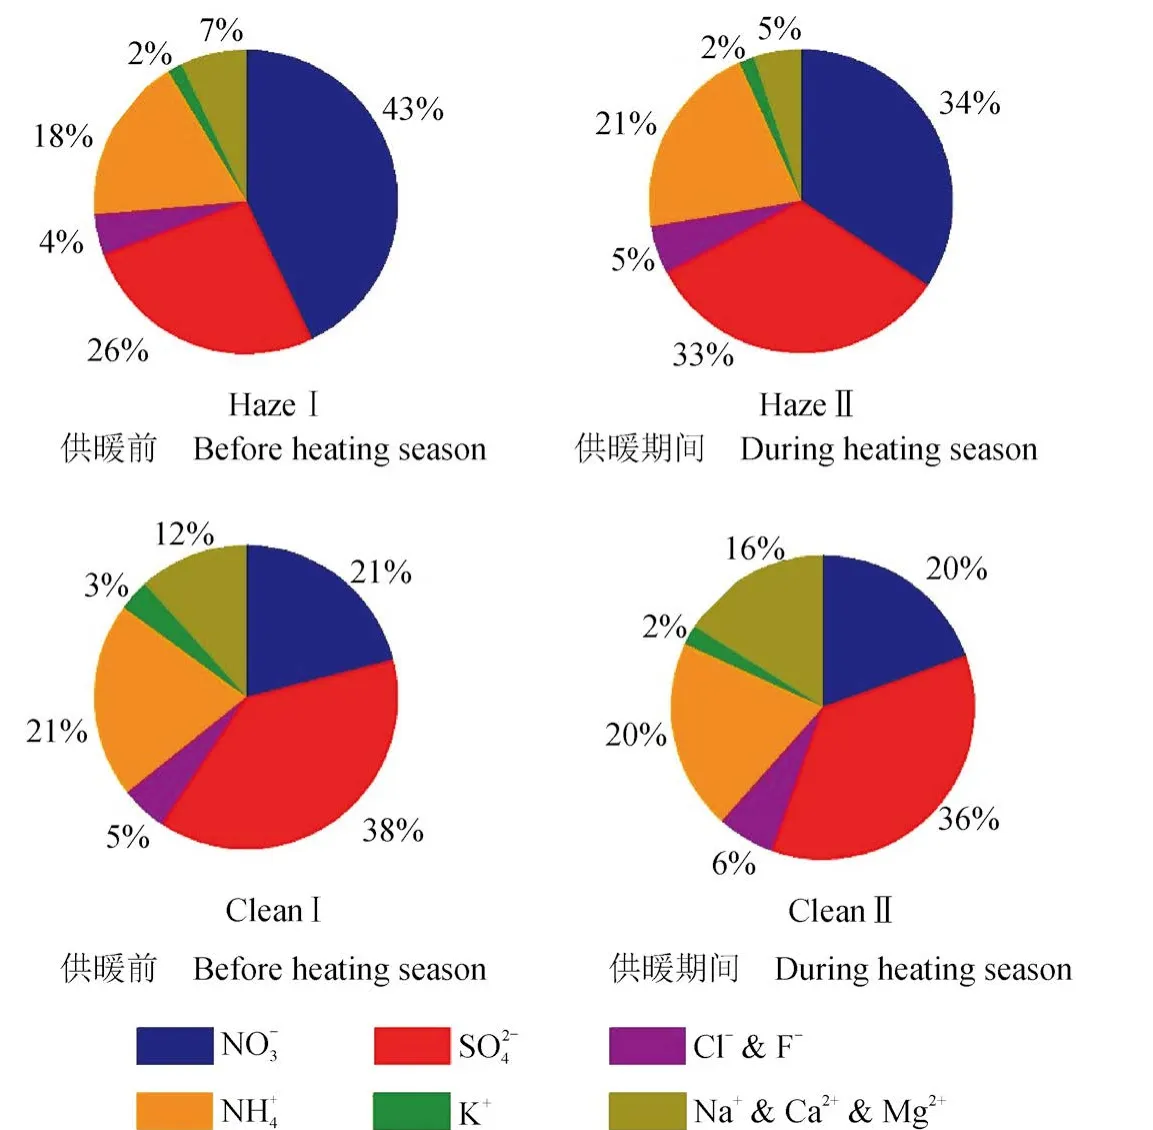
图2 供暖前后洁净期与灰霾期西安PM2.5中无机离子相对组成比较Fig.2 Mass percentages of inorganic ions of PM2.5 on clean and haze days before and during heating season
2.2 棕碳光学特性
2.2.1 供暖前后对比
由于棕碳的物质组成极其复杂,目前难以在分子水平对其进行完全定量分析,通常利用水萃取物或甲醇萃取物来研究棕碳的理化特征(Zhang et al,2011;Kirillova et al,2014;Liu et al,2014)。本研究以水萃取物WSOC作为棕碳组分,分析其光学特征,采样期间棕碳的光学参数变化如图3所示。

图3 西安供暖前后PM2.5中棕碳光学特征Fig.3 Optical properties of brown carbon in PM2.5 from Xi’an before and during heating seasons
供暖前洁净期Clean Ⅰ和灰霾HazeⅠ棕碳吸光系数分别为 8.1 ± 2.1 M ∙m−1和 21.5 ± 5.0 M ∙m−1,供暖后洁净期CleanⅡ和灰霾期HazeⅡ分别为9.4 ± 4.4 M ∙m−1和 37.8 ± 10.7 M ∙m−1( 图 3a), 表明:棕碳的吸光效应灰霾期大于洁净期,供暖后大于供暖前,特别是供暖后的灰霾天(Haze Ⅱ)棕碳吸光效应增加尤为显著,较供暖前灰霾天增加76%。这主要是与供暖后WSOC浓度增加有关。相较于供暖前,供暖后WSOC增加57%,由供暖前 8.4 ± 4.0 μg ∙ m−3增加到供暖后 13.2 ± 10.8 μg ∙ m−3(表1)。
供暖前灰霾期HazeⅠ和洁净期CleanⅠ的MAE 分 别 为 1.6 ± 0.3 m2∙g−1和 2.5 ± 0.8 m2∙g−1,洁净天是灰霾天的1.6倍,而供暖后Haze Ⅱ和Clean Ⅱ的 MAE 则分别为 1.3 ± 0.2 m2∙g−1和 1.7 ±0.4 m2∙g−1,洁净天是灰霾天的 1.3 倍(表 2 和图3b)。由此可见:尽管棕碳总浓度增加导致其吸光度供暖后较供暖前增强,灰霾期较洁净期增强,但是单位质量棕碳吸光性能供暖后较供暖前减弱,灰霾期较洁净期减弱,表明:供暖后尤其是灰霾期棕碳中含不饱和C = C双键类吸光性物质相对含量减少,这可能是静稳天气下灰霾粒子在空气中停留时间长,有机气溶胶更为老化,使得含不饱和C = C双键类吸光性有机物进一步被氧化所致。这与Wang et al(2017)的研究相一致,该研究发现:2014年北京APEC前静稳天气有利于二次有机气溶胶形成,所生成草酸更为老化,使得其稳定碳同位素较APEC期间明显偏正。
AAE是用来表征吸光特性与波长及颗粒物本身特性之间关系的参数,它与气溶胶的粒径和组分密切相关。有研究表明,AAE越大,则颗粒物的光吸收性越弱。通常认为纯煤烟棕碳具有最强的光吸收性,并且不随波长变化,因此其AAE为1(Cheng et al,2011);生物质燃烧产生的棕碳的光吸收对波长依赖性较弱,其AAE约为1 — 2,而二次转化形成棕碳的光吸收特性与波长有较强的依赖性,其AAE约为4.7 — 7.0(Arola et al,2015)。本研究中供暖前灰霾期HazeⅠ及洁净期CleanⅠ的AAE分别为5.0 ± 0.4和4.3 ± 0.5,而供暖后则分别为 5.7 ± 0.3 和 5.1 ± 0.5,灰霾期均高于干净期(表2和图3c)。表明灰霾期棕碳对波长的依赖性更大,颗粒物的光吸收性越弱,这可能与大气光化学氧化过程的“漂白”效应有关。
2.2.2 与其他地区比较
表2为运用紫外-可见分光光度计测得的不同地区冬季大气棕碳光学参数。从中可以看出,采样期间西安冬季MAE平均为1.8 ±0.6 m2∙g−1,大于北京且远大于美国城市与乡村以及印度洋地区的棕碳MAE值。此外,AAE值西安为4.0 ± 0.5,小于上述所有地区,表明相较于其他地区西安冬季棕碳的吸光性能更强,对波长的依赖性更弱。

表2 世界不同地区冬季棕碳光学参数Tab.2 Optical parameters of wintertime brown carbon in different regions of the world
3 结论
本研究通过对西安冬季供暖前后洁净期与灰霾期PM2.5化学组成及棕碳吸光特性进行分析,得出以下主要结论:
(1)供暖前后PM2.5日平均浓度分别为127 ± 59 μg ∙ m−3及 164 ± 126 μg ∙ m−3,约为我国空气质量二级标准的1.7倍和2.2倍。相较于供暖前,供暖后K+和Cl−浓度分别增加了30%和70%,这主要是由于采暖带来的生物质与煤燃烧排放增加所致;
(3)西安供暖后的洁净天和灰霾天PM2.5中棕碳吸光度分别为 9.4 ± 4.4 M ∙m−1和 37.8 ± 10.7 M ∙m−1,相较于供暖前增加15%和80%,主要与供暖后棕碳浓度增加有关;
(4)西安供暖期棕碳的质量吸光效率MAE值小于供暖前,吸收波长指数AAE大于供暖前,表明供暖期棕碳中含C = C不饱和双键的吸光性物质相对含量较供暖前有所降低。
韩艳妮, 王格慧. 2016. 华北农村大气PM2.5中水溶性物质化学组成、吸湿性能及光学特征[J].地球环境学报,7(1): 44 – 54. [Han Y N, Wang G H. 2016. Composition,hygroscopicity and light absorption of water-soluble fraction of PM2.5at a rural site near Beijing [J].Journal of Earth Environment, 7(1): 44 – 54.]
黄 欢, 毕新慧, 彭 龙, 等. 2016. 广州城区秋冬季大气颗粒物中WSOC吸光性研究[J].环境科学, 37(1): 16 – 21.[Huang H, Bi X H, Peng L, et al. 2016. Light absorption properties of water-soluble organic carbon (WSOC) associated with particles in autumn and winter in the urban area of Guangzhou [J].Environmental Science, 37(1): 16 – 21.]
闫才青, 郑 玫, 张远航. 2014. 大气棕色碳的研究进展与 方 向 [J].环境科学, 35(11): 4404 – 4414. [Yan C Q, Zheng M, Zhang Y H. 2014. Research progress and direction of atmospheric brown carbon [J].Environmental Science, 35(11): 4404 – 4414.]
Andreae M O, Gelencsér A. 2006. Black carbon or brown carbon?The nature of light-absorbing carbonaceous aerosols [J].Atmospheric Chemistry and Physics, 6(24): 3131 – 3148.
Arola A, Schuster G L, Pitkänen M R A, et al. 2015. Direct radiative effect by brown carbon over the Indo-Gangetic Plain [J]. Atmospheric Chemistry and Physics, 15(22):12731 – 12740.
Bond T C, Doherty S J, Fahey D W, et al. 2013. Bounding the role of black carbon in the climate system: A scientific assessment [J].Journal of Geophysical Research: Atmospheres, 118(11): 5380 – 5552.
Bond T C, Zarzycki C, Flanner M G, et al. 2011. Quantifying immediate radiative forcing by black carbon and organic matter with the Specific Forcing Pulse [J].Atmospheric Chemistry and Physics, 11(4): 1505 – 1525.
Cheng Y, He K B, Zheng M, et al. 2011. Optical properties of elemental carbon and water-soluble organic carbon in Beijing, China [J].Atmospheric Chemistry and Physics Discussions, 11(2): 6221 – 6258.
Cheng Y, He K B, Du Z Y, et al. 2016. The characteristics of brown carbon aerosol during winter in Beijing [J].Atmospheric Environment, 127: 355 – 364.
Chung C E, Kim S W, Lee M, et al. 2012. Carbonaceous aerosol AAE inferred from in-situ aerosol measurements at the Gosan ABC super site, and the implications for brown carbon aerosol [J].Atmospheric Chemistry and Physics,12(14): 6173 – 6184.
Hecobian A, Zhang X, Zheng M, et al. 2010. Water-Soluble Organic Aerosol material and the light-absorption characteristics of aqueous extracts measured over the Southeastern United States [J].Atmospheric Chemistry and Physics, 10(13): 5965 – 5977.
Kirillova E N, Andersson A, Han J, et al. 2014. Sources and light absorption of water-soluble organic carbon aerosols in the outflow from northern China [J].Atmospheric Chemistry and Physics, 14(3): 1413 – 1422.
Laskin A, Laskin J, Nizkorodov S A. 2015. Chemistry of atmospheric brown carbon [J].Chemical Reviews,115(10): 4335 – 4382.
Laskin J, Laskin A, Nizkorodov S A, et al. 2014. Molecular selectivity of brown carbon chromophores [J].Environmental Science & Technology, 48(20): 12047 – 12055.
Lin P, Liu J M, Shilling J E, et al. 2015. Molecular characterization of brown carbon (BrC) chromophores in secondary organic aerosol generated from photo-oxidation of toluene [J].Physical Chemistry Chemical Physics,17(36): 23312 – 23325.
Liu J M, Scheuer E, Dibb J, et al . 2014. Brown carbon in the continental troposphere [J].Geophysical Research Letters,41: 2191–2195.
Liu J, Bergin M, Guo H, et al. 2013. Size-resolved measurements of brown carbon in water and methanol extracts and estimates of their contribution to ambient fine-particle light absorption [J].Atmospheric Chemistry and Physics, 13(24): 12389 – 12404.
Powelson M H, Espelien B M, Hawkins L N, et al. 2014.Brown carbon formation by aqueous-phase carbonyl compound reactions with amines and ammonium sulfate [J].Environmental Science & Technology, 48(2): 985 – 993.
Shen Z X, Cao J J, Zhang L M, et al. 2014. Day-night differences and seasonal variations of chemical species in PM10over Xi’an, northwest China [J].Environmental Science and Pollution Research International, 21(5): 3697 – 3705.
Srinivas B, Sarin M M. 2013. Light absorbing organic aerosols(brown carbon) over the tropical Indian Ocean: impact of biomass burning emissions [J].Environmental Research Letters, 8. DOI: 10.1088/1748-9326/8/4/044042.
Utry N, Ajtai T, Filep A, et al. 2013. Mass specific optical absorption coef fi cient of HULIS aerosol measured by a fourwavelength photoacoustic spectrometer at NIR, VIS and UV wavelengths [J].Atmospheric Environment, 69: 321 – 324.
Wang G H, Zhang R Y, Gomez M E, et al. 2016. Persistent sulfate formation from London Fog to Chinese haze [J].Proceedings of the National Academy of Sciences of the United States of America, 113(48): 13630 – 13635.
Wang J, Wang G, Gao J, et al. 2017. Concentrations and stable carbon isotope compositions of oxalic acid and related SOA in Beijing before, during and after the 2014 APEC [J].Atmospheric Chemistry and Physics, 17: 981 – 992.
Washenfelder R A, Attwood A R, Brock C A, et al. 2015.Biomass burning dominates brown carbon absorption in the rural southeastern United States [J].Geophysical Research Letters, 42(2): 653 – 664.
Yan C Q, Zheng M, Sullivan A P, et al. 2015. Chemical characteristics and light-absorbing property of watersoluble organic carbon in Beijing: Biomass burning contributions [J].Atmospheric Environment, 121: 4 – 12.
Yang F M, Brook J, He K B, et al. 2010. Temporal variability in fine carbonaceous aerosol over two years in two megacities: Beijing and Toronto [J].Advances in Atmospheric Sciences, 27(3): 705 – 714.
Zhang R J, Han Z W, Cheng T T, et al. 2009. Chemical properties and origin of dust aerosols in Beijing during springtime [J].Particuology, 7(1): 61 – 67.
Zhang X L, Lin Y H, Surratt J D, et al. 2011. Light-absorbing soluble organic aerosol in Los Angeles and Atlanta: A contrast in secondary organic aerosol [J].Geophysical Research Letters, 38(21). DOI: 10.1029/2011GL049385.
Zhang X L, Lin Y H, Surratt J D, et al. 2013. Sources, composition and absorption Ångstrǒ m exponent of light-absorbing organic components in aerosol extracts from the Los Angeles Basin [J].Environmental Science & Technology, 47(8): 3685 – 3693.
Zheng M, Zhao X Y, Cheng Y, et al. 2014. Sources of primary and secondary organic aerosol and their diurnal variations [J].Journal of Hazardous Materials, 264: 536 – 544.
Zíková N, Wang Y G, Yang F M, et al. 2016. On the source contribution to Beijing PM2.5concentrations [J].Atmospheric Environment, 134: 84 – 95.
Chemical composition of fine particulate matter and optical properties of brown carbon before and during heating season in Xi’an
ZHANG Lu1,2, WANG Gehui1,2, WANG Jiayuan1,2, WU Can1,2, CAO Cong1,2, LI Jianjun1
1. State Key Laboratory of Loess and Quaternary Geology, Institute of Earth Environment, Chinese Academy of Sciences, Xi’an 710061, China
2. University of Chinese Academy of Sciences, Beijing 100049, China
Background, aim, and scope Extremely high levels of ambient fine particulate matter (PM2.5) have frequently occurred in Xi’an and many other Chinese cities in winter mainly due to the enhanced emissions from house heating. Source and formation of the fi ne particulate matter are still illusive. This paper aims to identify the difference in chemical composition of PM2.5and optical properties of brown carbon (i.e. water-solubleorganic carbon) before and during the heating season in Xi’an, China in order to understand the impact of coal combustion and biomass burning for house heating on the urban air quality.Materials and methodsPM2.5samples were collected during 1st — 30th Nov. 2015 at the urban center of Xi’an, China by using a high-volume sampler(1.13 m3∙ min−1) with a 12 h interval. The samples were measured for element carbon (EC), organic carbon (OC),water-soluble organic carbon (WSOC), inorganic ions, optical mass absorption efficiency (MAE) at 365 nm light wavelength and Ångstrǒm absorption exponent (AAE).ResultsMass concentrations of PM2.5ranged from 39 μg ∙ m−3to 261 μg ∙ m−3with an average of 127 ± 59 μg ∙ m−3before the heating period (1st — 15th Nov.)and from 51 μg ∙ m−3to 511 μg ∙ m−3with an average of 164 ± 126 μg ∙ m−3during the heating period (16th — 30th Nov.). Carbonaceous fractions (EC+OC) of PM2.5were 21% ± 10% and 24% ± 10% before and during the heating season, respectively.DiscussionRelative abundances of Na+, Ca2+and Mg2+in PM2.5in clean days (classi fi ed as the daily PM2.5<75 μg ∙ m−3) was higher than in hazy days (classi fi ed as the daily PM2.5>150 μg ∙ m−3), suggesting an increased deposition effect under the humid and stagnant conditions. MAE before the heating season were 2.5 ± 0.8 m2∙ g−1and 1.6 ± 0.3 m2∙ g−1on the clean and hazy days, while MAE during the heating season were 1.7 ± 0.4 m2∙ g−1and 1.3±0.2 m2∙ g−1on the clean and hazy days, indicating that light absorption in clean days is stronger than that in hazy days.ConclusionsCompared to those before the heating period concentrations of K+and Cl−of PM2.5increased by 30% and 70% during the heating season, indicating a signi fi cant impact of biomass burning for house heating on the urban air quality. Due to the favorable humid and stagnant conditions, sulfate and ammonium of PM2.5increased by 40% and 38% in the heating season compared to those in the non-heating season. Optical absorption capacity of brown carbon in the heating season was 15% — 80% higher than that in the non-heating season due to the abundant WSOC. In contrast, MAE in the heating season was lower than those in the non-heating season, which was probably caused by an enhanced photochemically bleaching effect due to the longer reaction time under the stagnant hazy days.Recommendations and perspectivesIn the current work we only measured the optical properties of brown carbon, i.e., WSOC. Details in molecular compositions of WSOC are necessary for understanding the source and formation mechanism of the brown carbon.
Date: 2017-06-03; Accepted Date: 2017-08-22
National Science Fund for Distinguished Young Scholars (41325014); Strategic Priority Research Program of the Chinese Academy of Sciences (XDB05020401)
WANG Gehui, E-mail: wanggh@ieecas.cn
brown carbon; chemical composition; optical properties; source; formation mechanism
2017-06-03;录用日期:2017-08-22
国家杰出青年科学基金(41325014);中国科学院战略性先导科技专项(B类)(XDB0502040)
王格慧,E-mail: wanggh@ieecas.cn
张 璐,王格慧,王佳媛, 等. 2017. 西安供暖前后细颗粒物化学特征及棕碳吸光特性[J]. 地球环境学报, 8(5): 451 – 458.
: Zhang L, Wang G H, Wang J Y, et al. 2017. Chemical composition of fi ne particulate matter and optical properties of brown carbon before and during heating season in Xi’an [J]. Journal of Earth Environment, 8(5): 451 – 458.
猜你喜欢
作文与考试·小学低年级版(2021年12期)2021-08-09
魅力中国(2020年8期)2020-12-07
成都信息工程大学学报(2017年4期)2018-01-22
环境保护与循环经济(2017年2期)2017-09-26
环境保护与循环经济(2017年3期)2017-09-26
化工进展(2015年3期)2015-11-11
浙江大学学报(工学版)(2015年1期)2015-03-01
物理化学学报(2015年5期)2015-02-28
化学分析计量(2013年3期)2013-03-11
环境与可持续发展(2013年4期)2013-03-11
