基于特征荧光信号的去囊衣带芯橘瓣分选
2017-06-27 01:31:07王叶群杨增玲任卫东张绍英
农业工程学报 2017年9期
王叶群,杨增玲,任卫东,刘 婷,杨 杰,张绍英
基于特征荧光信号的去囊衣带芯橘瓣分选
王叶群1,杨增玲1,任卫东2,刘 婷1,杨 杰1,张绍英1※
(1. 中国农业大学工学院,北京 100083; 2. 汇川盛业技术(北京)有限公司,北京 100176)
为实现去囊衣带芯橘瓣的机器视觉分选,给去囊衣带芯橘瓣的机器识别提供直接、准确的判别信号,釆用荧光分光光度计对50颗去囊衣带芯橘瓣的橘芯和砂囊分别进行三维荧光光谱扫描,通过对橘芯、砂囊平均三维荧光光谱分析,确定了橘芯相对砂囊的特征荧光信号,据此对带芯橘瓣荧光图像识别的可行性进行了验证。检测发现,在370~390 nm紫外光激发下,橘芯和砂囊在440 nm处的荧光强度差异较大;橘芯与砂囊在370 nm紫外光激发下,440 nm处荧光强度分布的箱线图表明两者荧光强度分布存在明显差异,且以橘芯在440 nm处荧光强度的下四分位数(1)与砂囊在440 nm处荧光强度的上四分位数(3)的平均值作为分类标准,去囊衣带芯橘瓣检出准确率可达85%。对(370±2)nm激发下得到的单色(440±5)nm荧光图像进行二值化及形态学处理后,可在以砂囊为背景的橘瓣图形中显现橘芯亮斑。利用橘芯与砂囊的荧光特性差异进行机器视觉成像分析,可作为识别去囊衣带芯橘瓣的一种有效方法。
图像处理;光谱;荧光;去囊衣橘瓣;橘芯;砂囊;分选
0 引 言
橘子罐头是柑橘加工的主要产品[1]。橘子罐头以去囊衣橘瓣为主要成分,填充糖液后封装、杀菌制成。去囊衣一般采用化学或生化降解方法[2-3]。受发育差异、品种变异及加工条件的影响,去囊衣后的橘瓣中常包含带籽、破碎、浆化以及残留囊衣、橘络或橘芯(中心柱部分组织)等缺陷的个体。为保证产品口感和外观一致,装罐前须将缺陷橘瓣剔除[4-6]。目前,橘瓣罐头生产中缺陷橘瓣多采用人工分选,逐个甄别造成用工成本高,主观判断导致产品整齐度差,研究机器分选技术势在必行。
目前,与去囊衣橘瓣机器视觉分选相关的技术已有少量研究与应用[7-11]。任磊[12]利用白色环形光源与彩色相机采集橘瓣反射图像,通过提取蓝色分量与红色分量分别用于检测囊衣残留橘瓣与破损橘瓣。Blasco等[13]利用白色光源背光成像采集橘瓣的透射图像,通过分析橘瓣与背景、囊衣、橘籽的、、值,采用2次图像分割来检测缺陷橘瓣,提取分量图像将背景与感兴趣区域分割,提取分量图像将橘瓣与橘籽和囊衣分割,达到检测囊衣残留橘瓣与橘籽残留橘瓣的目的,利用形态学特征将破损橘瓣从完整橘瓣中识别出来。以上2项研究是针对囊衣残留橘瓣、橘籽残留橘瓣和破损橘瓣的机器视觉分选研究,但针对去囊衣后带芯橘瓣的机器分选尚未研究。
根据生物结构对特定光信号响应规律不同的原理,通过配置成像条件,提取缺陷个体与正常个体的图像信号差异,进而转化为分选执行信号,是现今机器识别的经典原理[14-19]。其中,发现缺陷的专属信号并使之与对比信号差异最大化,是实现机器识别的技术关键[20-25]。Baek等[26]利用荧光激发-发射矩阵选择最佳荧光波段,并结合荧光图像来检测表面开裂的圣女果,辨识准确率大于98%。因此,本文将尝试发现橘芯和砂囊信号差异显著的光学条件,确定橘芯相对砂囊的特征光学信号采集条件,为机器视觉识别判断提供准确的前提和基础,并论证利用图像识别去囊衣带芯橘瓣的可行性。
1 材料与方法
1.1 试验原料及样品制备
试验原料为温州无核蜜橘(产自福建漳州、2015年秋采收)。橘瓣罐头生产中,原料经剥皮、分瓣、酸碱处理后即可转化为去囊衣橘瓣。依据实际生产工艺条件,制订样品制备流程(图1)。取50颗去囊衣带芯橘瓣作为检测样本。
1.2 去囊衣带芯橘瓣的砂囊与橘芯发光特性检测
利用Cary Eclipse荧光分光光度计(VARIAN公司)对50颗去囊衣带芯橘瓣的砂囊和橘芯进行三维光谱扫描,确定橘芯和砂囊的特征峰[27-30]。
仪器参数设置:激发光源为150 W疝弧灯;电压设为600 V;信噪比>110;狭缝带宽激发狭缝与发射狭缝均设为5 nm;响应时间设为自动;扫描范围设为激发波长()为250~700 nm(间隔5nm),发射波长()为300~800 nm(间隔1 nm);扫描速度均为1 200 nm/min。
2 结果与分析
2.1 砂囊与橘芯三维荧光光谱分析
对50颗去囊衣带芯橘瓣的砂囊、橘芯分别进行三维荧光光谱扫描后,利用Matlab软件绘制其平均3D荧光光谱图见图2。
图2中a和b分别为砂囊和橘芯的三维荧光光谱图。当=及=2时,荧光光谱图出现的瑞利散射峰和倍频峰会影响图谱的分析。在干扰峰以外的其他区域,砂囊和橘芯的荧光光谱图均存在多处荧光峰,且这些荧光峰存在位置重叠。因此,不能单独依据橘芯3D荧光光谱图中的荧光峰作为残留橘芯的判断条件。
为提取去囊衣带芯橘瓣的特征信号,绘制了橘芯、砂囊荧光强度的差值图(图3a)。为避免瑞利散射()和倍频散射(2)对图谱分析的影响,根据三维荧光光谱扫描图中瑞利散射和倍频峰的分布规律,以±10 nm为带宽,屏蔽=及=2区域内干扰峰信号后,绘制了橘芯、砂囊的荧光强度3D差值图(图3b)。
由图3b可见,橘芯、砂囊对不同激发光的响应在多处存在差值峰,屏蔽倍频干扰峰后残留的1、2、3、4号峰所在区域实为倍频干扰峰的尾峰,受倍频干扰峰影响程度高,不宜作为差异信号选取区域。屏蔽瑞利散射后残留的6、7和8号峰具有1、2、3、4号峰相同的区域特性,同样不宜作为差异信号选取区域。故初步判断,远离瑞利散射峰和倍频干扰峰的差值峰(5、9)所在区域,是确定去囊衣带芯橘瓣专属信号的基础区域。
a. 砂囊
a. Gizzard
9号峰处于激发光波长在480~510 nm发射光波长在430 nm的区域,激发光和发射光均为可见光。在成像过程中,可见光污染将影响成像效果及分析判断的准确度。由图3b可知,5号峰所在的区域(激发光波长350~420 nm 发射光波长400~700 nm)远离瑞利散射区域;橘芯与砂囊荧光强度存在明显差异;且激发光跨越紫外与可见光区域;可选择位于紫外波段的光源作为图像采集光源,避免可见光污染。故选择5号峰所在区域为去囊衣带芯橘瓣专属信号区。
2.2 砂囊与橘芯特征波段的选择
为了进一步提高信号采集的抗干扰能力,精选信号采集波段,绘制了5号峰所在区域(=350~420 nm、=400~700 nm)的荧光强度差值等高图(图4)。
按橘芯、砂囊荧光强度差值大小,将图4划分为A、B、C和D 4个小区。在A区橘芯与砂囊的荧光强度差异最大,但濒临瑞利散射峰,易受信号噪声干扰,不宜作为信号采集区;B区域为信号差值较小的平缓区域,亦不宜作为信号采集区;C区域则呈现为一连绵峰脉,且在=440 nm处有自=370 nm绵延至=390 nm的平缓峰脊,利于进行单色成像;相对信号差值尖峰而言,峰脊的存在降低了激发光源带宽的要求,方便了激发光总能量的提升,还能产生相同波长发射光的强度累积,有助于获得高亮差图像;D区内橘芯与砂囊的荧光强度差异最小,不宜作为信号选择区域。
a. 原始图像
a. Original image
b. 去除干扰峰图
b. Image of removing interference peaks
注:1、2、3、4为倍频散射的尾峰,6、7、8为瑞利散射的尾峰,5、9为远离瑞利散射和倍频散射的荧光峰。
Note: 1, 2, 3, 4 are the tail peaks of frequency scattering, 6, 7, 8are the tail peaks of Rayleigh scattering, 5 and 9 are the fluorescence peaks that are away from Rayleigh scattering and frequency scattering.
图3 橘芯、砂囊荧光强度3D差值原始图及去除干扰峰图
Fig.3 Original and removing interference peaks 3D fluorescence spectra of difference between orange core and gizzard
由此可见,去囊衣带芯橘瓣荧光信号的采集条件宜为:激发光波长370~390 nm、发射光中心波长440 nm。
2.3 橘芯和砂囊荧光特性差异分析
将 50颗去囊衣带芯橘瓣的砂囊和橘芯在370 nm紫外光激发下,400~700 nm处的荧光强度值分别从其三维荧光光谱中提取出来,并绘制两者的二维荧光光谱图(图5)。
由图5可知,在370 nm紫外光激发下,橘芯与砂囊均在440 nm处有荧光峰,但是荧光强度存在差异。在370 nm紫外光激发下,50颗去囊衣带芯橘瓣橘芯与砂囊的荧光强度分布的中位数和四分位数如表1所示。
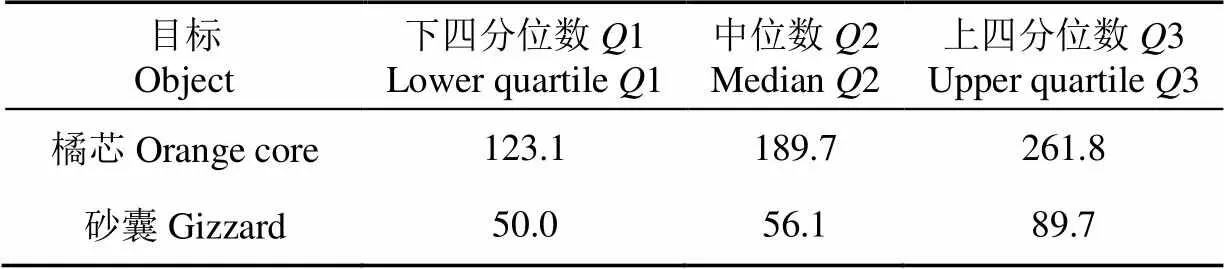
表1 橘芯与砂囊440 nm处荧光强度分布的中位数和四分位数
由表1可知,橘芯与砂囊在440 nm处荧光强度分布的中位数位置、四分位数位置均不同,表明两者在370 nm紫外光激发下,在440 nm处荧光强度值存在明显差异。以橘芯在440 nm处荧光强度的下四分位数(1)与砂囊在440 nm处荧光强度的上四分位数(3)的平均值作为临界值(),荧光强度大于该临界值的判断为橘芯,荧光强度小于该临界值的判断为砂囊。由表2可知50颗橘芯中有6颗被判断为砂囊,分类准确率为88%;50颗砂囊中有9颗被判断为橘芯,分类准确率为82%;橘芯与砂囊平均分类准确率为85%,因此,利用370 nm紫外光激发下,橘芯与砂囊在440 nm处荧光强度的差异可以将两者有效区分。
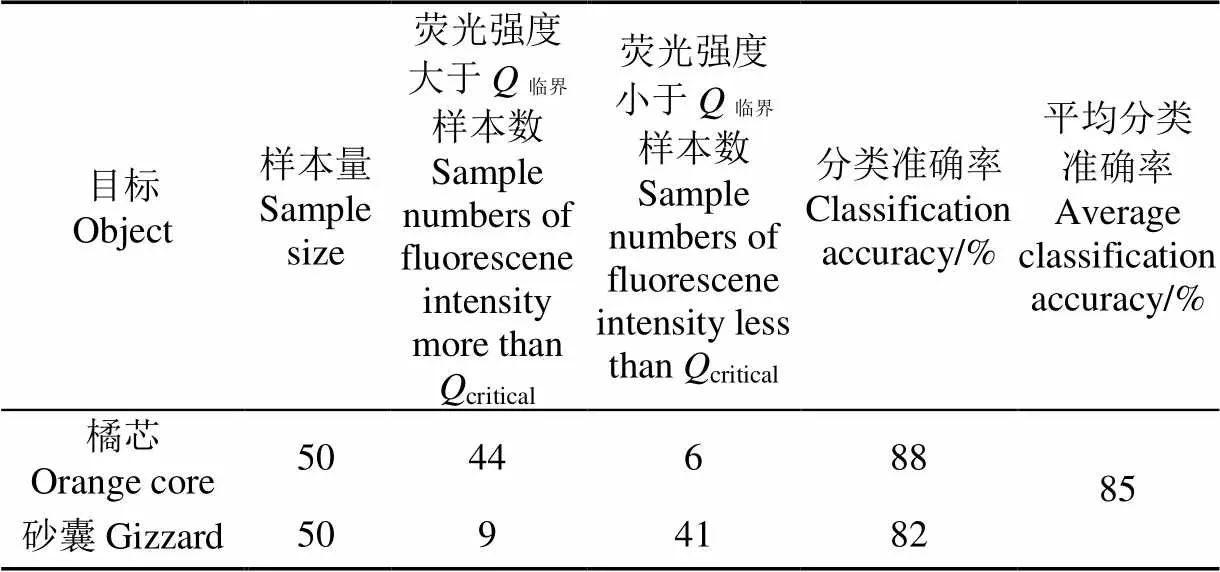
表2 砂囊与橘芯依据Q临界的分类表
2.4带芯橘瓣的图像分选
依据橘芯与砂囊荧光强度差异最大化条件,配置去囊衣橘瓣成像系统(图6),该系统由暗箱、单色光源(2台LED射灯,中心波长370±2 nm,功率30 w,光锥角30°)、CCD相机(Image soft G445彩色相机130万像素)、滤光片(440±5 nm)、计算机和背景板组成。
在自然光、(370±2)nm紫外光激发和(370±2) nm紫外光激发加(440±5)nm滤光3种条件下,分别对去囊衣带芯橘瓣和无芯橘瓣成像。
将采集到的bmp格式的彩色图像,利用IN Vision Assistant图像处理软件依次进行掩膜处理(掩膜是由0和1组成的一个二进制图像,在图像处理中可用来提取感兴趣区域,即用该二进制图像与待处理图像相乘,得到感兴趣区图像,感兴趣区内图像值保持不变,而区外图像值都为0)、灰度图像提取(对RGB图像进行B分量提取,因为在紫外激发下橘芯发出的荧光在440 nm附近,提取B分量转化的灰度图像亮度最高)、二值处理(二值化阈值为50)和形态学处理(高级形态学处理,去掉较小的目标,腐蚀数设定为2)[31-34],其结果见图7。
由图7a可知,去囊衣带芯橘瓣在紫外光激发经滤光后,橘芯部位出现蓝色荧光亮斑(紫外光加滤光片),将其转化成灰度图像后进行二值处理,橘芯部分基本可与砂囊部分区分,对二值化图像进行形态学处理,去除砂囊表面反光等信号噪音后,可观察到橘芯部位亮斑(形态学处理图像),将紫外光加滤光片形态学处理后的图像与灰度图像经过逻辑加运算进行叠加(逻辑运算图像),可判断提取出的特征区域是否为橘芯部位。
由图7b可知,去囊衣无芯橘瓣在紫外光激发、滤光后的图像中未出现荧光亮斑,将其转化成灰度图像后进行二值处理和形态学处理,去除砂囊表面反光等信号噪音后,未提取出任何信息。
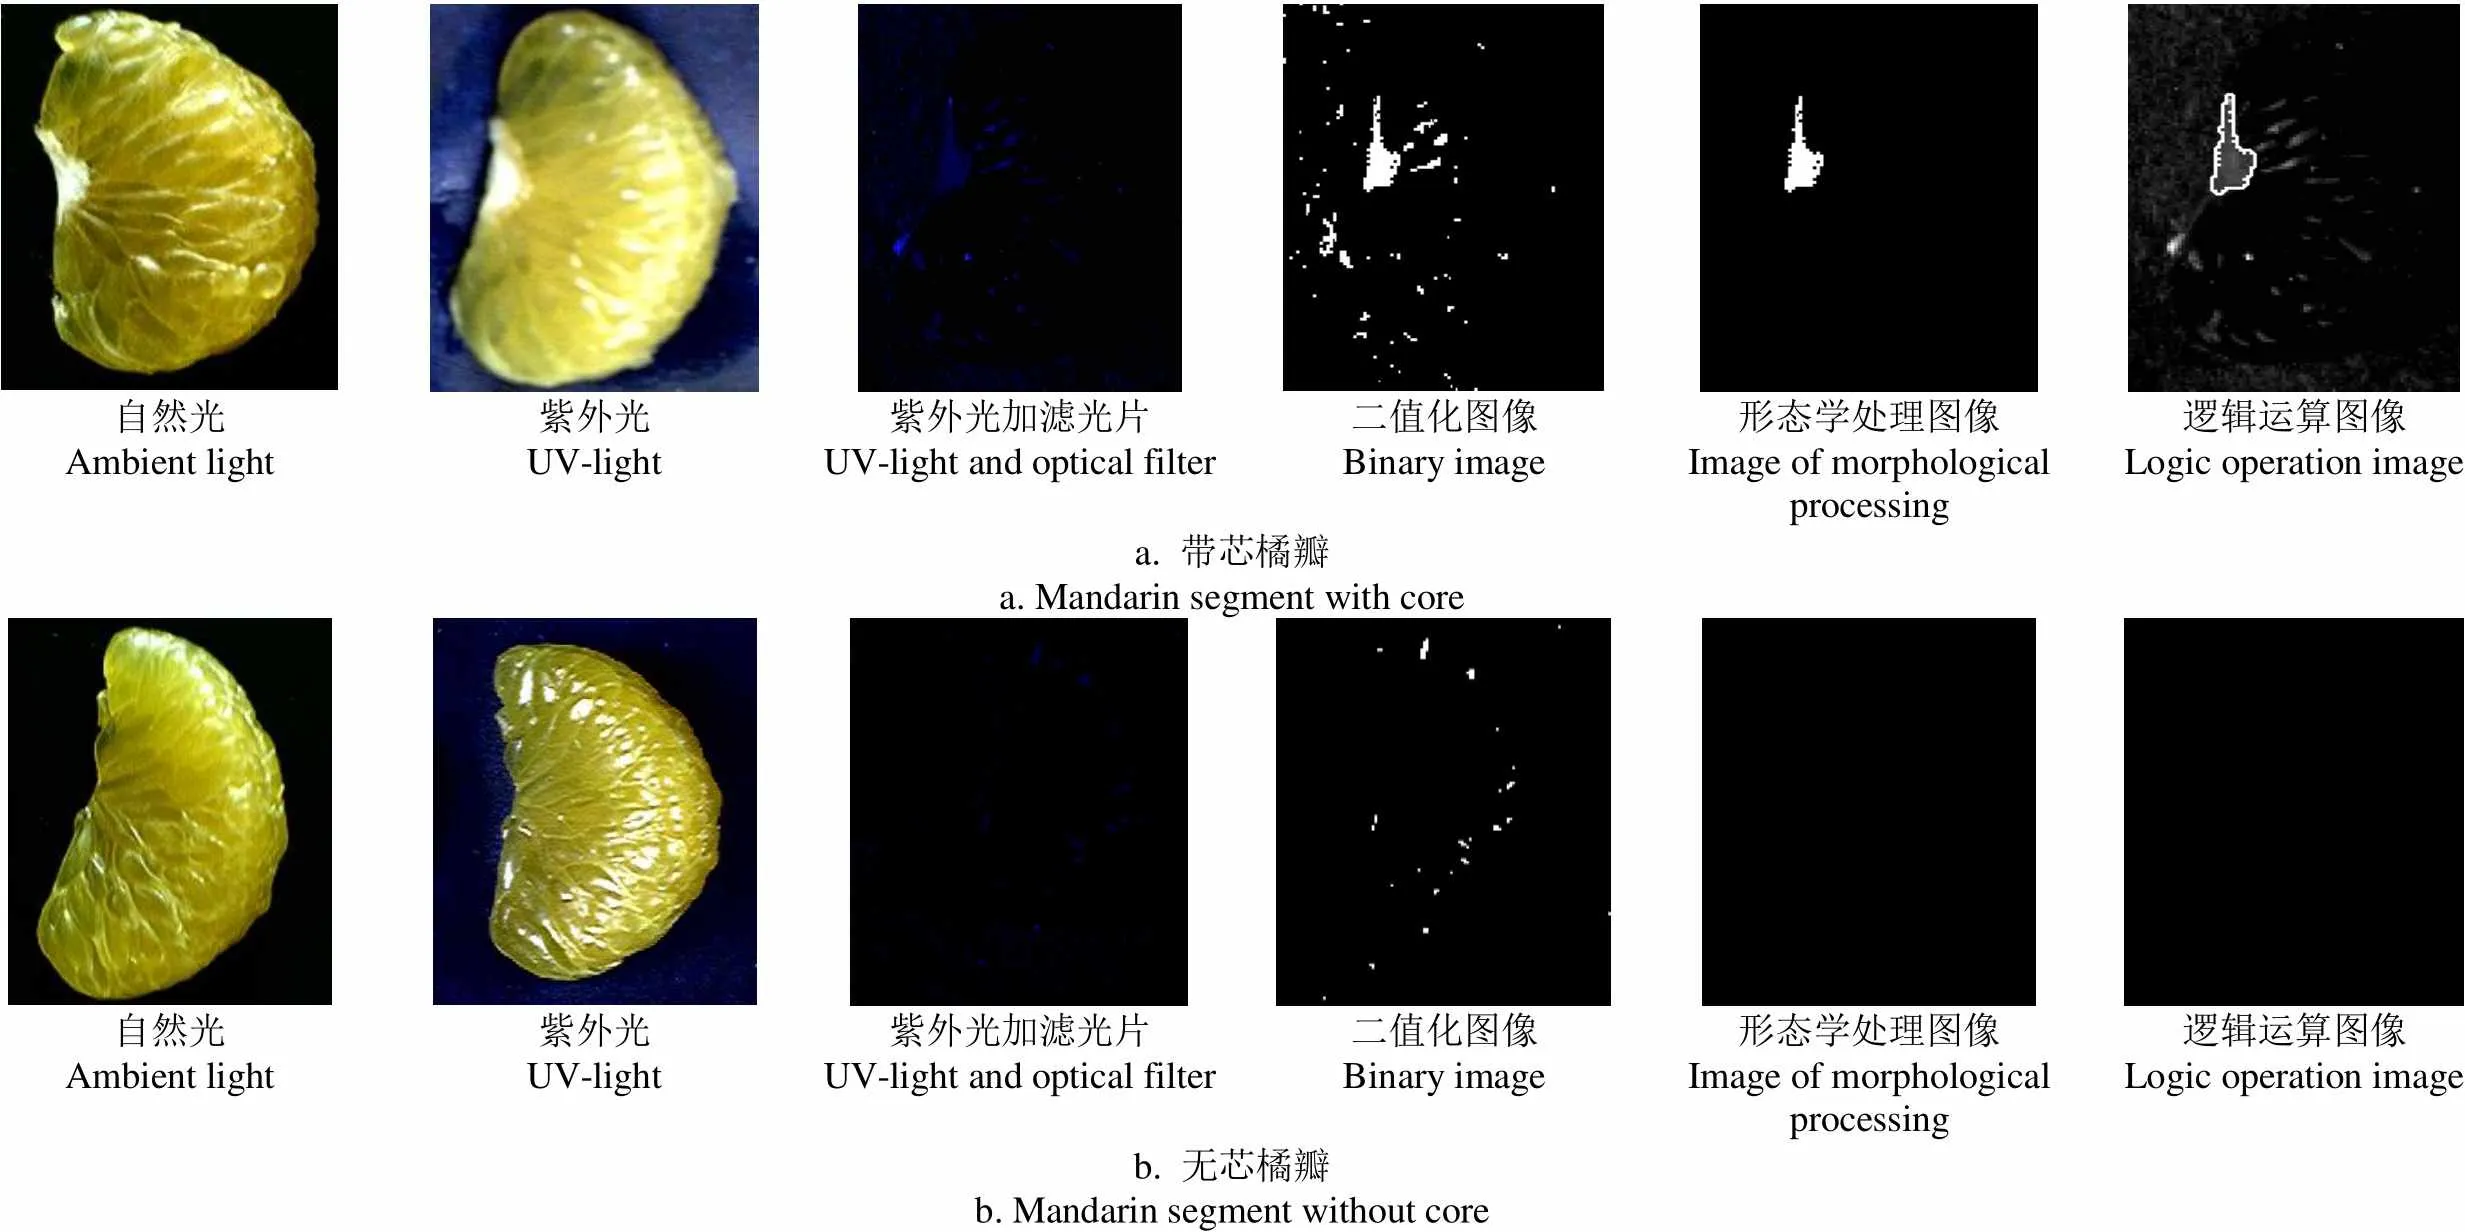
自然光Ambient light紫外光UV-light 紫外光加滤光片UV-light and optical filter二值化图像Binary image形态学处理图像Image of morphological processing逻辑运算图像Logic operation image a. 带芯橘瓣a. Mandarin segment with core 自然光Ambient light紫外光UV-light 紫外光加滤光片UV-light and optical filter二值化图像Binary image形态学处理图像Image of morphological processing逻辑运算图像Logic operation image b. 无芯橘瓣b. Mandarin segment without core
据此可见,以(370±2)nm 激发进行单色(440±5)nm成像后,利用机器视觉进行分析、判别,可为剔除去囊衣橘瓣中的带芯橘瓣提供有效的执行信号。
3 结 论
为实现去囊衣带芯橘瓣的机器分选,本文依据去囊衣带芯橘瓣上橘芯、砂囊的荧光特性差异,判定了去囊衣带芯橘瓣上橘芯、砂囊的荧光特性差异最大化条件;评估了利用荧光特性差异区分橘芯与砂囊的准确率;并利用试验验证了紫外荧光成像进行机器视觉识别去囊衣带芯橘瓣的可行性,并得到如下结论:
1)去囊衣带芯橘瓣上橘芯与砂囊在=370~390 nm、=440 nm区域内荧光强度差异较大。
2)在激发波长为370 nm时,去囊衣带芯橘瓣的橘芯与砂囊在中心波长440 nm处的荧光强度存在明显差异,且以橘芯在440 nm处荧光强度的下四分位数(Q1)与砂囊在440 nm处荧光强度的上四分位数(Q3)的平均值作为分类标准,去囊衣带芯橘瓣分类准确率可达85%。
3)以(370±2)nm为激发光源,对去囊衣橘瓣进行滤光(440±5)nm成像后采用IN Vision Assistant进行图像处理,可以有效识别出去囊衣带芯橘瓣。
[1] 汪薇,赵文红,白卫东. 我国柑橘加工中的技术难题[J].食品科技,2009,34(11):72-75.
Wang Wei, Zhao Wenhong, Bai Weidong. Technical problems of citrus processing in China[J]. Food Science And Technology, 2009, 34(11): 72-75. (in Chinese with English abstract)
[2] 单杨. 现代柑橘工业[M]. 北京:化学工业出版社,2013.
[3] 邓秀新,彭抒昂. 柑橘学[M]. 北京:中国农业出版社,2013.
[4] The Codex Alimentarius Commission. Standard for Certain Canned Citrus Fruits: CODEX STAN 254-2007[S].2007.
[5] 邹英宁,鲁蕾. 温州蜜柑果实不同部位抗氧化性能的比较[J]. 贵州农业科学2010,38(10):169-170.
Zou Yingning, Lu Lei.Oxidation resistance of different fruit parts of satsuma mandarin[J]. Guizhou Agricultural Sciences, 2010, 38(10): 169-170. (in Chinese with English abstract)
[6] 单杨,刘伟,李高阳. 柑橘工业国际标准体系建设研究[J].中国食品学报,2014,34(6):2-8.
Shan Yang, Liu Wei, Li Gaoyang. Research on construction of the citrus industry international standard systems[J]. Journal of Chinese Institute of Food Science and Technology, 2014, 34(6): 2-8. (in Chinese with English abstract)
[7] 邓立苗,杜宏伟,徐艳,等. 基于机器视觉的马铃薯智能分选方法与实现[J]. 中国农机化学报,2015,36(5):145-150.
Deng Limiao, Du Hongwei, Xu Yan, et al. Implementation of intelligent potato grading method based on computer vision[J]. Journal of Chinese Agricultural Mechanization, 2015, 36(5): 145-150. (in Chinese with English abstract)
[8] 赵杰文,刘剑华,陈全胜,等. 利用高光谱图像技术检测水果轻微损伤[J]. 农业机械学报,2008,39(1):106-109.
Zhao Jiewen, Liu Jianhua, Chen Quansheng, et al. Detecting subtle bruises on fruits with hyperspectral imaging[J]. Transactions of the Chinese Society for Agricultural Machinery, 2008, 39(1): 106-109. (in Chinese with English abstract)
[9] Blasco J, Aleixos N, Moltó E. Computer vision detection of peel defects in citrus by means of a region oriented segmentation algorithm[J]. Journal of Food Engineering, 2007, 81(3): 535-543.
[10] Mehl P M, Chen Y R, Kim M S, et al. Development of hyperspectral imaging technique for the detection of apple surface defects and contaminations.[J]. Journal of Food Engineering, 2004, 61(1): 67-81.
[11] Throop J A, Aneshansley D J, Anger W C, et al. Quality evaluation of apples based on surface defects: development of an automated inspection system[J]. Postharvest Biology & Technology, 2005, 36(3): 281-290.
[12] 任磊. 基于机器视觉的脱囊衣橘片分拣装置研究[D]. 金华:浙江师范大学,2015.
Ren Lei. Research on Peeled Mandarin Segments Sorting Device Based on Machine Vision[D]. Jinhua: Zhejiang Normal University, 2015. (in Chinese with English abstract)
[13] BlascoJ, Aleixos N, Cubero S, et al. Automatic sorting of satsuma (citrus unshiu) segments using computer vision and morphological features[J]. Computers and Electronics in Agriculture, 2009, 66(1): 1-8.
[14] Spielmanns R, Spielmanns J, Damerow L, et al. Non-destructive determination of surface features of pomegranate fruit[J]. Acta Horticulturae, 2016(1137): 247-250.
[15] Bennedsen B S, Peterson D L, Amy Tabb. Identifying defects in images of rotating apples[J]. Computers and Electronics in Agriculture, 2005, 48(2): 92-102.
[16] Kleynen O, Leemans V, Destain M F. Development of a multi-spectral vision system for the detection of defects on apples.[J]. Journal of Food Engineering, 2005, 69(1): 41-49.
[17] Beers R V, Aernouts B, Gutiérrez L L, et al. Optimal illumination-detection distance and detector size for predicting braeburn, apple maturity from Vis/NIR laser reflectance measurements[J]. Food and Bioprocess Technology, 2015, 8(10): 2123-2136.
[18] 侯瑞锋,黄岚,王忠义,等. 农产品组织中光输运规律的初步研究[J]. 农业工程学报,2005,21(9):12-15.
Hou Ruifeng, Huang Lan, Wang Zhongyi, et al. Preliminary study of the light migration in farm product tissue[J]. Transactions of the Chinese Society of Agricultural Engineering (Transactions of the CSAE), 2005, 21(9): 12-15. (in Chinese with English abstract)
[19] 张立彬,胡海根,计时鸣,等. 果蔬产品品质无损检测技术的研究进展[J]. 农业工程学报,2005,21(4):176-180.
Zhang Libin, Hu Haigen, Ji Shiming, et al. Review of non-destructive quality evaluation technologyfor fruit and vegetable products[J]. Transactions of the Chinese Society of Agricultural Engineering (Transactions of the CSAE), 2005, 21(4): 176-180. (in Chinese with English abstract)
[20] Vijayarekha K. Machine vision application for food quality: A review[J]. Research Journal of Applied Sciences, Engineering and Technology, 2012, 4(24): 5453-5458.
[21] Albrecht R, Verrecchia E, Pfeifer H R. The use of solid-phase fluorescence spectroscopy in the characterisation of organic matter transformations.[J]. Talanta, 2015, 134: 453-459.
[22] 孙跃宗,程存归,许茂成,等. 橘络及其伪品的红外光谱鉴别[J]. 中药材,2002,25(11):783-786.
[23] Trong N N D, Rizzolo A, Herremans E, et al. Optical properties–microstructure–texture relationships of dried apple slices: Spatially resolved diffuse reflectance spectroscopy as a novel technique for analysis and process control[J]. Innovative Food Science & Emerging Technologies, 2014, 24(4): 145-153.
[24] 石舒宁,谭佐军,谢静,等. 果皮厚度对水果组织中光传输特性的影响[J]. 光谱学与光谱分析,2015,35(7):1817-1823.
Shi Shuning, Tan Zuojun, Xie Jing, et al. The effects of skin thickness on optical transmission characteristics in fruits tissues[J]. Spectroscopy and Spectral Analysis, 2015, 35(7): 1817-1823. (in Chinese with English abstract)
[25] 王叶群,杨增玲,张绍英,等. 用于污染黄曲霉毒素花生分选的荧光信号研究[J]. 农业工程学报,2016,32(1):187-192.
Wang Yequn, Yang Zengling, Zhang Shaoying, et al. Fluorescent signal characteristics for sorting of peanut contaminated by aflatoxion[J]. Transactions of the Chinese Society of Agricultural Engineering (Transactions of the CSAE), 2016, 32(1): 187-192. (in Chinese with English abstract)
[26] Baek I S, Kim M S, Lee H, et al. Optimal fluorescence waveband determination for detecting defective cherry tomatoes using a fluorescence excitation-emission matrix.[J]. Sensors, 2014, 14(11): 21483-21496.
[27] Qin J, Lu R. Measurement of the absorption and scattering properties of turbid liquid foods using hyperspectral imaging[J]. 2007, 61(4): 388-396.
[28] Fernández-Romero M L, Clark J M, Collins C D, et al. Evaluation of optical techniques for characterising soil organic matter quality in agricultural soils[J]. Soil & Tillage Research, 2016, 155: 450-460.
[29] Hu D, Fu X P, Wang A C, et al. Measurement methods for optical absorption and scattering properties of fruits and vegetables[J]. Transactions of the American Society of Agricultural and Biological Engineers, 2015, 58(5): 1387-1401.
[30] 斯蒂格,尤里奇,威德曼.机器视觉算法与应用[M]. 北京:清华大学出版社,2008.
[31] 郭永豪. 苹果特征图像提取与分类算法的研究与应用[D].重庆:重庆大学,2010.
Guo Yonghao. Research and Application on Apple Image Feature Extraction and Classification Algorithms[D]. Chongqing: University Chongqing China, 2010. (in Chinese with English abstract)
[32] 赵娟,彭彦昆,Sagar Dhakal,等. 基于机器视觉的苹果外观缺陷在线检测[J]. 农业机械学报,2013,44(增刊1):260-263.
Zhao Juan, Peng Yankun, Sagar Dhakal, et al. On-line detection of apple surface defect based on image processing method[J].Transactions of the Chinese Society for Agricultural Machinery, 2013, 44(Supp.1): 260-263. (in Chinese with English abstract)
[33] 任永新,单忠德,张静,等. 计算机视觉技术在水果品质检测中的研究进展[J]. 中国农业科技导报,2012,14(1):98-103.
Ren Yongxin, Shan Zhongde, Zhang Jing, et al. Research progress on computer vision technique in fruit quality inspection[J]. Journal of Agricultural Science and Technology, 2012, 14(1): 98-103. (in Chinese with English abstract)
[34] Sardar H. Fruit quality estimation by color for grading[J]. International Journal of Modeling & Optimization, 2014, 4(1): 38-42.
Sorting of peeled mandarin segments with orange core based on characteristic fluorescent signal
Wang Yequn1, Yang Zengling1, Ren Weidong2, Liu Ting1, Yang Jie1, Zhang Shaoying1※
(1.100083,; 2.,100176,)
The peeled mandarin segment with orange core (central column residue) is one kind of defective mandarin segment during the production of canned mandarin. So it is necessary to remove the defective mandarin segments according to the requirement of quality before canning. Due to the differences of physical and chemical properties between orange core and orange gizzard, the fluorescence spectra of orange core and orange gizzard are different theoretically. For the purpose of offering direct and accurate signals to the machine to identify the peeled mandarin segments with orange cores, in this study, the peeled mandarin segments were taken as the samples, and the 3D (three-dimensional) fluorescence spectra of orange core and orange gizzard were determined by Cary Eclipse fluorescent spectrophotometer (excitation wavelength in the range of 250-700 nm, 5 nm interval; emission wavelength in the range of 300-800 nm, 1 nm interval; discharge voltage of 600 V, scanning speed of 1 200 nm/min). The differences of fluorescence characteristics of orange core and orange gizzard were found according to the 3D fluorescence spectra after removing Rayleigh and Raman scatter. In order to verify the differences further, the fluorescence spectra of orange core and orange gizzard of 50 peeled mandarin segments were determined by Cary Eclipse fluorescent spectrophotometer (at an excitation wavelength of 370 nm, an emission wavelength in the range of 400-700 nm with the interval of 1 nm, a discharge voltage of 600 V, a scanning speed of 1 200 nm/min). The differences of fluorescence intensities at 440 nm for orange core and orange gizzard were evaluated by means of drawing the box-plots of the fluorescence intensity at 440 nm. The accuracy rate of the discrimination of orange core and orange gizzard was analyzed, and the average value between fluorescence intensity of orange core at the lower quartile and that of orange gizzard at the upper quartile at 440 nm was used as classification criterion. The camera obscura was taken as a platform, and 2 sets of ultraviolet light sources with center wavelength of (370±2 nm) were selected asimaging light sources. The fluorescence images of the mandarin segments with and without orange core were taken using a monochrome fluorescence image acquisition system, which was set up by putting a band-pass filter (440±5 nm) in the front of Image soft G445 camera objective. The grayscale images were obtained by extracting B color component from RGB images, and then the binary images were generated by applying the threshold values, with the IN Vision Assistant software. The results showed that there were significant differences between orange core and orange gizzard of peeled mandarin segments at an excitation wavelength of 370-390 nm and an emission wavelength of 440 nm. According to the classification criterion the discrimination accuracy of orange core and orange gizzard was 85%. Meanwhile, using the fluorescence image acquisition system, the monochrome images of the mandarin segments with and without orange core were obtained respectively.There was significant difference between them, and thus the mandarin segments with orange core and the mandarin segments without orange core could be distinguished effectively. Overall, the study indicates that the fluorescence signal at an excitation wavelength of 370-390 nm and an emission wavelength of 440 nm can be the exclusive light signal of the orange core for on-line, nondestructive sorting, which is help to eliminate the peeled mandarin segments with orange core.
image processing; spectrum; fluorescence; peeled mandarin segments; orange core; orange gizzard; sorting
10.11975/j.issn.1002-6819.2017.09.039
TP391.44
A
1002-6819(2017)-09-0296-06
2016-11-29
2017-04-13
国家重点研发计划(2016YFD0400305)
王叶群,女,陕西人,博士生,主要从事农产品检测与分选研究。北京 中国农业大学工学院,100083。Email:yequnwang@126.com
张绍英,男,河北人,教授,博士生导师,主要从事农产品加工与装备研究。北京 中国农业大学工学院,100083。Email:cauzsy@cau.edu.cn
王叶群,杨增玲,任卫东,刘 婷,杨 杰,张绍英. 基于特征荧光信号的去囊衣带芯橘瓣分选[J]. 农业工程学报,2017,33(9):296-301. doi:10.11975/j.issn.1002-6819.2017.09.039 http://www.tcsae.org
Wang Yequn, Yang Zengling, Ren Weidong, Liu Ting, Yang Jie, Zhang Shaoying. Sorting of peeled mandarin segments with orange core based on characteristic fluorescent signal[J]. Transactions of the Chinese Society of Agricultural Engineering (Transactions of the CSAE), 2017, 33(9): 296-301. (in Chinese with English abstract) doi:10.11975/j.issn.1002-6819.2017.09.039 http://www.tcsae.org
猜你喜欢
昆明医科大学学报(2021年8期)2021-08-13 08:59:28
北方人(2021年1期)2021-04-02 10:14:55
思维与智慧·上半月(2020年10期)2020-10-12 14:25:41
思维与智慧(2020年19期)2020-10-12 07:49:20
四川冶金(2019年5期)2019-12-23 09:04:48
中央民族大学学报(自然科学版)(2018年3期)2018-11-09 01:16:32
创新作文(小学版)(2017年29期)2017-04-04 02:04:08
电线电缆(2016年5期)2016-02-27 09:02:08
中国塑料(2014年1期)2014-10-17 02:46:36
原子能科学技术(2014年1期)2014-02-28 22:17:20