VideoMap: An interactiveand scalablevisualization for exploring video content
Cui-Xia Ma(),Yang Guo,and Hong-An Wang
©The Author(s)2016.This article is published with open access at Springerlink.com
VideoMap: An interactiveand scalablevisualization for exploring video content
Cui-Xia Ma1,3(),Yang Guo2,and Hong-An Wang1,3
©The Author(s)2016.This article is published with open access at Springerlink.com
DOI 10.1007/s41095-016-0049-1 Vol.2,No.3,September 2016,291–304
Large-scale dynamic relationaldata visualization has attracted considerable research attention recently.We introduce dynamic data visualization into the multimedia domain,and present an interactive and scalable system,VideoMap,for exploring large-scale video content.A long video or movie has much content;the associations between the content are complicated.VideoMap uses new visual representations to extract meaningful information from video content.Map-based visualization naturally and easily summarizes and reveals important features and events in video.Multi-scale descriptions are used to describe the layout and distribution of temporal information,spatialinformation,and associations between video content.Firstly,semantic associations are used in which map elements correspond to video contents. Secondly,video contents are visualized hierarchically from a large scale to a fine-detailed scale.VideoMap uses a small set of sketch gestures to invoke analysis,and automatically completes charts by synthesizing visual representations from the map and binding them to the underlying data.Furthermore, VideoMap allows users to use gestures to move and resize the view,as when using a map,facilitating interactive exploration.Our experimental evaluation of VideoMap demonstrates how the system can assist in exploring video content as well as significantly reducing browsing time when trying to understand and find events of interest.
map metaphor; video content visualization; sketch-based interaction;association analysis
1 Introduction
Large-scale dynamic relational data visualization and interaction has attracted considerable attention recently.Many works have focused on visualization of dynamic relational data,such as social media data including music and TV viewing trends[1], streaming text data[2],web trends[3],etc.Maps are one of the typical methods used to visualize large-scale dynamic relational data as they preserve the mental map perceived by users[1]. Inspired by Ref.[1],we visualize video content by taking advantage of the map metaphor. Videos can be considered to be a type of large-scale dynamic relational data.In particular,a lengthy video (such as a movie or surveillance video data,which integrates several video clips)contains a wealth of information,containing various characters,different scenes,and complex connections between each scene.The movie The Matrix,an example that will be used throughout this paper,includes about 14 main characters and 76 characters in all(one character appears repeatedly in different scenes),14 main events,and 83 kinds of connections between scenes.Thedetailed contentand complicated relationships between this varied data make the process of browsing and analyzing video content a laborious and time consuming task for users. Efficient visualization and interaction are important in reducing the exploratory burden for users.Image a scenario.Fans of The Matrix do not tire of watching it over and over.If they had a video map for this movie,they would be excited to be able to access information of interest in depth,just like following
the steps in a treasure map hunt.In this paper,we propose a tool,VideoMap,which can display multiscale views of video content,serving as an efficient video exploration tool.

Fig.1 Our proposed method,VideoMap,visualizes relations in video data by taking advantage of the geographic map metaphor,providing an intuitive and effective way to explore video content.Such content as characters,scenes,events,and relationships in videos are made available through map elements,including objects(dots),scenes(blocks),and roads(lines),as shown in(c).Main events in different scenes(blocks) are represented in(a).Events involving the same characters are connected using an event timeline.VideoMap can zoom in from a very large scale to a small scale of fine-detailed representation of video data by selecting a region of interest—see(b).Users can quickly explore video content and its associated trajectories(roads)to locate items of interest.
Various solutions have been provided to facilitate browsing and exploration ofvideo data by summarizing or visualizing the video content. Traditional methods focus on extracting salient frames and displaying them in different forms,like video cubes in 3D[4],volume visualization for video sequences[5],keyframe posters[6],panorama excerpts[7],video booklets[8],video storyboarding frameworks[9],and so on.Other methods extract and visualize important information such as moving objects or movement trajectories[10,11].These video summarization and visualization methods rarely consider the overall layout when integrating different scenes and interaction.Ma et al.[12] proposed a sketch-based interactive video authoring tool with sketch summarization for video content, but this method was limited to visualizing content and relationships in video data using a line drawing format.In particular,most traditional approaches focus on depicting specific events and do not account for associations between events,characters, or scenes.
The purpose of visualizing video data is to develop appropriate approaches for processing large amounts of video data with the assistance of computers, which can extract semantic associations and patterns contained within video data.Maps are a familiar way to present an overview,show connections,and allow a shift from large scale down to a precise representation of video data(cf.semantic zooming in a map).Massive video data can be processed to generate dots(representing characters or objects), graphical patterns (associations), and regions (scenes)on a map to allow intelligent judgment and provide recommendations for information analysis and retrieval.For example,on a map of video data, by sketching circles around two dots(representing characters or events of interest),related paths can be interactively synthesized and recommended using existing visualized elements.Furthermore, traditional map interaction methods of zooming and panning make them easy to use when exploring data. Thus,maps offer a promising way to visualize video data.
Few visualization techniques have been adequately utilized to help users effectively analyze associations in video content.Video summarization can help users obtain overview information from a target video sequence in limited time.Video exploration offers efficient interfaces to access video content,but integrating these two approaches so as to satisfy user demands,with user-friendly interaction,is a major
challenge.
This paper proposes VideoMap,an interactive visualization system that summarizes multi-scale video content using the map metaphor,extracting characters, scenes, events, and associations. VideoMap facilitates exploration of video data. Our contributions comprise the following:(1)We provide a novel video visualization approach for exploration of video data.The system provides a multi-scale visualization that contains information from different views.(2)Our approach incorporates intuitive sketch-based interaction that facilitates association analysis through visual inspection of video data on the map,translating previously unseen video data into its most likely description.Possible examples of queries are“what happened between Trinity in the Matrix and Cypher in reality”,or“what are the relations between these two selected events”.Such complex tasks are possible primarily by exploring the different paths between the two characters by use of sketch-based interaction.
2 Related work
Our research is closely related to work on video visualization,video visual analysis,and contentbased video interaction.We first review current analytical visualization techniques for video content, then recent work on content-based video interaction, and finally,work on map metaphors.
Video visual analysis has become an important technique.Exploring video data simply by watching it is inappropriate for large databases.This problem is particularly obvious in video surveillance[13,14]. H¨oferlin and Weiskopf[15]propose an approach for fast identification of relevant objects based on properties of their trajectories.Meghdadi and Irani[16]present a novel video visual analytics system which considers each object's moving path,and provides analysts with various views of information related to moving objects in a video.Though the power of the system is due to its ability to summarize movements individually and apply spatiotemporal filters to limit the search results,other aspects are also considered,such as the attributes of moving objects and relations between them.Walton et al.[17]present an efficient solution to mitigate the undesirable distortion of re-targeted vehicle objects in traffic video visualization by a series of automated algorithmic steps,including vehicle segmentation,vehicle roof detection,and non-uniform imagedeformation by applying a second homography.They concentrate only on aerial views;the challenges include intelligent removal of existing vehicles in an aerial view to provide more sophisticated background models.Video visual analytics addresses scalable and reliable analysis of video data to help decision making.H¨oferlin et al.[18]propose a video visual analytics method that combines the complementary strengths of human recognition and machine processing.Most studies focus on analyzing surveillance videos containing specific events that occur in fixed environments. For general movies,they depict a story more dramatically,which happens in variable scenes.
There are also many works in movie and video summarization and visualization which enable users to understand video content without the burden of viewing videos.A summary of video can be given by generating still images[19]or short video clips that focus on the moving objects[20]. Slittear visualization extracts a scan line from a video frame and adds the line to a composite image to help with video analysis and exploration[21]. Tanahashi and Ma[22]use a storyline to depict the temporal dynamics of social interaction,as well as to build a storyline for every character.Crossed lines represent interactions between characters.However, the storyline only includes one dimension,time, does not support association,and hardly considers interaction.Our work provides a 2D representation to visualize video data through a map metaphor, allowing analysis of video content by exploring the generated map.
Interaction with video content is important to access video data.Besides the traditional interaction method of using markers on a timeline to navigate through video content[23],new natural sketch-based interaction has been used in video authoring[12,24] by operating on a sketch summary.Visual feedback is also important for efficient interaction,following user preferences[25].Interaction with a map by zooming or drawing freely on it is familiar to all,and easy.Semantic zooming adjusts the scale of content, as in Google maps.A multi-scale interface allows
users to use zooming tools to manipulate content by viewing different representations at different scales[26]. In our study,sketches and a multiscale interface are appropriate for controlling the VideoMap via a map metaphor.
Using maps to visualize non-cartographic data in visualization systems has been studied.McCarthy and Meidel[27]build a visualization tool for location awareness by mapping offices,using badges that transmit infrared identification signals.This allows them to seek out colleagues for informal,faceto-face interactions.Their way of using the map metaphor just updates dynamic location information and represents it in an efficient way.However,this tool does not focus on how to show development of events and does not use a geographic map metaphor.Nesbitt[28]uses the metro map metaphor to summarize the ideas in a complex thesis,to communicate a business plan,to help university students understand a course structure,and so on.They simply use lines and points to represent informationinawaymoreakingtoaDAG (directed acyclic graph)than a map.Mashima et al.[1]describe a map-based visualization system to visualize user traffic on the Internet radio station last.fm and TV-viewing patterns from an IPTV service.It works well for visualizing large-scale dynamic relational data,but it limits users from interacting effectively.Gansner et al.[29]propose a method of visualizing and analyzing streaming packets viewed as a dynamic graph,and use it to visualize Twitter messages.Though its interface and algorithmic components are novel and attractive,its visualization capacity would be challenged in the presence of large-scale data.
In this paper,we use maps to visualize video data,providing user-friendly interaction to analyze video content.The system provides a special way of viewing video information.In addition,to the best of our knowledge,our work is the first to use map metaphor to visualize video data while integrating user cognition.
3 Multi-scale structure design
3.1 Cognition-based video representation
The mismatch of computing ability of machines and humans leads to inefficient processing,leading for example to the fundamental scientific question“can computersprocessand understand video content to the same extent as human beings?”By expanding in-depth understanding and knowledge in related subject areas,including human computer interaction,cognitive modeling,visual analysis, and computational perception,we provide a multiscale representation of video content based on the cognition processes used by human beings.
The cognitive processes of the human brain have attracted much research attention from philosophers, psychologists,and computer scientists for a long time.Many studiesinto neurophysiology and neurology over the past decades have provided useful results and experimental data which can help the computer scientists to find computation models for cognitive processes that enhance the processing of information.Fu et al.[30]explore the cognitive mechanisms and computation models of visual media based on neurophysiology,cognitive psychology, and computationalmodeling,and propose a computationalcognition modelof perception,memory,and judgment(PMJ model) which correspondsto thecalculation processes of analysis,modeling,and decision-making.We use the PMJ model.People usually deal with presentation in a hierarchicalway atdifferent levels of abstraction [26].Cognition consists of a series ofcomplex processes, with multiple processing pathways between the various stages of cognition[30]. The cognitive system chooses pathways depending on the difficulty and the goal of the information processing task[30,31].During the process of understanding video content,we consider three levels of video content representation:fast recognition,pattern understanding,and association deduction.
When people watch video,the human visual system can detect and quickly respond to visual stimuli.The brain extracts obvious visual features and identifies basic content such as objects,people, actions,etc.,relying on the special“feature map”in the human brain.This process corresponds to the“fast process”(1○+8○)of the PMJ model(Fig.2(a)). We define the process as“fast recognition”,and the content extracted from videos in this process as“basic entities”.The content is then kept in shortterm memory before proceeding to the next step.
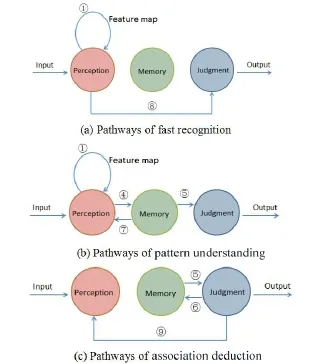
Fig.2 Pathways for different levels of a perception,memory,and judgment model.
Whilewatching videos,somecontentwhich appearsfrequently orisconnected to existing knowledgewehavealready learned resultsin strong stimuli which causes this content to be kept in long-term memory.At the same time,the brain reprocesses the information to understand the patterns linking basic entities,such as who is doing what where.This process corresponds to the“meticulous process”(4○+5○ and 7○)of thePMJ model(Fig.2(b)).In thisprocess, the brain determines events and patterns linking the basic entities.We call this process“pattern understanding”,and its output is“pattern structure information”.
As the video continues,we get more information and understand the development of the entire video and relation between sub-events.This is the third process.For example,some videos show the development of the events in incorrect time sequence, while the above two processes can only understand independent parts of the whole event.The more information the brain obtains,the greater the chance it can determine the potential associations in the correct order of sub-events.Occasionally,the brain will modify some information in memory which is incorrect.This process corresponds to the“feedback process”(6○+5○or 9○)of the PMJ model(Fig.2(c)). We define this process as“association deduction”, and its output as“abstract semantics”.
From the three processes above,we conclude that cognition of video content is based on a multi-scale representation.We represent the video content as four layers,as shown in Fig.3.In particular this helps to address the mismatch of human effort,and the need to effectively navigate and reuse rich video data.
3.2 Multi-scale description for video content
We can segment video content into four layers,each of which represents different information scales.As Fig.3 shows,these information layers are correlated rather than independent. Usually,videos are segmented into scenes,clips,shots,and key frames based on visual features,rather than the semantics of video content. Here,we combine this usual segmentation with our cognition analysis and define the multi-scale video content elements as follows:
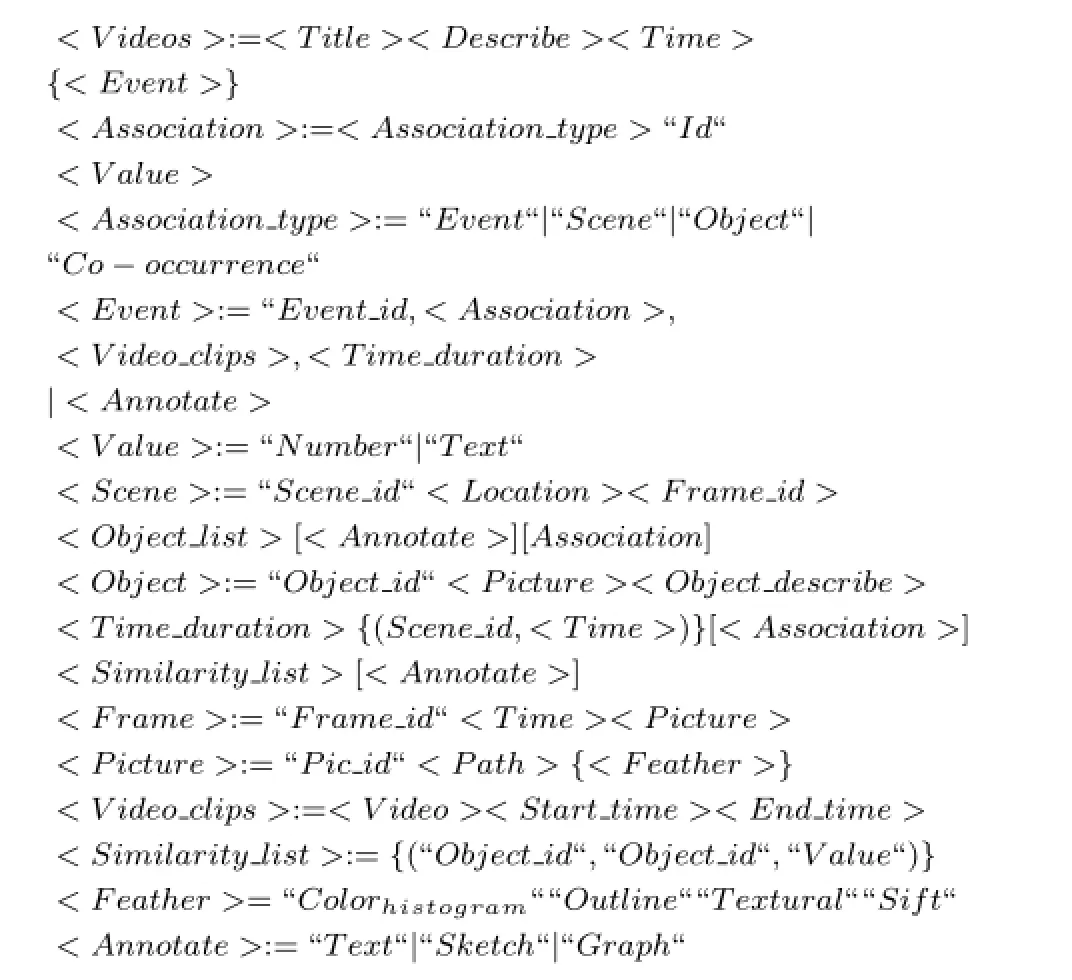
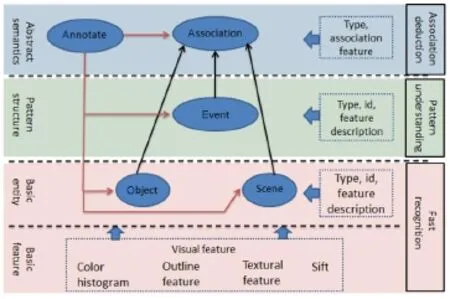
Fig.3 Representation of video content.
4 Visualization
4.1 Data preprocessing
The form of video data used in this visualization is a chronological list of events that happen in different scenes in which characters are involved. Those events can be separated into a series of video clips,where each clip represents a time span of the corresponding part of the video,depicting details of the event.We use the video data of the movie The Matrix to evaluate the methods.Our datasets were manually extracted from the movie and other publicly available information.
We define an event as a unit that consists of five parts:<Start time,End time,Characters involved, Scene,Summary>.Start time is when the event begins to happen.End time refers when the event is completed.Characters involved are those characters appearing in the event.Scene corresponds to those main video shots in which the event happened.We cluster scenes into classes,and allocate a color to each kind of scene.Scenes located in different spots may be the same scene if they share the same color, but if one scene block only contains one event dot, it does not mean that only one event happened–it is just a representation.Summary relates what happens in the event using words extracted from the movie.Each event represents a time slot in the data where its members interact.We denote the data as a set of events E={e1,···,en},where for 1<k<n we have a corresponding start time stk,end time etk,involved characters Ck={ci,···,cm},scene Skrepresenting the scene in which the event happens, and a summary of a few words describe the event's content.
Based on the design principles previously discussed,dots with numbers represent events. We set up a map with width w and height h,and give all event dots a random initial coordinate, then use a layout algorithm to get their final positions.Afterwards,we place them on the map by using a method based on Ref.[29],to generate blockssurroundingeventsrepresentingSk.We put character dots around event dots according to Ck,to show which characters are involved in the event.We use lines to connect the same character when involved in different events according to their occurence in stk,etk,Ck;we also use lines to connect events to represent characters transferring between them.Thus,the more characters involved,the thicker the lines are(Fig.4).
4.2 Algorithm overview
Before giving the layout algorithm,the clustering algorithm used to classify the scenes is introduced. We use the RGB color matrix of images as their characteristic value and the K-means method to cluster data,as follows:
1)To extract key frames from the video,the number of key frames is set in accordance with the lengths of the scenes.
2) We choose the first key frame and use its RGB color matrix as the centroid matrix.They are R1,G1,B1of size w×h,where w,h are the width and height of the keyframe respectively.

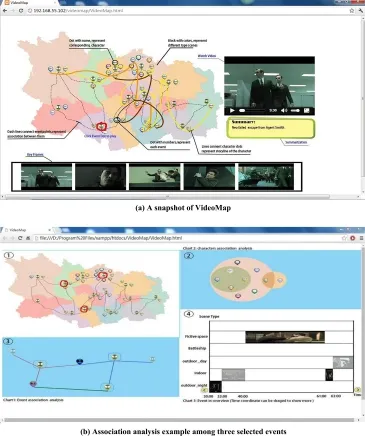
Fig.4 Top:exploring video content using VideoMap to navigate video content of interest,e.g.,an event is selected,the corresponding video clip is played,and related key frames are represented.Bottom: statistical information is provided for three selected events allowing the user to understand and explore video content.View 1 shows the operating interface.View 2 presents characters involved in the events.View 3 presents relationships with other events.View 4 shows keyframes belonging to different events in different scenes.
3) We choose another key frame.The distance D between this frame and the first key frame is calculated:
We compare the distance matrix D with a preset threshold matrix T that also has size w×h,and we compute the variation c:

where

If c<wh/2,we put the second frame and first frame into the same class,then a new centroid matrix,which is the average RGB color matrix of all key frames,is calculated. Otherwise,we take the second frame as a new class.The RGB color matrix of the second key frame is used as the centroid matrix of the new class. When processing the next key frame,we compare it with the centroid matrixes of each class,and assign it into the closest,or assign it to a new class.
4)Finally,the scene is assigned to the class to which its key frames belong.Scenes are shown in different colors according to their type in the map.
Our layout algorithm is based on a genetic algorithm after expressing the layout problem in termsoffunction optimization.Design ofthe objective function to produce a layout in line with our expectations is the key issue.We thus next introduce the design principles of the objective function.
To follow aestheticprinciples,and to make effective use of space,the objective function should satisfy the following conditions:(a)vertices should cover each other and edges should be crossed as infrequently as possible,and(b)the distance between two points should be proportional to the weight on the edge joining them.
The final objective function is thus:

where E is the total number of edges,N is the total number of vertices,Cross(ei,ej)returns 1 if edge ejintersects ejand 0 otherwise,wijis the weight of the edge between points pi(xi,yi)and pj(xj,yj),x∈(0,w),y∈(0,h).The value of wijmeans the correlation between character points piand pjwhich depends on the time they spend together.The longer the time is,the larger wijis.If there is no edge between two points then the weight is given a large value.k is a proportionality coefficient manually.|pi−pj|is the distance between two points on the map.Minimizing(kwij−|pi−pj|)2causes the distance between piand pjto be proportional to the weight.The first term ensures that condition(a) is satisfied;the second term enforces condition(b). The layout problem is thus turned into a search for the minimum value of Eq.(1).
A geneticalgorithm (GA)isused tosolve this problem.First,for every possible solution p1(x1,y1),···,pn(xn,yn)for Eq.(1),we use a real number string(x1,y1,···,xn,yn)to represent a chromosome.n is the number ofpoints. We randomly generate initial population of 15 chromosomes.Because we wish to minimise Eq.(1) while a GA maximisesfitness,we choose a constant number G which is greater than maximum value of Eq.(1),then set the fitness function F(x1,y1,···,xn,yn)=G−f.We use single point crossover and set the crossover probability Pm= 0.8.The roulette selection strategy is used.The probability of being selected for crossover depends on the value ofthe fitnessfunction ofeach chromosome.For mutation,we use the following non-uniform mutation operator:Set the father to A=(x1,y1,···,xn,yn)and mutate the k-th gene. Assuming that gene k is an x coordinate in[w,h], the new chromosome after mutation is

where

where rand(2)is a random function which returns 0 or 1 with equal probability.mut(t,x)=x(1−t/T)3; t is the current generation number,and T is the maximum evolution generation number.mut lies in [0,x]and when t is close to T,mut is close to 0.Early in evolution,the mutation operator searches within a larger range;later,the mutation operator leads to fine-tuning.The algorithm terminates either after a maximum number of generations,or a satisfactory fitness level has been reached for the population, giving the final layout.
Figure 4 shows a typical VideoMap interface. We obtained the relative positions of each event
using our layout algorithm.Event dots are numbered by time sequence.Each event dot was taken as a center,and a random curve was generated around it as a block. The layout events are represented in temporal sequence in such a way as to reduce crossing intersections.The size of each block is proportional to the scene's duration.Clusters based on similarity are represented by different blocks with different or similar colors.Different types of lines represent different associations.
4.3 Visual form for association
A lengthy video such as a movie contains much video data.It is tedious to discover the relationships between characters,scenes,and events.VideoMap offers an intuitive overview of video content which supports analysis of the relationship in video data, helping users understand the content of video more easily and quickly.VideoMap's elements mainly comprise dots,lines,and blocks,which correspond to the sites,roads,and regions in a geographical map respectively,as shown in Fig.4(a).Blocks represent different kinds of scenes in which events happened. We number event dots in time order.Lines represent temporal correlations between character dots in the VideoMap.We arrange the event dots on the map using our layout algorithm(see Section 4.2),then spread the character dots around corresponding event points to represent those characters involved in the event.We use blocks surrounding the event dots to indicate the events that happen in this scene.
Association analysis on VideoMap helps overcome the limited processing capacity of the human brain when faced with complex video data.For instance,in Fig.4(b),VideoMap provides various statistics,for example,how many shared characters they contain (Fig.4(b)View 2),the associations which are not included in the selected events(Fig.4(b)View 3), and the keyframes in the selected events(Fig.4(b) View 4).
Association analysisisusefulfordiscovering interesting relationships hidden in the VideoMap. Following preprocessing and multi-scale data representation,uncovered relationships appear in the form of association paths.Such paths suggest that a relationship exists between the points selected on the map.For example,more than one path may exist connecting two characters on the map such as Neo and Cypher.To find paths in VideoMap:
1)Select two objects in the VideoMap(e.g.,two dots on map),(ei,cm)and(ej,cn).
2)Define the adjacency matrix E as follows:
If cmin both caand cbcorresponds to eaand eb, then E(a,b)=1 (a<b);
if cnin both caand cbcorresponds to eaand eb, then E(a,b)=1 (a<b);
otherwise E(a,b)=0.
3)Given G with vertices {e1,e2,···} and adjacency matrix E,use DFS(depth first search) or BFS(breadth first search)to find all paths from source eito destination ej.
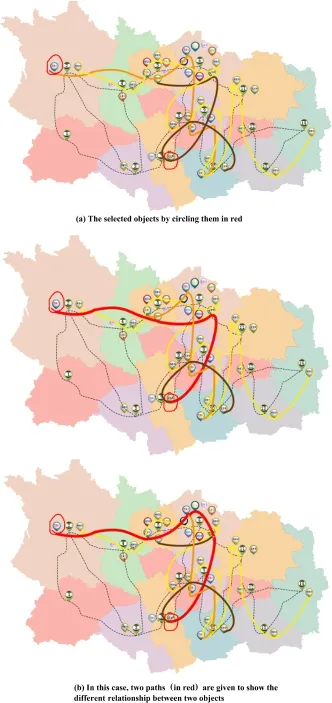
Fig.5 Pathfinding in VideoMap.
Figure5 showsthepathfinding supportin
VideoMap.On one hand,when the user picks two character dots,for example,character A in event M and character B in event N,it is just like choosing start and end points on a real map.It returns several accessible paths to show the different possible associations between the selected characters.On the other hand,however,when the user picks more than one event dot,various hidden statistical information is provided in visual analytics form(as shown in Fig.4(b)).Other functions further support video content exploring,allowing the user to choose some specific event or character dots.VideoMap only displays related elements corresponding to what has been chosen.You can play specific video content by clicking the corresponding event point.Meanwhile it also gives a brief summary of this event to help the user to see the details.When the user chooses a character point,the association with other characters is displayed.All these functions provide users with association analysis,helping them better understand video content.Sketch-based annotation is also supported in VideoMap,which helps users to write down their ideas conveniently,facilitating later operations.
4.4 Sketch interaction
4.4.1 Interactivity through expressive gestures
The sketch-based interface providesa tradeoff between expressiveness and naturalness during interaction with the map.It allows users to draw editable sketches freely on the map to facilitate exploration and visual analysis of video contents. The interface to VideoMap provides sketch gestures (Figs.6 and 7)and allows annotation.VideoMap recognizessketched gesturesand automatically completes different operations on the map,such as zooming,panning,or other methods of association analysis.
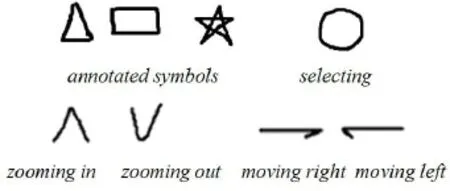
Fig.6 Sketch gestures used in VideoMap.
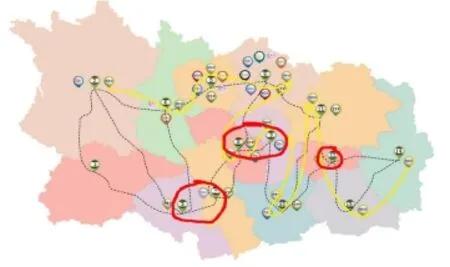
Fig.7 Selection operation on the VideoMap.
4.4.2 Freeform annotation
Annotations can provide valuable semantic information for understanding video content. VideoMap supports freeform annotation anywhere on the map as it is useful for explanation and emphasis.Manualannotationsare particularly useful for allowing users to create personalized annotations of videos.For example,users can write down their analysis or thoughts to add new associations between objects(Fig.8).During later retrieval to find paths,the new association can be obtained. Users may draw sketches to annotate video,using symbols and hand-drawn illustrations with freeform strokes,enriching and extending the
video content.These sketches are organized into the data structure to develop a narrative description and can be used to facilitate indexing or retrieval later.
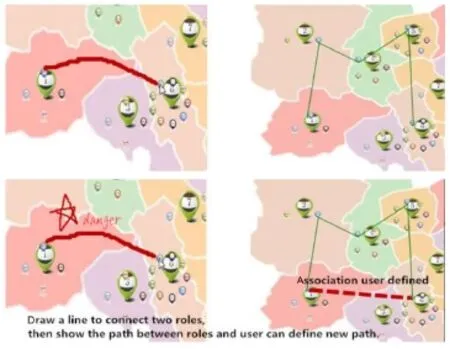
Fig.8 Defining and adding an association in VideoMap by free annotation.Top:drawing a line connecting two objects gets the existing paths between them.Bottom:inputing freeform annotation creates an association and a new path(dashed line)is generated.The path representing the new association can be obtained during later pathfinding processes.
5 Implementation
The system architecture is depicted in Fig.9, which shows the main modules which implement the interface.There are four main modules in the system,concerned with data pre-processing, layout generation,video to map projection,and interaction.The system is implemented in d3.js. The data pre-processing module is responsible for keyframe and scene clustering,event selection,and video segmentation according to events.Data preprocessing puts the data into the required form.The data is then used to generate the layout of events, mapping video elements to map elements according to rules. Map elements and layout information generate the framework of the VideoMap,allowing interactive functions to operate on the relevant dataset.The interaction module offersseveral interactive functions,such as circling two character dots to find their connection and customized display of specific information.These functions permit visualization of video content and facilitate the users' understanding and browsing. Users can provide visual feedback to,e.g.,correct the definitions ofeventsorchange the associationsbetween characters.Users also can customize associations, add them as required,and annotate details to things they are interested in.
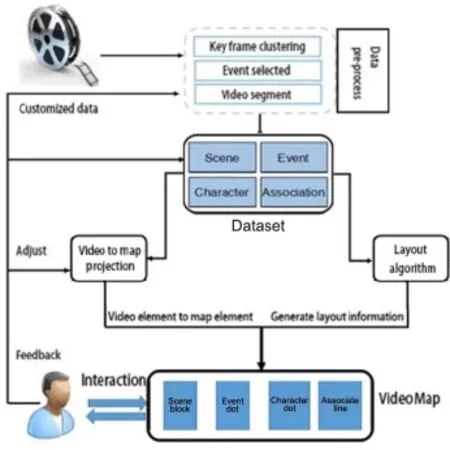
Fig.9 System architecture.
6 Evaluation
VideoMap aims to serve as an efficient and intuitive tool for exploring video content.It has been tested in devices with diverse display sizes,including a tabletop (see Fig.10(a)),and a Fujitsu tablet PC(see Fig.10(b)).We conducted a study to evaluate VideoMap,which demonstrated how the system can facilitate exploration of video content and significantly reduce browsing time needed to understand and find events of interest.Firstly,we compared VideoMap to two state-of-the-art video visualization and interaction methods:Storyline[22] and the Sketch Graph method[24].
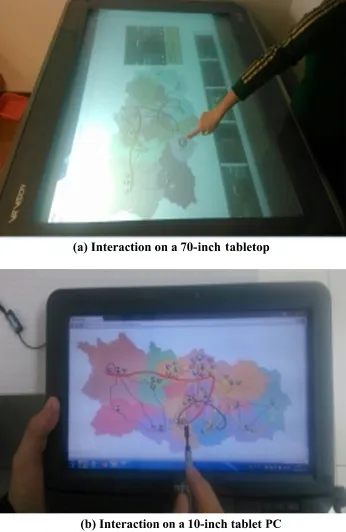
Fig.10 Instances of VideoMap on interactive devices.
Participants.Eighteen participantsfrom a
university were recruited,including 10 females and 8 males,with ages ranginge from 20 to 35.They were divided into three groups of equal size.
Methods.Visualization of The Matrix movie using Storyline,Sketch Graph,and VideoMap,was presented to the participants(see Fig.11).Each of the three groups was required to carry out the tasks below using one of the three methods:
Task 1:Find events in which Neo was involved.
Task 2:Find events in which Neo and Morpheus were involved.
Task 3: Find and describe the relationship between Trinity,who helped Neo back to reality, and Cyber,who colluded with Smith.
To ensure consistent evaluation,all the tasks were performed on Fujitsu Limited LIFEBOOK T Series (Intel Core i3 U380 1.33GHZ)running Windows 7 (see Fig.10(b)).Half an hour's training in using the three methods was taken with a tutorial before the test.At the end of experiment,the participants were required to complete the questionnaire in Table 1.
Results and discussion.We recorded the total time participants used to complete the tasks.The time spent completing Tasks 1,2,and 3 for the three groups using three different methods are summarized in Fig.12.It can be seen that the VideoMap method required the least time.A one-way ANOVA test showed that the main effect of the different methods is significant(F(2,15)=11.086,p<0.01).There was also a significant difference between VideoMap (M=22.5 min,SD=5.2)and Storyline(M= 36.7 min,SD=7.6)(p<0.05). Results of the questionnaire are summarized below:
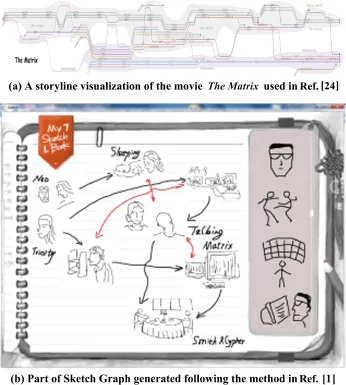
Fig.11 Storyline and Sketch Graph used in the experiment.
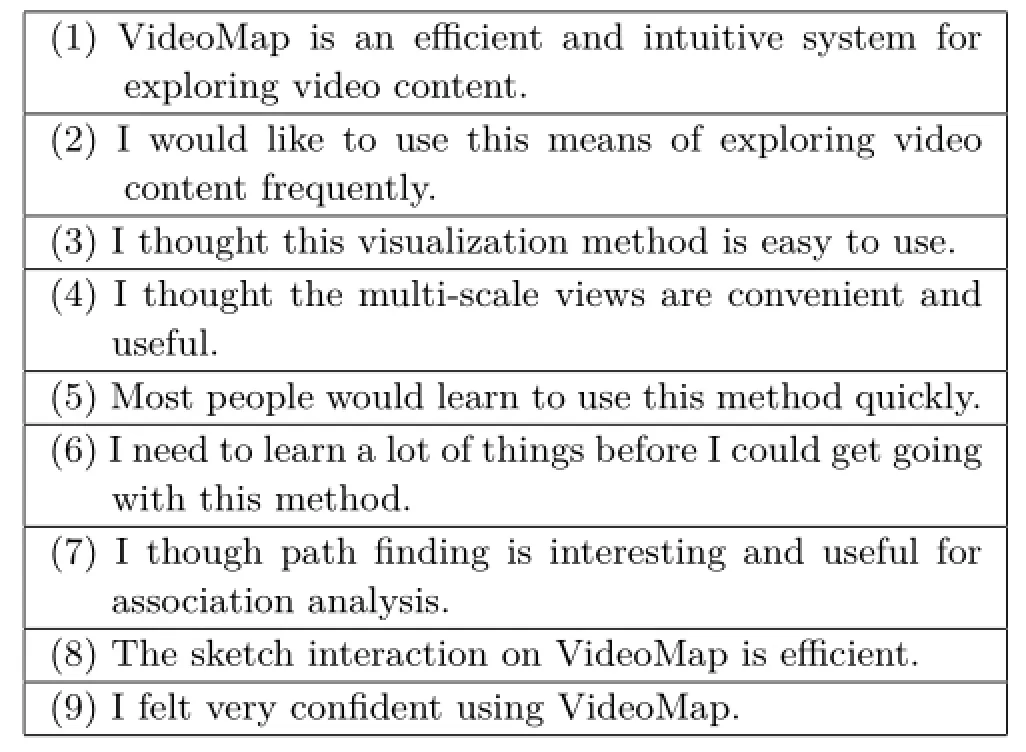
Table 1 Questionnaire.Each question was answered on a scale 1–5, as follows:1.strongly disagree,2.disagree,3.neutral,4.agree,5. strongly agree
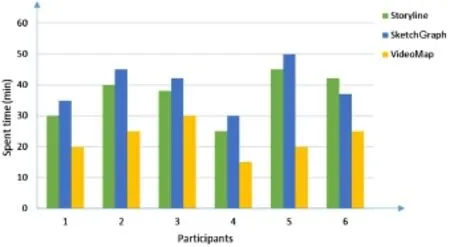
Fig.12 Implementation time of tasks using three methods.
•94%of participants(17/18)gave positive feedback about VideoMap.
•83%of participants(15/18)thought the multiscaleviewsin VideoMap areuseful,and a convenient method for exploring video content and finding interesting goals.
•89% of participants (16/18) thought the pathfinding in VideoMap isinteresting and useful for facilitating association analysis and understanding video content.
•83%of participants(15/18)gave positive feedback about the sketch interaction in VideoMap.
We also asked participants for their feedback on how well our design meets their expectations when exploring the video content. For example,
during Task 2,in Storyline,participantshad to follow thetwo linesrepresenting Neo and Morpheus.In VideoMap,participants can select Neo or Morpheus in any scene in which they appear, and the related events and association lines are highlighted.Afterwards,participants could inspect the results and play a clip that provided more detailed understanding of the content.VideoMap helps participants locate the region of interest.In Storyline and Sketch Graph,participants did not think it is easy to find these associations. They indicated that because of the many lines and detailed information,VideoMap is slightly difficult at first. However,after 30 minutes of experience with the system,the participants found it useful.They felt the process of understanding and exploring video content using VideoMap is similar to a treasurehunting process,indicating that understanding the associations between characters or scenes by finding paths on VideoMap is an interesting experience. Some particular comments by participants included:“VideoMap gave me an unprecedented feeling of efficient access to video...”,“I'm extremely satisfied with this way of viewing video...”.
VideoMap still has some limitations.The multiscale data description is critical to the performance of VideoMap.Currently the proposed multi-scale environment only supports three levels of video content description.It is difficult to achieve a precise understanding and description of complicated video semantics.Fully automated video analysis methods are difficult to achieve.The tradeoff between human cognition,computer-supported visualization,and interaction tools is important to consider when detecting events of interest.Current events represent time sequences by numbering which is not very intuitive,although it also helped users explore video content in the study. Future work will consider optimization of event visualization.
7 Conclusions
In this paper,we presented VideoMap,which can help users explore a video and find targets in an intuitive and efficient way.VideoMap extracts meaningful information from a video and conveys the extracted information to users in the form of a visual map.Association analysis by visualizing connections within a video is not intended to fully provide automatic solutions to the problem of making decisions about the contents of a video,but aims to assist users in their intelligent reasoning while reducing the burden of viewing videos.Automated video analysismethods are notfully reliable particularly when the search criteria are subjective or vaguely defined.VideoMap addresses this problem, and offers a solution to issues related to the limited processing capacity of the human brain in the face of enormous video data requirements.Operations in VideoMap are based on sketch gestures.A user study showed that VideoMap offers a promising tool for helping users to efficiently explore video content with an intuitive and natural interaction.In our future work,we intend to improve the multi-scale data description based on human cognition,and to optimize the layout algorithm.More advanced analysis methods of exploring video content are potentially possible through data descriptions and freeform sketch interaction.
Acknowledgements
This work was supported by the National Natural Science Foundation of China (Project Nos. U1435220,61232013).
[1]Mashima,D.;Kobourov,S.;Hu,Y.Visualizing dynamic data with maps.IEEE Transactions on Visualization and Computer Graphics Vol.18,No.9, 1424–1437,2012.
[2]Gansner,E.R.;Hu,Y.;North,S.Visualizing streaming text data with dynamic graphs and maps. In:Lecture Notes in Computer Science,Vol.7704. Didimo,W.;Patrignani,M.Eds.Springer Berlin Heidelberg,439–450,2013.
[3]Information on https://ia.net/know-how/iatrendmap-2007v2.
[4]Fels, S.; Mase, K.Interactive video cubism. In: Proceedings of the 1999 Workshop on New Paradigms in Information Visualization and Manipulation in Conjunction with the 8th ACM International Conference on Information and Knowledge Management,78–82,1999.
[5]Daniel,G.; Chen,M.Video visualization.In: Proceedings of IEEE Visualization,409–416,2003.
[6]Yeung,M.M.;Yeo,B.-L.Video visualization for compact presentation and fast browsing of pictorial content.IEEE Transactions on Circuits and Systems for Video Technology Vol.7,No.5,771–785,1997.
[7]Taniguchi,Y.;Akutsu,A.;Tonomura,Y.Panorama Excerpts: Extracting and packing panoramas for video browsing.In:Proceedings of the 5th ACM International Conference on Multimedia,427–436, 1997.
[8]Hua,X.-S.;Li,S.;Zhang,H.-J.Video booklet. 2010.Available at http://dent.cecs.uci.edu/~papers/ icme05/defevent/papers/cr1126.pdf.
[9]Goldman,D.B.;Curless,B.;Salesin,D.;Seitz,S.M. Schematic storyboarding for video visualization and editing.ACM Transactions on Graphics Vol.25,No. 3,862–871,2006.
[10]Nguyen,C.;Niu,Y.;Liu,F.Video summagator:An interface for video summarization and navigation.In: Proceedings of the SIGCHI Conference on Human Factors in Computing Systems,647–650,2012.
[11]Shah, R.; Narayanan, P.J.Interactive video manipulation using objecttrajectoriesand scene backgrounds.IEEE Transactions on Circuits and Systems for Video Technology Vol.23,No.9,1565–1576,2013.
[12]Ma,C.-X.;Liu,Y.-J.;Wang,H.-A.;Teng,D.-X.; Dai,G.-Z.Sketch-based annotation and visualization in video authoring.IEEE Transactions on Multimedia Vol.14,No.4,1153–1165,2012.
[13]Truong,B.T.;Venkatesh,S.Video abstraction: A systematic review and classification. ACM Transactions on Multimedia Computing, Communications, and Applications Vol.3, No. 1,Article No.3,2007.
[14]Viaud,M.-l.;Buisson,O.;Saulnier,A.;Guenais,C. Video exploration:From multimedia content analysis to interactive visualization.In:Proceedings of the 18th ACM International Conference on Multimedia,1311–1314,2010.
[15]H¨oferlin,M.;H¨oferlin,B.;Weiskopf,D.Video visual analytics of tracked moving objects.2012.Available at http://www.vis.uni-stuttgart.de/uploads/tx vispublications/Hoeferlin2009b.pdf.
[16]Meghdadi,A.H.;Irani,P.Interactive exploration of surveillance video through action shot summarization and trajectory visualization.IEEE Transactions on Visualization and Computer Graphics Vol.19,No.12, 2119–2128,2013.
[17]Walton,S.;Berger,K.;Ebert,D.;Chen,M.Vehicle object retargeting from dynamic traffic videos for realtime visualisation.The Visual Computer Vol.30,No. 5,493–505,2014.
[18]H¨oferlin,B.;H¨oferlin,M.;Heidemann,G.;Weiskopf, D.Scalable video visualanalytics.Information Visualization Vol.14,No.1,10–26,2013.
[19]Caspi,Y.;Axelrod,A.;Matsushita,Y.;Gamliel,A. Dynamic stills and clip trailers.The Visual Computer Vol.22,No.9,642–652,2006.
[20]Correa,C.D.;Ma,K.-L.Dynamic video narratives. ACM Transactions on Graphics Vol.29,No.4,Article No.88,2010.
[21]Tang,A.;Greenberg,S.;Fels,S.Exploring video streams using slit-tear visualizations.In:Proceedings ofExtended Abstracts on Human Factors in Computing Systems,3509–3510,2009.
[22]Tanahashi,Y.;Ma,K.-L.Design considerations for optimizing storyline visualizations.IEEE Transactions on Visualization and Computer Graphics Vol.18,No. 12,2679–2688,2012.
[23]Li,F.C.;Gupta,A.;Sanocki,E.;He,L.-w.;Rui,Y. Browsing digital video.In:Proceedings of the SIGCHI Conference on Human Factors in Computing Systems, 169–176,2000.
[24]Liu,Y.-J.;Ma,C.-X.;Fu,Q.;Fu,X.;Qin,S.-F.;Xie,L.A sketch-based approach for interactive organization ofvideo clips.ACM Transactions on Multimedia Computing,Communications,and Applications Vol.11,No.1,Article No.2,2014.
[25]Jawaheer,G.;Weller,P.;Kostkova,P.Modeling user preferences in recommender systems:A classification framework for explicit and implicit user feedback. ACM Transactions on Interactive Intelligent Systems Vol.4,No.2,Article No.8,2014.
[26]Zhang,X.;Furnas,G.W.mCVEs:Using crossscale collaboration to support user interaction with multiscale structures.Presence Vol.14,No.1,31–46, 2005.
[27]McCarthy,J.F.;Meidel,E.S.ActiveMap: A visualization tool for location awareness to support informal interactions.In:Lecture Notes in Computer Science,Vol.1707.Gellersen,H.-W.Ed.Springer Berlin Heidelberg,158–170,2000.
[28]Nesbitt,K.V.Getting to more abstract places using the metro map metaphor.In: Proceedings of the 8th International Conference on Information Visualisation,488–493,2004.
[29]Gansner,E.R.;Hu,Y.;Kobourov,S.GMap: Visualizing graphs and clusters as maps. In: Proceedings of IEEE Pacific Visualization Symposium, 201–208,2010.
[30]Fu,X.L.;Cai,L.H.;Liu,Y.;Jia,J.;Chen,W.F.;Yi, Z.;Zhao,G.Z.;Liu,Y.J.;Wu,C.X.A computational cognition model of perception,memory,and judgment. Science China Information Sciences Vol.57,No.3,1–15,2014.
[31]Solway, A.; Botvinick, M. M. Goal-directed decision making as probabilistic inference: A computational framework and potential neural correlates.Psychological Review Vol.119,No.1, 120–154,2012.

Cui-Xia Ma received her Ph.D.degree from the Institute of Software,Chinese Academy of Sciences,Beijing,China,in 2003.She is now a professor with the Institute of Software,Chinese Academy of Sciences. Her research interests include human–computer interaction and multimedia computing.

Yang Guo started studying in the Institute of Software,Chinese Academy of Sciences,Beijing,China,in 2013.He is now pursuing a master degree in the Institute of Software,Chinese Academy of Sciences. His research interests include human–computer interaction and multimedia visualization.

Hong-An Wang received his Ph.D. degree from the Institute of Software, Chinese Academy of Sciences,Beijing, China,in 1999.He is now a professor with the Institute of Software,Chinese Academy of Sciences.His research interests include real-time intelligence and user interface.
Open Access The articles published in this journal are distributed under the terms of the Creative Commons Attribution 4.0 International License(http:// creativecommons.org/licenses/by/4.0/), which permits unrestricted use,distribution,and reproduction in any medium,provided you give appropriate credit to the original author(s)and the source,provide a link to the Creative Commons license,and indicate if changes were made.
Other papers from this open access journal are available free of charge from http://www.springer.com/journal/41095. To submit a manuscript,please go to https://www. editorialmanager.com/cvmj.
1StateKeyLab ofComputerScience,Instituteof Software,Chinese Academy of Sciences,Beijing 100190, China.E-mail:cuixia@iscas.ac.cn().
2School of Computer and Control Engineering,University of Chinese Academy of Sciences,Beijing 100080,China.
3BeijingKeyLabofHuman–ComputerInteraction, Institute of Software,Chinese Academy of Sciences, Beijing 100080,China.
Manuscript received:2016-02-02;accepted:2016-03-12
 Computational Visual Media2016年3期
- Computational Visual Media的其它文章
- Synthesis of a stroboscopic image from a hand-held camera sequence for a sports analysis
- Removingmixed noiseinlow ranktexturesbyconvex optimization
- Discriminative subgraphs for discovering family photos
- Parallelized deformable part models with effective hypothesis pruning
- Skeleton-based canonical forms for non-rigid 3D shape retrieval
- Analyzing surface sampling patterns using the localized pair correlation function
