Analyzing surface sampling patterns using the localized pair correlation function
Weize Quan,Jianwei Guo,Dong-Ming Yan(),Weiliang Meng,and Xiaopeng Zhang()
©The Author(s)2016.This article is published with open access at Springerlink.com
Analyzing surface sampling patterns using the localized pair correlation function
Weize Quan1,Jianwei Guo1,Dong-Ming Yan1(),Weiliang Meng1,and Xiaopeng Zhang1()
©The Author(s)2016.This article is published with open access at Springerlink.com
DOI 10.1007/s41095-016-0050-8 Vol.2,No.3,September 2016,219–230
Point distributions with different characteristics have a crucial influence on graphics applications. Various analysis tools have been developed in recent years,mainly for blue noise sampling in Euclidean domains.In this paper,we present a new method to analyze the properties of general sampling patterns that are distributed on mesh surfaces.The core idea is to generalize to surfaces the pair correlation function(PCF)which has successfully been employed in sampling pattern analysis and synthesis in 2D and 3D.Experimental resultsdemonstrate thatthe proposed approach can reveal correlations of point sets generated by a wide range of sampling algorithms.An acceleration technique is also suggested to improve the performance of the PCF.
point distribution;spectral analysis;pair correlation function(PCF);mesh surface
1 Introduction
Sampling isa fundamentalresearch topicin computer graphics,with a variety of applications. Sampled point sets with specific properties are often suitable for specific applications.For example,the well-known blue noise sampling is usually used in non-photorealistic rendering[1],stippling[2],and object distribution[3],while white noise sampling is preferred in random number generators[4],and pink noise is used for physical simulation and biological distributions[5].
Several analysis tools have been proposed toevaluate sampling properties.Some tools are performed in the spatial domain;an example is the relative radius[6],which is the normalized minimum spacing between pairs of samples.Another important tool is spectral evaluation,either via power spectrum analysis as determined by Fourier transform[6–8]or via differential domain analysis (DDA)[9].As these tools are limited to blue noise sampling,they cannot characterize distributions with complex sample patterns,including those that exist in many natural phenomena.Recently, ¨Oztireli and Gross[10]proposed the use of the pair correlation function(PCF)for general analysis in 2D or 3D Euclidean spaces.However,the application of this approach to surface sampling has not been previously considered.
In this paper,we present a new method for analyzing surface sampling patterns using the PCF. The proposed approach is an extension of the original approach presented in Ref.[10].The main contributions of this work include the following:
•A new approach to measure sampling properties on surfaces.
•Instead ofutiziling globalPCF,the PCF method[10]is accelerated by use of a localized version based on the smoothness of the Gaussian function.
•A complete comparison of recent(blue noise) sampling techniques on surfaces is given.
2 Related work
Ourwork isrelated to surfacesampling and pattern analysis.This section briefly reviews recent approaches in these two areas.
2.1 Sampling
In probability theory,point processes are well-
studied,and they provide powerful modeling and analysis tools for spatial data.Point processes have been extensively investigated in many disciplines, such asastronomy,chemistry,geography,and physics.A point process is a type of random process, and a particular sample set can be regarded as a realization of such a process,e.g.,Poisson sampling is a realization of a Poisson process.The PCF or radial distribution function,which is a measure of the probability of finding a point at a specific distance from a given reference point,is sufficient to describe the diverse properties of a point distribution from the statistical perspective,and this measure has been used to define new analysis tools for general sampling in computer graphics[10].
Although sampling has been extensively studied in computergraphics[1,11–13],thefocusis generally directed toward bluenoisesampling; blue noise is a type of noise with minimal low frequency components and no concentrated spikes in energy.Blue noise sampling tends to generate sample patterns in which the points are randomly distributed at a minimum distance from one another. In this section,we only discuss a number of surface sampling algorithms.Extensive surveys of blue noise sampling techniques were presented by Lagae and Dutr´e[6]and Yan et al.[14].The classic dart-throwing algorithm was first generalized to mesh surfaces by Cline et al.[15].Yan and Wonka[16]recently presented maximal Poissondisk sampling(MPS)on surfaces based on empty region analysis.Guo et al.[17]then improved the sampling quality and efficiency of MPS by using a hierarchical subdivision based approach. Iterative relaxation is another important technique for generating high-quality point distributions.Xu et al.[18]generalized the CCVT(capacity constrained Voronoi tessellation)[19]to surfaces with potential regularity artifacts.Chen et al.[20]combined thecentroidalVoronoitessellation (CVT)[21] and CCVT for surface blue noise sampling;such combination can significantly reduce regularity artifacts by introducing the CapCVT(capacityconstrained CVT)energy. Zhangetal.[22] generalized the optimal transport based blue noise sampling approach[23]to mesh surfaces.Farthest point sampling based on geodesic distance was demonstrated in Ref.[24].In Ref.[25],the quality of blue noise sampling was further improved by extending farthest point optimization(FPO)[11,26] to surfaces.
2.2 Sampling pattern analysis
Spatialstatistics provide measuresto analyze the spatialdistribution properties ofsamples. Shirley[27]introduced discrepancy as a measure of the quality of samples,with a small discrepancy value indicating almost equidistributed sample sets and a large discrepancy value indicating poorly distributed samples.Liu etal.[24]defined a measure related to the coefficientofvariation which can stably analyze different point patterns on triangulated two-manifold meshes,using the Voronoi diagram computed from geodesic distances. Another prevalent statistic is the relative radius, i.e.,thenormalizedminimum spacingbetween pairs of samples[6];it has been used to analyze the spatial uniformity of Poisson-disk distributions. However,this measure is only applicable in a uniform Euclidean domain.Thus,Wei and Wang[9]further extended this measure to non-uniform domains. Starting from the perspective of point processes, ¨Oztireli and Gross[10]defined a new analysis tool based on the PCF which measures the probability of finding a point at a specific distance from a given point. They demonstrated that the PCF can be employed to analyze and synthesize general point distributions. However,this approach is applicable only to Euclidean domain sampling.In the present work,we generalize this approach to uniform and adaptive surface sampling. Other spatial measures have often been used in recent meshing and re-meshing studies;these measures include consideration of triangle qualities,minimum triangle angles,histograms of triangle angles,and so on[16].
Spectral analysis is another standard evaluation method that can effectively detect sampling artifacts. Use of the power spectrum was introduced by Ulichney [7]to study dithering patternsand then used by Lagae and Dutr´e[6]to compare different Poisson-disk sampling methods.The power spectrum,radially averaged power spectrum, and anisotropy help to reveal point-to-point correlations.Schl¨omer and Deussen[8]investigated accuracy issues by computing the Fourier transform analytically.Heck et al.[28]emphasized the shape of the power spectrum and synthesized two new
types of blue noise patterns.Subr and Kautz[29] proposed analyzing the quality of samples in image synthesis by utilizing the amplitude and variance of the sampling spectrum.However,these approaches can handle only Euclidean domain sampling.Bowers et al.[30]was the first to propose a method for analyzing the spectral quality of surface samples,but this method can only be used for uniform sampling and analysis of a few hundred samples because of the limits of numerical computation.Recently,Wei and Wang[9]introduced DDA which extends standard Fourier analysis to non-uniform samples on surfaces. They replaced the cosine kernel in the definition of the Fourier power spectrum with a Gaussian kernel with the aid of so-called pairwise sample location differentials.
Our proposed method analyzes the sampling processes from the statistical perspective,whereas DDA uses a spectral perspective.Although DDA and PCF are mutually complementary,and can provide statisticaland spectralproperties ofsampling patterns,there are still some differences between them.For example,the irregularity of PCF can give the regularity degree of sampling,but DDA cannot measure this.Furthermore,the first peak of PCF has a physical meaning,namely,the average relative radius as defined in Ref.[6],which cannot be obtained from DDA directly.We will compare them in detail in Section 5.
3 Pair correlation function
This section briefly reviews the pair correlation function(PCF)as defined in the Euclidean domain. A localized version of PCF based on the smoothness of the Gaussian kernel is then proposed. This localized PCF is generalized to analyze adaptive sampling.
Definition:In contrast to traditional spectral analysis,the PCF is directly measured in terms of the distribution of spatial distances between points.Specifically,it describes the joint probability of points existing at specific locations and can thus reflect the uniformity and irregularity (or randomness)of a point distribution.
The PCF can be used in Euclidean spaces of arbitrary dimensions.Without loss of generality,we give its definition in a 2D case.Given a set of sample pointsand a sampling domain V,let d(xi,xj)be the Euclidean distance between points xiand xj,and|V|be the volume of the sampling domain.The estimator of the PCF is then defined as

The space where the discretization of(see Eq.(4))lives is called pair correlation space(PCS). PCS is rigid motion invariant because it only relies on the distribution of spatial distances between points. Different point sets can be mapped into the same space with the same discretization for r,and the properties of the point sets can be examined by analyzing the distribution of these discrete vectors (i.e.,the discretization ofwith respect to r). For a given radius r=rk,the estimator ofcan be obtained by calculating the mean of1,...,n).
In accordance with the observation that considerable regularity in point distributions leads to little variance in the PCS,the irregularity of a point distribution can be measured by the variance offor a given radius r=rk. Irregularity describes the irregularity degree of distribution of spatial distances in a point set.If points have almost the same neighbor point distributions,e.g., the point set of a regular grid,then the irregularity is small.By contrast,a random point set where each point has a different neighbor point distribution leads to large irregularity.
3.1 Localized PCF
The original approach[10]estimates the PCF using all pairwise distances of a point set;thus,its time complexity is O(N2),where N is the number of sample points.The time cost increases dramatically when the number of samples increases.This section proposes a localized version of PCF to improve its performance.
the Gaussian function introduces weighting into PCF analysis.The distance d(xi,xj)carries a large weight if it is close to r;otherwise,it carries a relatively low weight. Hence,a specific range of pairwise distances is used,i.e.,the weight of d(xi,xj),which is far from r,is set as zero. In practice,the kring neighborhood is employed to replace all pairwise distances.The time complexity of this improved version is O(MN),where M is the average number of points within the k-ring neighborhood of each sample point.In general,M is much smaller than N(N≫M). In most recent sampling approaches,point pairs over long distances tend to be uncorrelated; hence,localized PCF can sufficiently capture the characteristics of these sampling patterns.
To verify the validity of our new method,we compared global PCF with our localized version and present the result in Fig.1.We generated a set of 3000 uniformly sampled points with the FPO method[26]as an example.When k is small,the statistical pairwise distance information of one point is limited.Then,we can obtain the result of r with a limited range.Interestingly,we can also capture the main peak of the PCF when k=1.Along with the increase in k,the range of r widens.We numerically calculate the difference between localized PCF and global PCF in terms of square deviation.The results are 1.7680,0.1288,0.0355,0.030,and 0.015.When k≥6,the results are almost the same in both visual and numerical terms.
3.2 Adaptive sampling

In adaptive sampling analysis,defining a valid distance measure is an important issue.To generalize PCF analysis method to adaptive sampling,the warp method introduced in Ref.[9]is utilized to map the non-uniform domain to a uniform one. The sampling points carry a large weight in flat regions in the domain and a low weight in highlycurved regions.The transformation function given in Eq.(2)is employed to approximate the uniform distance between two samples.

where wiand wjare the weights of points piand pj, respectively.E(w)is the mean weight of all points. Furthermore,E(w)scales the pairwise distance but does not affect the shape of the PCF or irregularity.
Figure 2 shows an example of an analysis of 2D sampling patterns using the proposed approach.As shown,the uniform and adaptive cases share the same consistent appearance in terms of the PCF and irregularity except for the case of a small σ. The PCF is the probability density function of pairwise distances using kernel density estimation. The scale factor σ decides the local estimation neighborhood size and thus plays an important role in this estimator.However,this hyper-parameter is difficult to estimate and is usually obtained through experiment.In Fig.2,we compare the effects of different σ on the results.Small or large σ values lead to inaccurate estimation.Specifically,large σ indicates a Poisson sampling pattern,i.e.,the PCF is flat and equal to 1.

Fig.1 Analysis of PCF with different local neighborhood sizes.Left to right:k=1,3,5,6,10,global.We use the uniform FPO method[26]. The number of samples is 3000.σ=0.25.
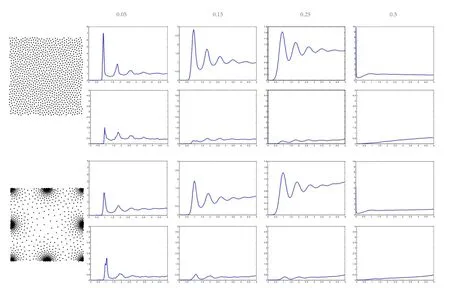
Fig.2 Analysis of 2D uniform(top)and adaptive(bottom)sampling.The sampling points are generated using the FPO method[26]shown in the first column.The number of samples is 1024,and the neighborhood size is k=10.We set σ=0.05,0.15,0.25,0.5 from left to right.
4 PCF on surfaces


where M is the local neighborhood size(i.e.,the number of points within the k-ring neighborhood of one sample point),|V|is the surface area of the model,and dijis the distance between points piand pj.Note that the concept of the PCF could be generalised to arbitrary manifolds with a metric. However,we will focus only on surfaces in this paper.

PCF essentially analyzes the distance distribution ofsampling points using the kerneldensity estimation method.Statistically,data distributions can be effectively characterized by the average and variance of the data.Therefore,we can reasonably regard the PCF as the average of the distance distribution,i.e.,

where

In practice,the discrete PCF is used by discretizing r,i.e.,r=(r1,···,rk)T.Therefore,g(r)and gi(r) can be discretized as follows:

In addition,irregularity can be captured by the variance of the distance distribution for each sampling point.The irregularity measure can be defined as

For normalization,this measure is divided by the irregularity of white noise sampling.

5 Experimental results
We present experimental results using different sampling patterns to verify the validity of the proposed method.All results shown in this work were obtained with a PC equipped with 2.83 GHz Q9550 Quad Core CPU,4 GB memory,and 64-bit Windows 7 operating system.
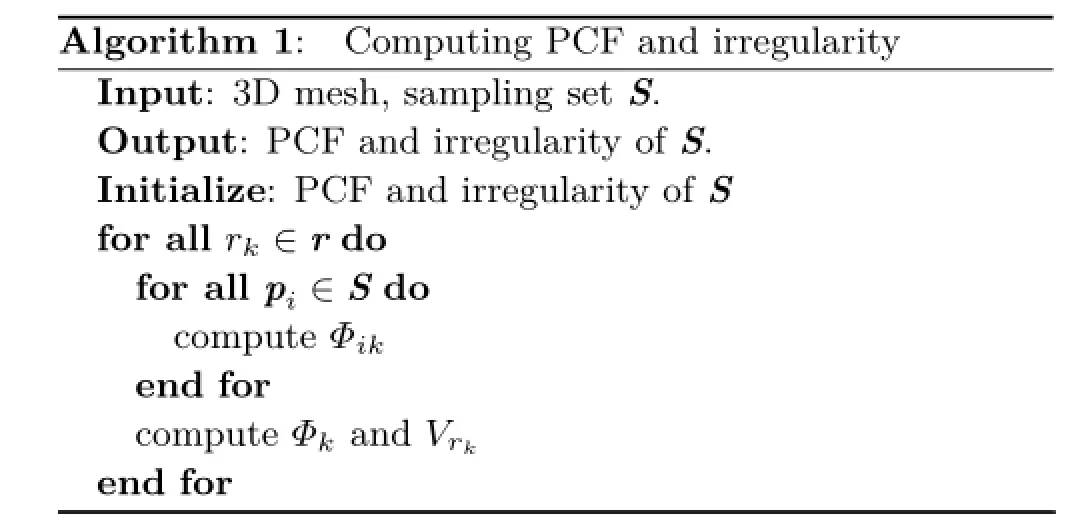
Algorithm 1:Computing PCF and irregularity Input:3D mesh,sampling set S. Output:PCF and irregularity of S. Initialize:PCF and irregularity of S for all rk∈r do for all pi∈S do compute Φikend for compute Φkand Vrkend for
Parameters: The most important parameter is the neighborhood size M of each point,which directly affectsthe speed and quality ofour algorithm.Neighborhood size is related to the numberofsampling points.In ourtests,we adapt k to match the neighborhood size. When thenumberofsamplesislarge,weincrease k accordingly to collect adequate neighborhood information.Furthermore,a large M does not change the shape of the PCF but affects the irregularity.In our experiments,we find that k∈[5,15]is generally effective.We set k=7 for our results unless explicitly specified.Given the range[r1,r2]of r values and σ value,the maximum neighborhood size in terms of pairwise distance is D=dmax(r2+µσ),whereµis the cutoff factor of the Gaussian function.Using this formulation,we can estimate a good k and qualify the reasonableness of a given k as well.
Another important parameter is the standard deviation σ of the Gaussian kernel,which affects the smoothness of the result.For uniform surface sampling,we find σ∈[0.04,0.08]to be effective,and we set σ=0.05.For adaptive surface sampling, we find σ∈[0.06,0.12]to be effective,and we set σ=0.08.The range of r should capture adequate information about the point distribution. In our tests,r∈[0.25,5],and a stride of 0.02 can obtain the tradeoff between smoothness and efficiency.
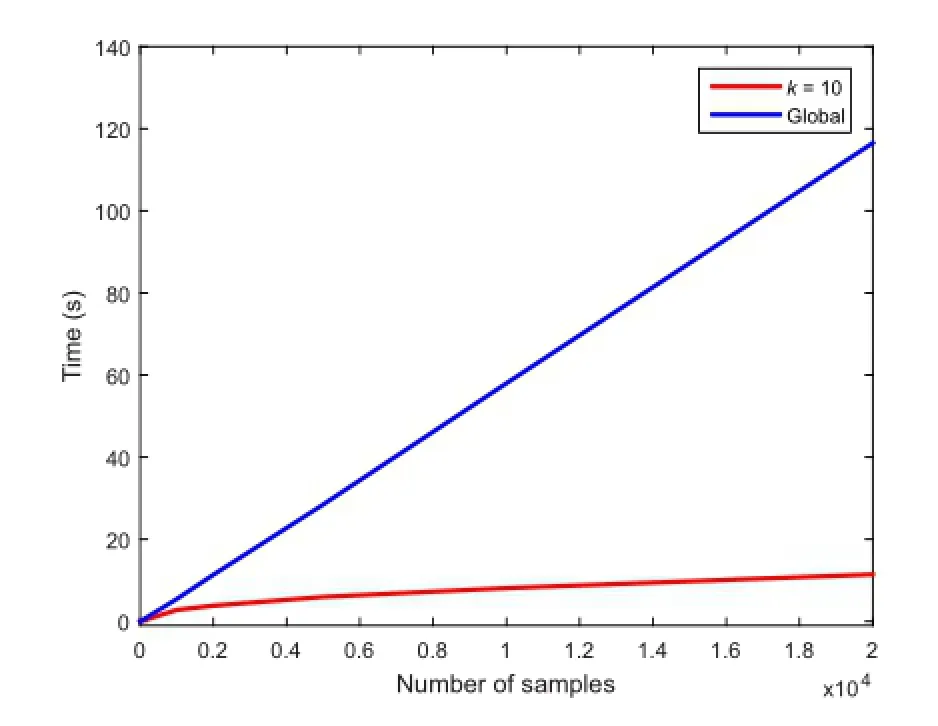
Fig.3 Comparison of running time of our local distance measure and the original one[10].Time is shown as the square root of the true time for clarity.Blue curve:original global method.Red curve: our localized method.We use the CCVT method[19]to generate samplings.The number of points for each site is 1024.σ=0.25.
Performance:Figure 3 compares the running time of the original PCF method and our localized version.We use an increasing number of points and test the running time in each case.Varying numbers
of sampling points were obtained with the CCVT method[19],and the number of points at each site is 1024.The localized PCF is significantly faster than global PCF.Specifically,the running time of global PCF is quadratic with respect to the number of sampling points,whereas that of the localized PCF is almost linear.
Sampling analysis:We applied our approach to analyze several sampling algorithms on surfaces, including CVT[21],CapCVT[20],MPS[16,17], and FPO[25].Poisson sampling is used for ground truth,where g(r)=1.We use two new measures in our analysis,i.e.,Ppeakand Ivalley,which are obtained from our PCF and irregularity analysis. The value of Ppeakindicates the specific distance at which most points are distributed with respect to their neighboring points.In other words,most points have a similar distribution at this specific distance.Thus,the irregularity is relatively small. Hence,Ppeakand Ivalleyare almost the same.We also observe that Ppeakis essentially equivalent to the average relative radius ρ defined in Ref.[6];however, this measure cannot be obtained from DDA directly. For example,Ppeakof FPO is close to 0.93,and Ppeakof MPS is approximately 0.81;these values agree well with the reported values in Ref.[26].Furthermore, these two measures are independent of the number of samples and the area of the sampling domain because we normalize the distance measure by dmax.Thus our approach has strong generalization ability.The results are shown in Fig.4,and the values of these measures are shown in Table 1.
For adaptive sampling (non-uniform density sampling),we transform the adaptive domain to a uniform case using the weight information defined at each point and directly apply the uniform analysis tools.To ensure the validity of the transformation function of Eq.(2),we apply our algorithm to the adaptive version of four sampling algorithms on surfaces(see Fig.5).Poisson sampling is employed for ground truth as well.The results are almost the same as the uniform results shown in Fig.4.
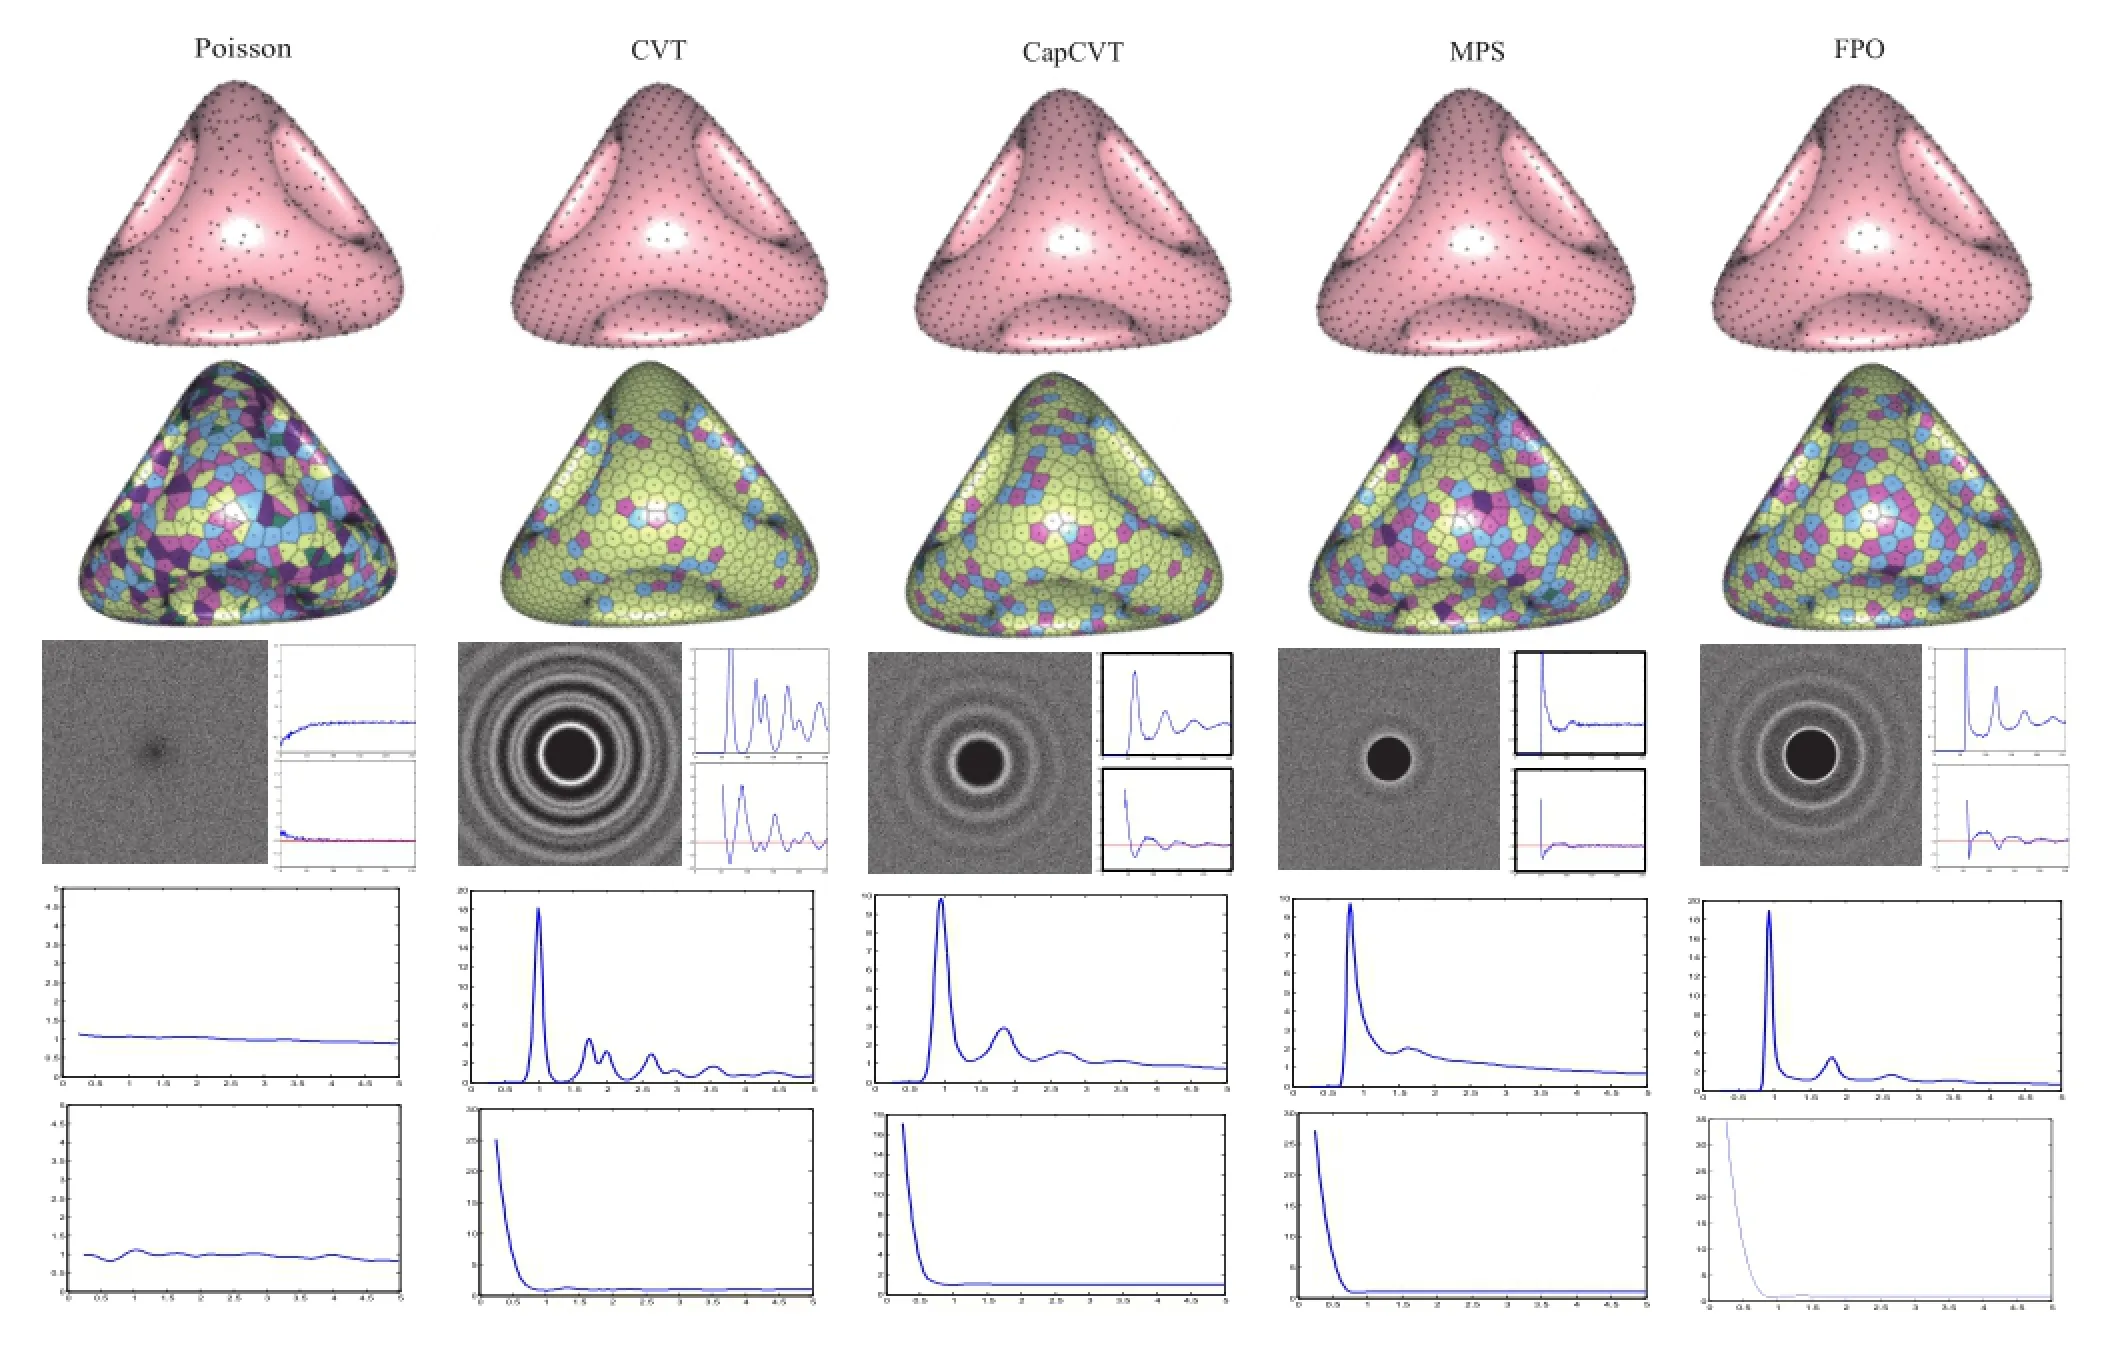
Fig.4 Analysis of different point distributions on a uniform domain.Top to bottom:surface sampling results;Voronoi cells(color-coded by valence:light yellow has valence 6,pink 5,blue 7,dark pink>7,and dark green<5);DDA analysis[9],including power spectrum,radial mean,and anisotropy;our PCF results;and our irregularity measure.We set σ=0.05,k=7.
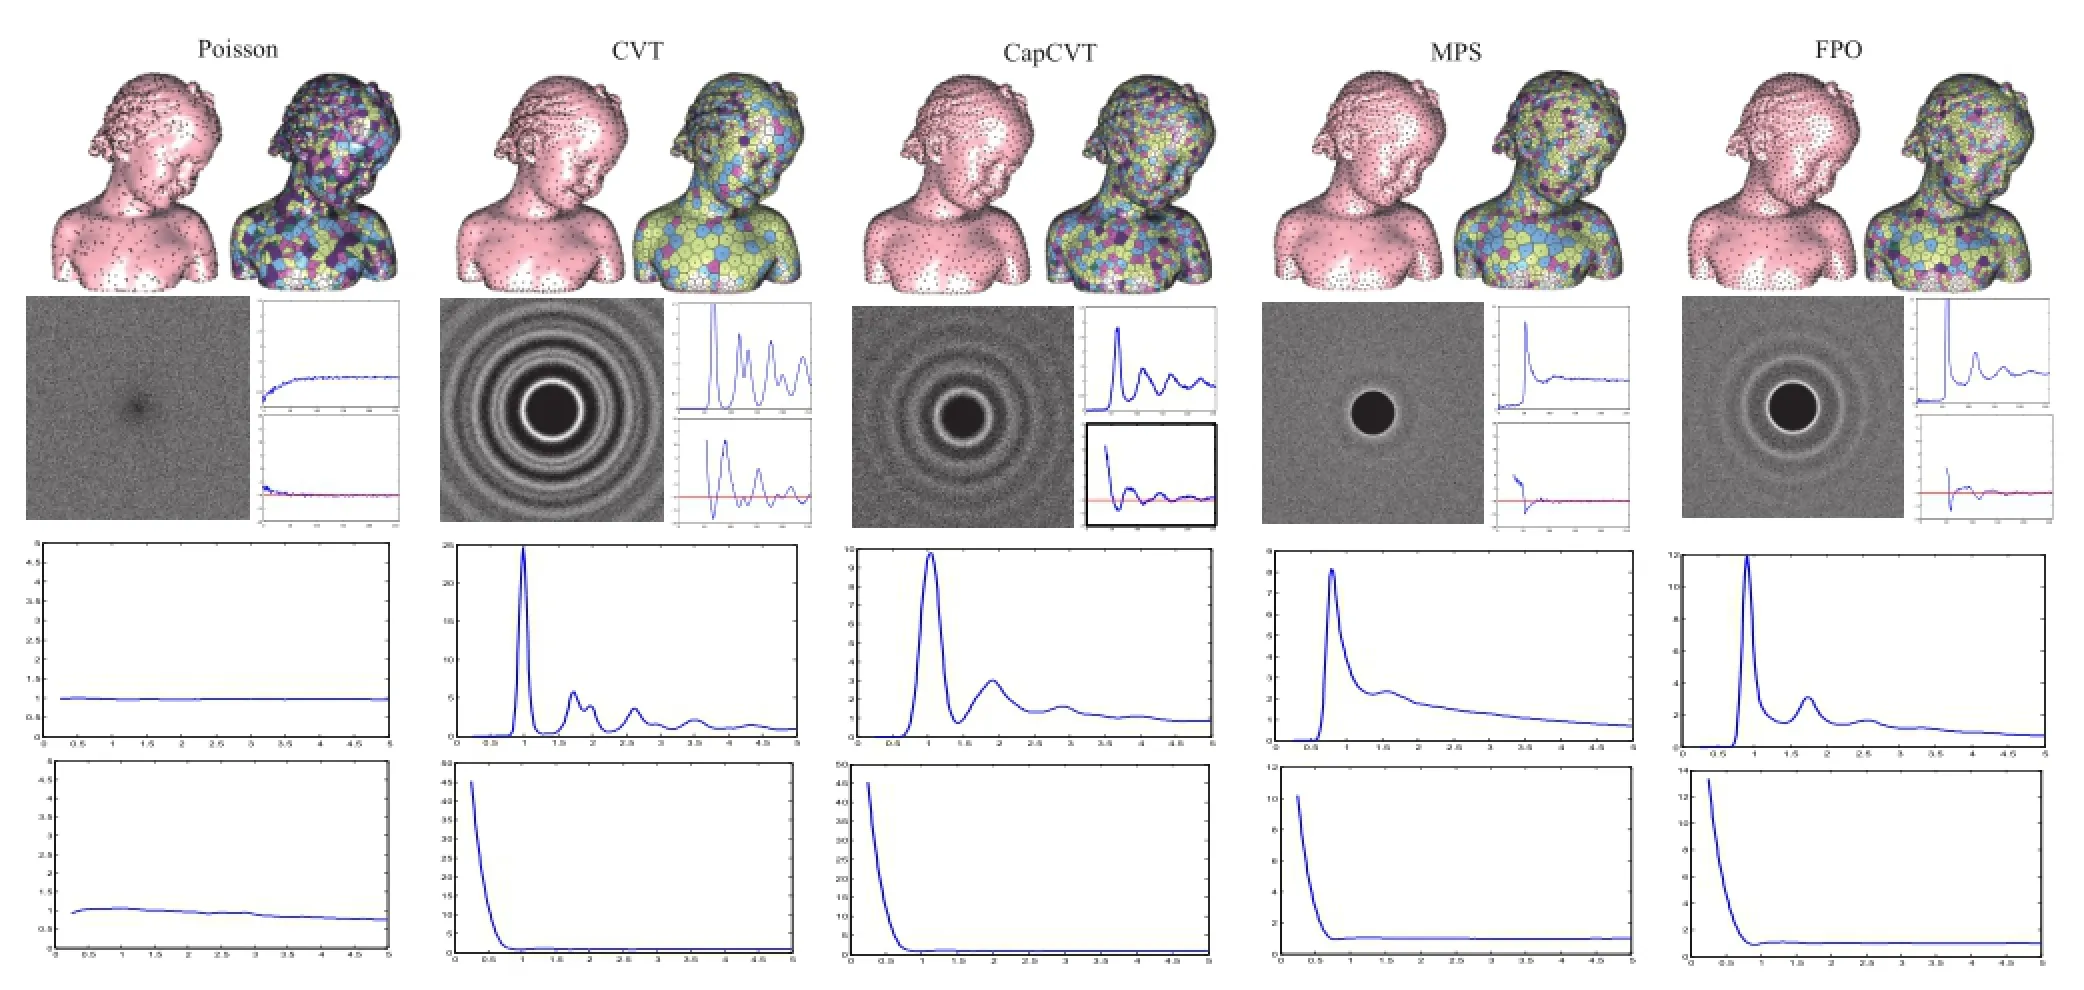
Fig.5 Analysis of different point distributions in an adaptive domain.We set σ=0.08,k=7.
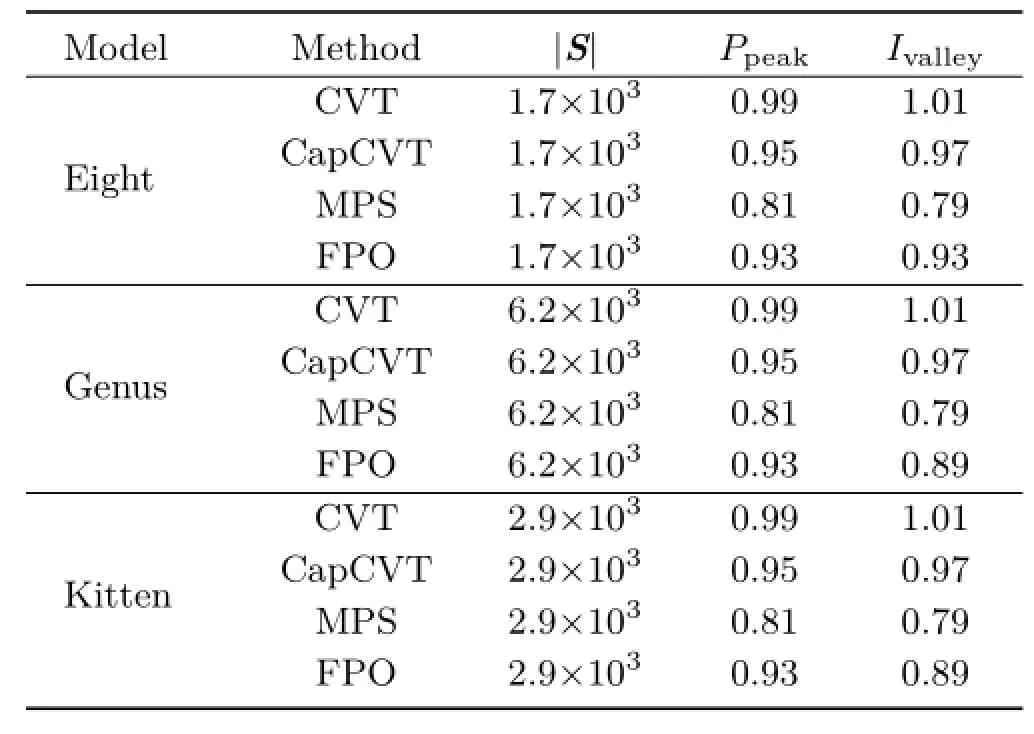
Table 1 Statistics of PCF and irregularity.|S|is the number of sampled points.Ppeakis the abscissa of the main peak of PCF.Ivalleyis the abscissa of the valley of irregularity.The abscissa value of 2 denotes true distance 2dmaxbecause of the normalization of distance
We also demonstrate the effectiveness of our analysis method for models with different topological structures in Fig.6.We obtained sample points by MPS.The left column indicates uniform sampling, and the right column shows adaptive sampling. For adaptive MPS sampling,we use the local feature size(LFS)[33]as the sizing function.We see that uniform and adaptive cases exhibit a consistent appearance,both of PCF and irregularity. Furthermore,our method can capture the blue noise property of this pattern,in which the PCF features a salient peak for each model.
Comparison with DDA:We also compared our method with the DDA tool[9](see Fig.4).The core principle of DDA is to use the distribution of difference vectors pi−pj.Our PCF is based on probability analysis of the magnitudes of difference vectors,i.e.,‖pi−pj‖. PCF contains the same information as the radial average of DDA.As shown in Fig.4,the radial mean of DDA is consistent with our PCF.
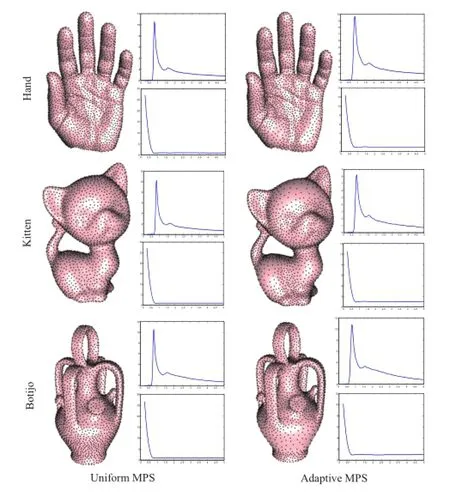
Fig.6 Analysis of uniform and adaptive sampling for different models.Left:uniform sampling.Right:adaptive sampling.Each group includes surface sampling results,PCF results,and irregularity measures.The number of sampling points is approximately 3000.We set σ=0.05 for uniform sampling and σ=0.08 for adaptive sampling. k=7.
In essence, DDA performs kernel density estimation of p(d)(the probability density function
of d),and p(d)is constructed from a straightforward histogram.PCF is p(|d|)using a Gaussian function. In addition,we analyze the irregularity of the point distribution instead of anisotropy because pairwise distance|d|has no directional information. For example,the radial mean and PCF of CapCVT both exhibit visible fluctuations.In addition,PCF can further reveal distance characteristics because it is a statistical measure based on pairwise distances. Figure 4 shows that the PCF for Poisson sampling is flat because of the uniformity of the distance distribution.The other four methods show apparent main peaks in PCF.The PCF of CVT exhibits a larger fluctuation after the main peak in comparison with the other three methods.The irregularity of CVT has a low-lying area which indicates that CVT has high regularity. The irregularity of MPS is flatter than that of the other three methods;hence, MPS has good blue noise properties.
In sampling,regularity is an important criterion that inherently presents a potential risk for aliasing. Our method can analyze the regularity degree of a sampling pattern,which cannot be obtained with the DDA tool[9].CapCVT[20]adopts parameter λ to balance regularity and randomness.Decreasing λ introduces regular patterns.The patterns are the same as that of CVT if λ=0.When λ increases,the point distribution shows irregularities,which are the core principle by which CapCVT avoids the regular patterns observed in CVT.In Fig.7,we show our analysis results after applying our algorithm to the samples generated by CapCVT with different λ.The number of samples is 3000. The first column is similar to the PCF of CVT because λ is very small, and the residual of the other three PCFs is almost the same. However,the irregularity shows more fluctuations from left to right,i.e.,more randomness, which is consistent with the results of CapCVT[20].

Fig.7 Analysis of CapCVT[20]for different λ(left to right,λ= 1,30,50,100).Top to bottom:surface sampling results,PCF results, and irregularity measures.The number of samples is 3000,σ=0.05, and k=7.
Euclidean versusgeodesicdistances: To verify that the Euclidean metric is a suitable approximation for PCF analysis on surfaces,we compare the analysis results using both metrics (see Fig.8).In our experiments,we employ the fastest MMP(Mitchell,Mount,and Papadimitriou) algorithm[34]for geodesic computation. When the number of points is small,the result of using the Euclidean metric is slightly biased because the approximation error is too large.When the number of points increases,the results of the two metrics become similar. Note that the results for both
metrics become smooth when the number of samples increases.
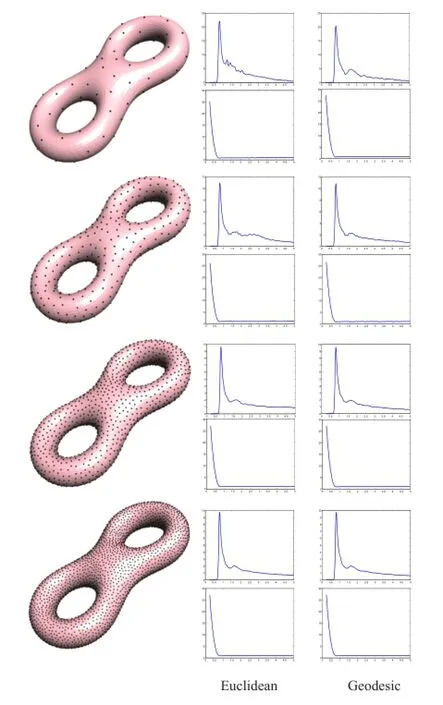
Fig.8 Analysis results using Euclidean and geodesic metrics.Left: surface sampling results.Middle:results using Euclidean metric. Right:results of geodesic metric.Each row includes our PCF results and irregularity measures.Top to bottom:number of sample points =100,500,1500,and 3500,as generated by MPS[16].We set σ= 0.05,k=7.
Limitations:Our current approach has several limitations.For example,we only focus on analyzing isotropic sampling patterns and do not address anisotropic sampling.Another limitation is that the local neighborhood distance computation depends on the restricted Delaunay triangulation of the sampling points and may thus be problematic in regions with inadequate samples.We aim to address these issues in our future work.
6 Conclusions
We have proposed a localized version of PCF to accelerate the algorithm without reducing the quality of analysis.We have generalized PCF to analyze the sampling patterns on surfaces. Our experimental results demonstrate that our method can determine the properties of different point distributions.In the future,we aim to develop new techniques for point sampling synthesis on surfaces. We also plan to increase the speed of our algorithm by using the GPU to take advantage of its local characteristics.
Acknowledgements
This work was partially funded by the National Natural Science Foundation of China (Nos. 61372168,61571439,61572502,and 61271431), and the National High-tech R&D Program of China (863 Program)(No.2015AA016402).
[1]Mitchell,D.P.Generating antialiased images at low sampling densities.In:Proceedings of the 14th Annual Conference on Computer Graphics and Interactive Techniques,65–72,1987.
[2]Fattal,R.Blue-noise point sampling using kernel density model.ACM Transactions on Graphics Vol. 28,No.3,Article No.48,2011.
[3]Deussen,O.;Hanrahan,P.;Lintermann,B.;M˘ehh,R.; Pharr,M.;Prusinkiewicz,P.Realistic modeling and rendering of plant ecosystems.In:Proceedings of the 25th Annual Conference on Computer Graphics and Interactive Techniques,275–286,1998.
[4]Tzeng,S.;Wei,L.-Y.Parallel white noise generation on a GPU via cryptographic hash.In:Proceedings of the 2008 Symposium on Interactive 3D Graphics and Games,79–87,2008.
[5]Ostling,A.;Harte,J.;Green,J.Self-similarity and clustering in the spatial distribution of species.Science Vol.290,No.5492,671a–671,2000.
[6]Lagae,A.;Dutr´e,P.A comparison of methods for generating Poisson disk distributions.Computer Graphics Forum Vol.27,No.1,114–129,2008.
[7]Ulichney,R.Digital Halftoning.The MIT Press,1987.
[8]Schl¨omer,T.;Deussen,O.Accurate spectral analysis of two-dimensional point sets.Journal of Graphics, GPU,and Game Tools Vol.15,No.3,152–160,2011.
[9]Wei,L.-Y.;Wang,R.Differential domain analysis for non-uniform sampling.ACM Transactions on Graphics Vol.30,No.4,Article No.50,2011.
[10]¨Oztireli,A.C.;Gross,M.Analysis and synthesis of point distributions based on pair correlation.ACM Transactions on Graphics Vol.31,No.6,Article No. 170,2012.
[11]Lloyd,S.A.Least squares quantization in PCM.IEEE Transactions on Information Theory Vol.28,No.2, 129–137,1982.
[12]Cook,R.L.Stochastic sampling in computer graphics. ACM Transactions on Graphics Vol.5,No.1,51–72, 1986.
[13]McCool,M.;Fiume,E.Hierarchical Poisson disk sampling distributions.In: Proceedings ofthe Conference on Graphics Interface,94–105,1992.
[14]Yan,D.-M.;Guo,J.-W.;Wang,B.;Zhang,X.-P.;Wonka,P.A survey of blue-noise sampling and its applications.Journal of Computer Science and Technology Vol.30,No.3,439–452,2015.
[15]Cline,D.;Jeschke,S.;White,K.;Razdan,A.;Wonka, P.Dart throwing on surfaces.Computer Graphics Forum Vol.28,No.4,1217–1226,2009.
[16]Yan,D.-M.;Wonka,P.Gap processing for adaptive maximal Poisson-disk sampling.ACM Transactions on Graphics Vol.32,No.5,Article No.148,2013.
[17]Guo,J.;Yan,D.-M.;Jia,X.;Zhang,X.Efficient maximal Poisson-disk sampling and remeshing on surfaces.Computers&Graphics Vol.46,Nos.6–8,72–79,2015.
[18]Xu,Y.;Hu,R.;Gotsman,C.;Liu,L.Blue noise sampling of surfaces.Computers&Graphics Vol.36, No.4,232–240,2012.
[19]Balzer,M.;Schl¨omer,T.;Deussen,O.Capacityconstrained point distributions:A variant of Lloyd's method.ACM Transactions on Graphics Vol.28,No. 3,Article No.86,2009.
[20]Chen,Z.;Yuan,Z.;Choi,Y.-K.;Liu,L.;Wang,W. Variational blue noise sampling.IEEE Transactions on Visualization and Computer Graphics Vol.18,No. 10,1784–1796,2012.
[21]Yan,D.-M.;L´evy,B.;Liu,Y.;Sun,F.;Wang,W.
Isotropic remeshing with fast and exact computation of restricted Voronoi diagram.Computer Graphics Forum Vol.28,No.5,1445–1454,2009.
[22]Zhang,S.;Guo,J.;Zhang,H.;Jia,X.;Yan,D.-M.; Yong,J.;Wonka,P.Capacity constrained blue-noise sampling on surfaces.Computers&Graphics Vol.55, 44–54,2016.
[23]DeGoes,F.;Breeden,K.;Ostromoukhov,V.; Desbrun,M.Blue noise through optimal transport. ACM Transactions on Graphics Vol.31,No.6,Article No.171,2012.
[24]Liu,Y.-J.;Chen,Z.;Tang,K.Construction of iso-contours,bisectors,and Voronoi diagrams on triangulated surfaces.IEEE Transactions on Pattern Analysis and Machine Intelligence Vol.33,No.8, 1502–1517,2011.
[25]Yan,D.-M.;Guo,J.;Jia,X.;Zhang,X.;Wonka,P. Blue-noise remeshing with farthest point optimization. Computer Graphics Forum Vol.33,No.5,167–176, 2014.
[26]Schl¨omer,T.;Heck,D.;Deussen,O.Farthestpoint optimized pointsetswith maximized minimum distance.In:Proceedings of the ACM SIGGRAPH Symposium on High Performance Graphics,135–142, 2011.
[27]Shirley,P.Discrepancy as a quality measure for sample distributions.In: Proceedings of Eurographics 91, 183–193,1991.
[28]Heck,D.;Schl¨omer,T.;Deussen,O.Blue noise sampling with controlled aliasing.ACM Transactions on Graphics Vol.32,No.3,Article No.25,2013.
[29]Subr,K.;Kautz,J.Fourier analysis of stochastic sampling strategies for assessing bias and variance in integration.ACM Transactions on Graphics Vol.32, No.4,Article No.128,2013.
[30]Bowers,J.;Wang,R.;Wei,L.-Y.;Maletz,D.Parallel Poisson disk sampling with spectrum analysis on surfaces.ACM Transactions on Graphics Vol.29,No. 6,Article No.166,2010.
[31]Du,Q.;Gunzburger,M.D.;Ju,L.Constrained centroidal Voronoi tesselations for surfaces.SIAM Journal on Scientific Computing Vol.24,No.5,1488–1506,2003.
[32]Yuksel,C.Sample elimination for generating Poisson disk sample sets.Computer Graphics Forum Vol.34, No.2,25–32,2015
[33]Amenta,N.;Bern,M.;Kamvysselis,M.A new Voronoi-based surface reconstruction algorithm.In: Proceedingsofthe25th AnnualConferenceon Computer Graphics and Interactive Techniques,415–421,1998.
[34]Xu,C.;Wang,T.Y.;Liu,Y.-J.;Liu,L.;He,Y.Fast wavefront propagation(FWP)for computing exact geodesic distances on meshes.IEEE Transactions on Visualization and Computer Graphics Vol.21,No.7, 822–834,2015.

Weize Quan received his B.S.degree from Wuhan University of Technology in 2014,and he is currently a Ph.D. candidate in National Laboratory of Pattern Recognition(NLPR),Institute of Automation, Chinese Academy of Sciences. His research interests include 3D shape analysis and geometry processing.

JianweiGuo received his bachelor degree from Shandong University in 2011,and heiscurrently aPh.D. candidate in National Laboratory of Pattern Recognition(NLPR),Institute of Automation, Chinese Academy of Sciences. His research interests include 3D shape analysis and geometry processing.
Dong-Ming Yan isan associate professorin NationalLaboratory of Pattern Recognition(NLPR),Institute of Automation,Chinese Academy of Sciences.He received his Ph.D.degree in computer science from Hong Kong University in 2010,and his master and bachelor degrees in computer science and technology from Tsinghua University in 2005 and 2002,respectively.His research interests include computer graphics,geometric processing,and visualization.
Weiliang Meng is an assistant professorin NationalLaboratory of Pattern Recognition(NLPR),Institute of Automation,Chinese Academy of Sciences.He received his B.E.degree in computer science from Civil Aviation University of China in 2003,M.Sc. degree in computer application from Tianjin University in 2006,and Ph.D.degree in computer application from StateKey Laboratory ofComputer Science,Institute of Software,Chinese Academy of Sciences in 2010.His research interests include geometry modeling, image-basedmodelingandrendering,andaugmented reality.
Xiaopeng Zhang is a professor in NationalLaboratory ofPattern Recognition (NLPR), Institute of Automation, Chinese Academic of Sciences.He received his Ph.D.degree in computer science from Institute of Software,Chinese Academy of Sciences in 1999.He received the National Scientific and Technological Progress Prize(second class) in 2004. His main research interests include computer graphics and image processing.
Open Access The articles published in this journal are distributed under the terms of the Creative Commons Attribution 4.0 International License(http:// creativecommons.org/licenses/by/4.0/), which permits unrestricted use,distribution,and reproduction in any medium,provided you give appropriate credit to the original author(s)and the source,provide a link to the Creative Commons license,and indicate if changes were made.
Other papers from this open access journal are available free of charge from http://www.springer.com/journal/41095. To submit a manuscript,please go to https://www. editorialmanager.com/cvmj.
1NLPR-LIAMA,Institute ofAutomation, Chinese Academy of Sciences,Beijing 100190,China.E-mail: D.-M.Yan,yandongming@gmail.com();X.Zhang, xiaopeng.zhang@ia.ac.cn().
Manuscript received:2015-11-23;accepted:2016-03-18
 Computational Visual Media2016年3期
- Computational Visual Media的其它文章
- VideoMap: An interactiveand scalablevisualization for exploring video content
- Synthesis of a stroboscopic image from a hand-held camera sequence for a sports analysis
- Removingmixed noiseinlow ranktexturesbyconvex optimization
- Discriminative subgraphs for discovering family photos
- Parallelized deformable part models with effective hypothesis pruning
- Skeleton-based canonical forms for non-rigid 3D shape retrieval
