Relationships among three popular measures of differential risks: relative risk, risk difference, and odds ratio
Changyong FENG*, Hongyue WANG, Bokai WANG, Xiang LU, Hao SUN, and Xin M. TU
·Biostatistics in psychiatry (31)·
Relationships among three popular measures of differential risks: relative risk, risk difference, and odds ratio
Changyong FENG1,2,*, Hongyue WANG1, Bokai WANG1, Xiang LU1, Hao SUN1, and Xin M. TU1
odds ratio; relative risk; risk difference
1. Introduction
The relative risk, risk difference, and odds ratio are three major measures used to assess differences in the risk of diseases between different groups. These measures- which play important roles in research and practice in the biomedical, behavioral, and social sciences- have been extensively discussed in statistics,[1,2]epidemiology,[3-7]and biomedical[8]literature. Although straightforward to interpret when used independently,there is considerable confusion and frequent misinterpretation of the measures when they are used together.[9,10]As popular as they are, relationships among the three measures have never been made clear and remain elusive. For example, here is an excerpt from Kraft and colleagues:[11]
“…genetic profiles based on sets of risk markers can potentially identify rare highrisk and low-risk subgroups with large relative differences in risk (that is, with odds ratios greater than 10). These profiles can also have a high population attributable risk(PAR; also known as population attributable fraction).” (p.264)
In this excerpt the authors incorrectly assumed that a larger odds ratio would imply a higher PAR, which, in turn, would give rise to a larger relative risk. Their line of thinking is apparently logical, since all three measures have traditionally been viewed as equivalent measures of differential risks such that a larger value in any one measure would naturally imply larger values in the other two measures. This paper discusses the properties of the three measures, systematically assesses relationships between the three pairs of measures (i.e., relative risk and odds ratio, relative risk and risk difference, and risk difference and odds ratio), and presents examples to clarify the misconception in the above statement as well as other pitfalls when interpreting the relationships between the different measures.
2. Relationship between relative risk and odds ratio
Let p1and p2denote disease prevalence in two groups of interest. For simplicity, we assume that 0<p1, p2<1, that is, there exist two subgroups with potentially different prevalence rates for the disease of interest. The relative risk (r), risk difference (d), and odds ratio (θ) between the groups are defined as:

Note that the relative risk is also called the risk ratio in the literature,[6]but for convenience we use the term‘relative risk' hereafter.
From the definitions above, we immediately see that the three measures have quite different ranges;both the relative risk and odds ratio vary between 0 and∞, while the risk difference is limited to a much smaller interval between -1 and 1. Despite the fact that the relative risk and odds ratio have the same range, they represent totally different measures of differential risks and, therefore, have quite different interpretations. For example, if p1=0.40 and p2=0.25, then the relative risk is r=1.60, but the odds ratio is θ=2.00.
Given two prevalence rates p1and p2, we can calculate both the relative risk and odds ratio. However,there is generally more than one pair of prevalence rates(p1, p2) that yields any pre-specified relative risk (or odds ratio). For example, (cp1, cp2) yields the same relative risk (r=p1/p2) for any value of c when 0<c<1, such as c=0.2 or c=0.8. Thus, before discussing the potential relationship between the relative risk and odds ratio, we must make sure that there is a unique pair of prevalence rates (p1, p2) that gives rise to the specified relative risk and odds ratio. The following theorem indicates that this is the case.
Theorem 1.The relative risk r and the odds ratio θ satisfy one of the following conditions:

Given any specific pair of measures (r,θ)satisfying either of the inequalities in (2), there exists a unique pair of prevalence rates (p1, p2)that gives rise to the r and θ.
[NOTE: The three theorems presented in this paper are new results. The proofs for these theorems will be published in an upcoming paper; they are available from the authors on request.]
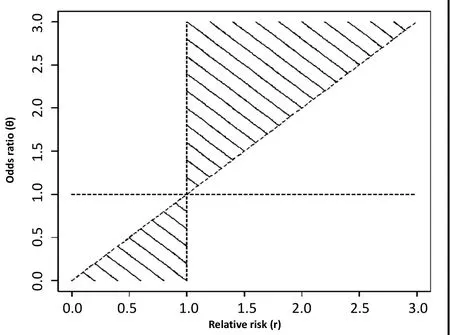
The shaded areas in Figure 1 show the relationship between the relative risk and odds ratio. The only situation in which a one-to-one correspondence between the two measures occurs is the special case in which r=θ=1. For all other situations, the relationship between the two measures is not unique. For example,if r=1.5, the odds ratio can be any number θ>1.5; and for θ=1.5, the relative risk can be anywhere in theinterval 1<r<1.5. As shown in Figure 1, the odds ratio θ can be arbitrarily large for any r>1 and arbitrarily small for any r<1.

Figure 1. Relationship between odds ratio and relative risk
The result of Theorem 1 has significant implications for case-control studies. Case-control designs are widely employed to study the risk of disease, especially rare diseases. The odds ratio is the most popular measure of differential risk in such studies, because, unlike relative risk and risk difference, it can be estimated from both prospective and retrospective studies. Several authors have discussed methods to approximate the relative risk using the odds ratio from case-control studies.[2,4,6,8]
For small p1and p2, we have:

Thus, for small prevalence rates, the relative risk will be close to the odds ratio. However, the reverse is usually not true; that is, the relative risk and odds ratio may still be close, even if p1and p2are not small. This relationship is presented in Figure 2, which shows the largest value that p2can take to ensure precision of the above formula for estimating r from θ(ε=|r-θ|)as a function of the odds ratio θ for several levels of the error bound ε (assuming that 0 <p2< p1< 1 ). For relatively large odds ratios (e.g., θ≥ 3 ), p2must remain very small in order to obtain a good approximation of the relative risk using the odds ratio. However, for relatively small θ, p2and p1can take on large values.For example, if θ=2 and p2=0.2, then r=1.154, which is quite close to θ=0.2. Theorem 1 ensures that such approximations of the relative risk using the odds ratio are meaningful, since each approximated relative risk,together with the odds ratio, corresponds to a unique set of prevalence rates.

Figure 2. The largest value that p2 can take given the odds ratio and pre-specified precision
3. Relationship between relative risk and risk difference
Given two prevalence rates p1and p2, we can calculate both the relative risk and risk difference. The relationship between these measures is specified in Theorem 2.
Theorem 2. The relative risk and risk difference satisfy one of the following conditions:

Given any specific pair of measures (r,d)satisfying either of the inequalities in (3), there exists a unique pair of prevalence rates (p1, p2)that give rise to the r and d.
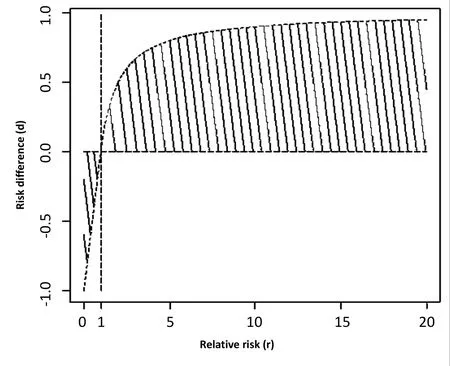
The shaded areas in Figure 3 depict the relationship between the two measures. The only situation in which a one-to-one correspondence between the two measures occurs is the trivial case in which r=0 and θ=1. For all other situations, the relationship between the two measures is not unique. For example, if r=5,the risk difference can range between d=0 and d=0.8 As shown in the Figure 3, for any d>0 the relative risk can be arbitrarily large.
Unlike the relationship between the relative risk and the odds ratio, it is not possible to estimate the relative risk using the risk difference (or vice versa), so assessing the degree of correspondence of the paired measures is of little practical value.
4. Relationship between risk difference and odds ratio
Unlike the relationship between the relative risk and the odds ratio and the relationship between the relative risk and the risk difference, a specific pair of odds ratio and risk difference measures (θ, d) does not give rise to a unique pair of prevalence rates (p1, p2). This assertion follows from the following theorem.

Figure 3. Relationship between risk difference and relative risk
Theorem 3.The odds ratio θ and risk difference d satisfy one of the following conditions:

Any pair of measures (θ, d) satisfying either of the inequalities in (4) corresponds to two different pairs of prevalence rates (1p1,1p2)and (2p1,2p2), except for the special case of θ=[(1+d)/(1-d)]2(when the two pairs coincide).
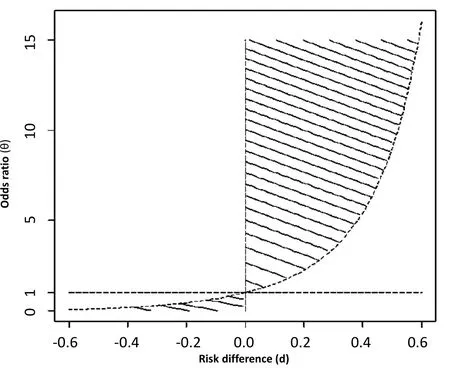
The shaded areas in Figure 4 show the relationship between the risk difference and the odds ratio. There is no unique set of prevalence rates corresponding to a given pair of risk difference and odds ratio measures, so the relationship of the risk difference and odds ratio is difficult to interpret and of little practical value.

Figure 4. Relationship between risk difference and odds ratio
5. Examples
In this section we use numerical examples to clarify misconceptions about the relationships among the risk ratio, risk difference, and odds ratio. For simplicity and without the loss of generality, we only consider the case in which 0<p2<p1<1, implying that d>0, r>1 and θ> 1.The discussion in the preceding sections makes it clear that one must be very careful when comparing the three different measures. In some cases, such as the relationship between the risk difference and the odds ratio, it is meaningless to even speak of such a relationship, because the same pair of measures may correspond to quite different sets of prevalence rates.Moreover, even if the measures arise from a unique set of prevalence rates - which occurs when comparing the relative risk to the odds ratio or comparing the relative risk to the risk difference - the relationship between the measures is not monotone (i.e., it varies for different ranges of the measures), so it is not possible to make qualitative comparisons of the magnitude of the measures. Unfortunately, these properties have not been made clear in the literature, leading to frequent misinterpretation of study findings.
Example 1.A larger relative risk does not imply a larger risk difference.
Suppose (1p1,1p2)=(0.40, 0.25) and (2p1,2p2)= (0.54,0.36). The risk differences for the two cases are 0.15 and 0.18, respectively, but the corresponding relative risks are 1.6 and 1.5. Thus, when changing from the first to the second pair of prevalence rates the risk difference increased, but the relative risk decreased.
Example 2.A larger odds ratio does not imply a higher relative risk.
Many publications, especially publications in epidemiology, assume that larger odds ratios correspond to higher relative risks. For example, the section of the paper by Kraft and colleagues[11]quoted in the introduction indicated that a larger odds ratio implied a higher population attributable risk (PAR) and, thus, a higher relative risk (because PAR=1-1/r) in their study.This is not true. As shown in Table 1, when (p1, p2)=(3/6,1/6), r=3 and θ=5, but when (p1, p2)=(10/12, 5/12),r=2 and θ=7; that is, a higher odds ratio was associated with a lower relative risk (and a lower risk difference).

Table 1. Non-monotone relationships among odds ratio, relative risk, and risk difference
Example 3.A larger odds ratio does not imply a larger risk difference.
Table 1 also shows that when (p1, p2)=(3/6, 1/6), θ=5 and d=1/3. However, when (p1, p2)=(4/10, 1/10), θ=7 and d=3/10. Thus, an increase in the odds ratio does not imply an increase in the risk difference.
Example 4.In this example, we consider a scenario where the odds ratio (represented by t in the following equations) becomes arbitrarily large while the relative risk approaches 1 (the theoretical minimum value of the relative risk) and the risk difference approaches 0 (the theoretical minimum value of the risk difference).
For t>0, let

It is clear that 0<p1(t), p2(t)<1for any t>0. The relative risk, odds ratio, and risk difference are

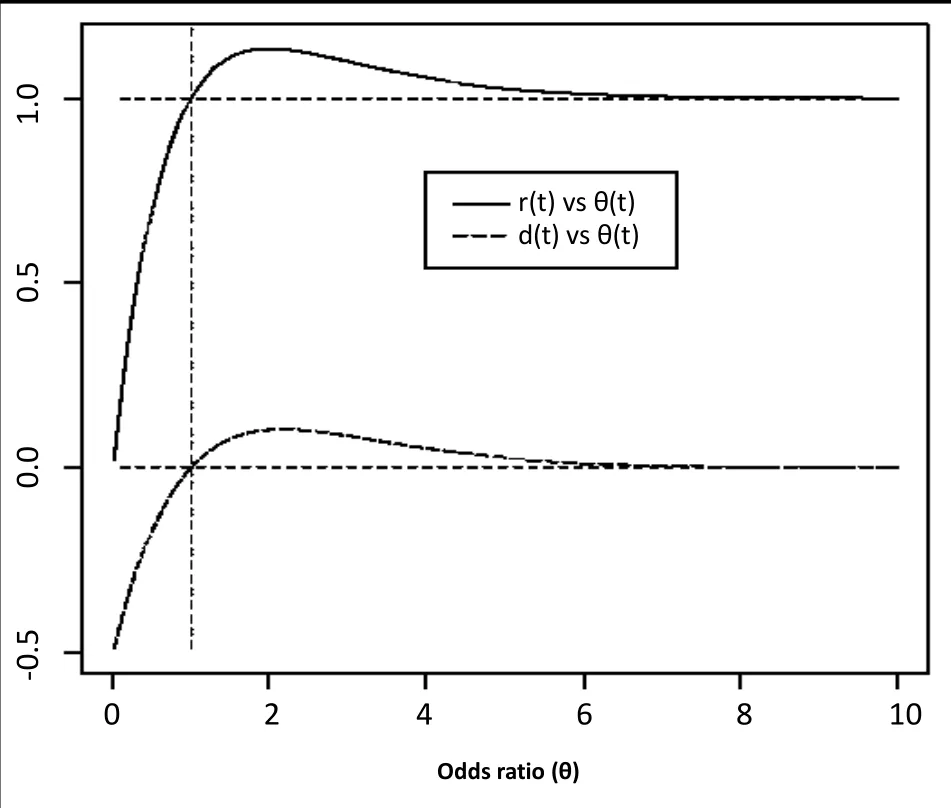
Figure 5 shows the plots of r(t)and d(t)versus θ(t). Both r(t) and d(t) first increase then decrease with t, reaching their maximum values when t=2.1496. For t>2.1496,both r(t) and d (t) are decreasing functions of t, with r(t) reaching the asymptote at 1 and d (t) reaching the asymptote of 0. Thus a larger odds ratio does not imply a larger relative risk or a larger risk difference. The plot shows the complexity of the changes in the relative risk and risk difference as the odds ratio increases.

Figure 5. Relationship of the odds ratio θ(t), relative risk θ(t), and risk difference d(t) described in Example 4
6. Conclusion
Although the risk difference, risk ratio, and odds ratio are widely popular in biomedical and psychosocial research, the relationships among the different measures have not been made clear in the literature.Many researchers incorrectly assume that there is a monotone relationship among the different indices such that higher values for one index will correspond to higher values of the other indices. The examples presented in this paper demonstrate that this is not the case; the three measures of differential risks behave very differently and in general can only be interpreted within the unique confines of their definitions.
This misconception about the equivalence of the measures is particularly problematic when pooling results in a meta-analysis from individual studies on a given topic that have employed different measures of risk. The theorems and examples in this paper demonstrate that there is no logical relationship between any of these measures. With the exception of the odds ratio and relative risk, to consolidate findings from different studies, one must either combine studies using the same measure or recalculate each measure using the original prevalence rates.
Acknowledgements
We thank Dr. Michael Phillips (co-editor-in-chief) for his very insightful comments.
Funding
The preparation of this paper was supported by a pilot grant (PI: Feng) from the Clinical and Translational Sciences Institute at the University of Rochester Medical Center (UR-CTSI GR500208).
Conflict of interest statement
The authors report no conflict of interest.
Authors' contributions
CYF and HYW derived the theoretical results; BKW, LX,and HS, constructed the examples and graphs; and TXM drafted the manuscript. All authors read and approved the final manuscript.
1. Fleiss JL, Levin B, Paik MC. Statistical Methods for Rates and Proportions, 3rded. Hoboken, NJ: Wiley; 2003
2. Prentice RL, Pyke R. Logistic disease incidence models and case-control studies. Biometrika. 1979; 66: 403-411. doi:http://dx.doi.org/10.1093/biomet/66.3.403
3. Brownson RC, Alavanja MC, Caporaso N, Simoes EJ, Chang JC.Epidemiology and prevention of lung cancer in nonsmokers.Epidemiol Rev. 1998; 20(2): 218-236
4. Lee J. Odds ratio or relative risk for cross-sectional data?Int J Epidemiol. 1994; 23(1): 201-203. doi: http://dx.doi.org/10.1093/ije/23.1.201
5. Robbins AS, Chao SY, Fonseca VP. What's the relative risk? A method to directly estimate risk ratios in cohort studies of common outcomes. Ann Epidemiol. 2002; 12(7): 452-454
6. Rothman KJ. Epidemiology: An Introduction. New York: Oxford University Press; 2002
7. Woodward M. Epidemiology: Study Design and Data Analysis 2nded. Boca Raton, FL: Chapman & Hall/CRC; 2005
8. Zhang J, Yu KF. What's the relative risk? A method of correcting the odds ratio in cohort studies of common outcomes. JAMA. 1998; 280(19): 1690-1691. doi: http://dx.doi.org/10.1016/S1047-2797(01)00278-2
9. Houghton AM. Mechanistic links between COPD and lung cancer. Nat Rev Cancer. 2013; 13(4): 233-245. doi: http://dx.doi.org/10.1038/nrc3477
10. Marugame T, Sobue T, Nakayama T, Suzuki T, Kuniyoshi H,Sunagawa K, et al. Filter cigarette smoking and lung cancer risk; a hospital-based case — control study in Japan. Br J Cancer. 2004; 90(3): 646-651
11. Kraft P, Wacholder S, Cornelis MC, Hu FBb, Hayes RB, Thomas G, et al. Beyond odds ratios-communicating disease risk based on genetic profiles. Nat Rev Genet. 2009; 10(4): 264-269. doi:http://dx.doi.org/10.1038/nrg2516

Changyong Feng obtained his bachelor's of science degree in Operations Research from the University of Science and Technology of China in 1991 and a PhD in statistics from the University of Rochester in New York in 2002. He is an associate professor in the Department of Biostatistics and Computational Biology at the University of Rochester Medical Center. His research interests include survival analysis,longitudinal data analysis, and statistical methods in clinical trials.
三种常用危险度测量方法之间的关系:相对危险度、危险差和比值比
Feng CY, Wang HY, Wang BK, Lu X, Sun H, Tu XM
比值比;相对危险度;危险差
The relative risk, risk difference, and odds ratio are the three most commonly used measures for comparing the risk of disease between different groups. Although widely popular in biomedical and psychosocial research, the relationship among the three measures has not been clarified in the literature.Many researchers incorrectly assume a monotonic relationship, such that higher (or lower) values in one measure are associated with higher (or lower) values in the other measures. In this paper we discuss three theorems and provide examples demonstrating that this is not the case; there is no logical relationship between any of these measures. Researchers must be very cautious when implying a relationship between the different measures or when combining results of studies that use different measures of risk.
[Shanghai Arch Psychiatry. 2016; 28(1): 56-60.
http://dx.doi.org/10.11919/j.issn.1002-0829.216031]
1Department of Biostatistics & Computational Biology, University of Rochester, Rochester, NY, United States
2Department of Anesthesiology, University of Rochester, Rochester, NY, United States
*correspondence:Professor Changyong Feng, Department of Biostatistics and Computational Biology, University of Rochester, 601 Elmwood Avenue,Rochester, NY. 14642, United States. E-mail: changyong_feng@urmc.rochester.edu
A full-text Chinese translation of this article will be available at http://dx.doi.org/10.11919/j.issn.1002-0829.216031 on May 25, 2016.
概 述:相 对 危 险 度 (relative risk)、 危 险 差 (risk difference) 和比值比 (odds ratio) 是最常用的三种比较不同群体之间疾病风险的方法。虽然它们在生物医学和社会心理学研究中广泛流行,但是尚无文献明确这三种方法之间的关系。许多研究人员误以为它们之间的关系是单调变化的,即某种测量方式中较高(或较低)的值与其它测量方式中的较高(或较低)的值相关。本文中,我们讨论了三个定理,并提供例子解释之前大部分研究人员所认为这三种方法之间的关系是不对的;这些测量方法相互之间并没有逻辑关系。研究人员在说明不同种测量方法之间的相关性时或结合使用不同种风险测量方法所得的研究结果时必须非常谨慎。
本文全文中文版从2016年5月25日起在
http://dx.doi.org/10.11919/j.issn.1002-0829.216031可供免费阅览下载
- 上海精神医学的其它文章
- Effect of group cognitive-behavioral therapy on the quality of life and social functioning of patients with mild depression
- Comparison of cognitive flexibility and planning ability in patients with obsessive compulsive disorder, patients with obsessive compulsive personality disorder, and healthy controls
- Cross-sectional study of the severity of self-reported depressive symptoms in heroin users who participate in a methadone maintenance treatment program
- Genetic findings are challenging the symptom-based diagnostic classification system of mental disorders
- Inf l uence of cross-disorder analyses on the diagnostic criteria of mental illnesses
- Case report of body dysmorphic disorder in a suicidal patient

