
Learning trendiness from twitter to web: a comparative analysis of microblog and web trending topics①
2016-12-05 01:31:03WangDongXieGaogang
High Technology Letters 2016年2期
Wang Dong (王 栋), Xie Gaogang
(*Institute of Computing Technology, Chinese Academy of Sciences, Beijing 100190, P.R.China) (**University of the Chinese Academy of Sciences, Beijing 100049, P.R.China)
Learning trendiness from twitter to web: a comparative analysis of microblog and web trending topics①
Wang Dong (王 栋)②***, Xie Gaogang*
(*Institute of Computing Technology, Chinese Academy of Sciences, Beijing 100190, P.R.China) (**University of the Chinese Academy of Sciences, Beijing 100049, P.R.China)
The development of microblog services has a considerable effect on the patterns of web access and Internet resources discovery. Understanding the interrelation between information diffusion in online social media and user web interests can help the web ecosystem stakeholders in developing new services and designing efficient systems with optimized resources. This paper explores whether or not one can infer the trends of topics in the web by observing the Twitter microcosm. Using datasets collected from Twitter and two representative web services (Google and Alexa), this work conducts a comparative analysis between trending patterns of topics in Twitter and in the web by considering both the temporal and spatial perspectives, and finds that individual topics in Twitter and in the web share similar trending patterns both from the temporal and spatial aspects. Nevertheless, the trendiness in Twitter can precede for a few hours and is highly unstable compared to the one in web. The application of these findings is also discussed on ad keywords planning in Search Engine Marketing.
microblog, web services, trendiness, comparative analysis
0 Introduction
Microblog services have dramatically changed the way that users discover content and consume information on the Internet[1]. Several studies proposed to exploit the popularity of URLs shared on social networks to predict the actual popularity of the linked content[2,3]. Given the importance of the prominent feature of microblog, this paper raises the question about whether or not the user interests in a web content can be inferred by observing the content trends in microblogs.
While the popularity of content reflects the long term importance of a content, trends and in particular positive trends (referred as trendiness) express arising and short-term interests. More specifically, this paper studies trendiness of topics in Twitter and compares it with the trendiness of contents in Google and Alexa, two representative services in the web sphere. This work focuses on highly positive trends and their corresponding trending topics which attract relatively higher interests within a short period of time.
As there is no absolute metric that captures the interests within the web spheres, web interests are defined as the extent to which web resources (i.e. webpages) are being used or searched in the Internet. Specifically, interests in the web sphere are measured as the relative number of users who search for a particular web content using a set of keywords through search engines (e.g. Google). In addition, web interest is also measured by the audience of webpages relying on statistics provided by Alexa[4]. On the other hand, a nature language processing approach is used to extract topics of interest in microblogs and measure trends in the microblog sphere based on a dataset of tweets collected from Twitter. Furthermore, official trend statistics provided by Twitter are also used.
This work compares the trendiness of topics in Twitter with the ones in Google, Alexa from both temporal and spatial aspects. In detail, the temporal evolution of trendiness in Twitter and their interrelation with web trends is first examined. The likelihood that a Twitter trending topic is also the trending in web (as illustrated by Google searches) is measured, and the temporal offset between trendiness in both spheres is characterized.
The evidences that trending topics share certain similar patterns within the two spheres are found in this work. It is observed that more than 70% of the trending Twitter topics are likely to be also trending in the web and more than 72% of the web trending topics have been (or will be) also trending in the Twitter sphere. The results also suggest that trendiness seems to be in most cases originating from the Twitter sphere, with more than 65% of the topics trending in Twitter first for a few hours. A notable difference is that trendiness in Twitter is highly unstable as the topic rank stability changes frequently.
Secondly, the analysis is extended to spatial aspect of trendiness by observing trending topics across five countries. It is found that both in Twitter and in web, most trending topics obtain trends in not more than 2 countries and for a topic, the trending regions in the two spheres are similar, which advocates for a regional feature of trends.
Based on these observation, it can be concluded that it is possible to learn trending topics in web from Twitter. Even better, one can learn them a few hours earlier than the time they will get popular in web. This paper confirms this with a detailed experiment, in which the possibility of using trending topics from Twitter to infer ad keywords in Google AdWords, a widely-used online platform for Search Engine Marketing(SEM), is shown.
The structure of this paper is as follows. Section 1 describes the datasets used in this study. Section 2 analyzes the temporal interrelation between trends in microblogs and across the web. Section 3 studies the spatial dimension of such an interrelation between the two spheres. In Section 4, possible applications of the study are discussed. Section 5 introduces related work. Finally, Section 6 concludes this paper.
1 Methodology and dataset description
This section first describes the methodology used to infer the trending topics from tweets in Twitter as well as in Google and Alexa, and two popular sites provide trends in the web sphere. The metrics which are used to measure the trendiness of topics are also introduced. Finally, the datasets used for analysis are detailed.
1.1 Identifying trends
Trends describe the popularity dynamics of topics over a short time period, where topiccconsists of a word or a sentence mentioned in tweets or queried using search engines. While a single-word topic might be easy to obtain from tweets or queries, multi-words topics should be learnt using some natural language processing methods, e.g. LDA.
1.1.1 Trending index volume
User interests in both microblog and web spheres have temporal dynamics. That is to say, the volume of mentions or searches for a particular topic naturally varies over time. The trending index volumeVi(c) for topiccat a given timeiis defined as the volume of the topic normalized by the maximum volume observed during an observation period of time and then scale the trending index volume to [0,100], which is similar to the official definition provided by Google[5]. Over given periodR, all trending index volumesVi(c) wherei∈Rcompose the trends of topiccduring that period,V(c), i.e.V(c)={Vi(c),i∈R}. This study further usesVG(c) andVT(c) to represent the trends of topiccin Google and Twitter.
Extracting the trending index in Twitter is a challenging task, as it needs to extract the global trending topics over a particular period of time. Although Twitter offers an official trending service, the trends are determined by an “algorithm tailored for the user based on who [you] follow and [your] location. This algorithm identifies topics that are immediately popular, rather than topics that have been popular for a while or on a daily basis, to help [you] discover the hottest emerging topics of discussion in Twitter that matter most to [you]”[6]. In other words, Twitter official trending topics are personalized to user accounts. Therefore an alternative approach is adopted to extract global Twitter trends.
A topic consists of a single word or multiple words. For a single-word topic that includes only one wordw, the trending index is measured as the word frequency based on the content of tweets. All tweets are binned into subsetsSiwith a fixed time interval (daily and hourly in this study) and then for each subsetSi, the set of wordsWiis extracted, and the word frequencyTFi(w) for each wordw∈Wiis computed. Note that stop words (e.g. “a”, “after”, “that”, etc.) which naturally appear with higher frequencies are ignored here[7]. A word is counted once per tweet even if it is repeated in the tweet. Since the number of tweets in each subset might vary greatly, the word frequencyTFi(w) is normalized by the number of tweets in each subset, resulting in a relative topic frequencyRFi(c)=TFi(w)/|Si|, where |Si| is the number of tweets in subsetSi. Finally, allRFi(c)s are scaled in [0,100]. The Twitter trending index volume for single-word topiccat timeiin a periodRcan then be written as:Vi(c)=RFi(c)/maxj∈R({RFj(c)})×100.

3) For each of word positionjin documenti, wherej∈{1,…,Ni} andi∈{1,…,M}:
3a) Choose a topiczi, jfromM(θi) whereM(θi) is a categorical random variable with parameterθi.
3b) Choose a wordwi, jfrom M(φzi, j) where M(φzi, j) is a categorical random variable with parameter φzi, j.
Following the above process, the total probability of the model is:


(1)
The trending index volumes for topics in Google is much easier to be obtained, as Google Trends provide the normalized search volume for both single-word and multi-words topics. These statistics can be used as the trending index volumes in Google directly.
However, it is hard to get the exact search volumes of topics from Alexa. Alternatively, the trendiness of topics in Alexa is estimated approximately with the assistance of topic rank information: the trend of topiccis considered in binary, that is, if topiccappears in the top trending list of Alexa at timei, then the trending index volume ofcatiis 100, otherwise, it is 0. Clearly, a sharp rise can happen on Alexa at timeiifcis in the top trending list at timeibut not at time (i-1).
1.1.2 Positive and negative trends

In this study,αis set to the 50thpercentile, 75thpercentile and 90thpercentile of all positive trending index volumes inV(c) respectively.
1.1.3 Trending topics
Trending topics are topics in which trending index volume increases in a relatively higher proportion compared to others. In other words, a trending topic can be either a word, an expression (a set of concatenated words) or a tweet in which the immediate popularity is rapidly increasing, compared to other popular topics. The emergence of trending topics is either endogenously driven by users interests, or motivated by an exogenous event that prompts people’s attention.
A trending topic at timeiis identified as follows:
1) A discrete-time vector of trending index volumes for each topiccis derived, from which all positive trends can be extracted.

Again, it is noteworthy that the notion of “trending” is different from “popular”. The latter is highly dependent on the number of times the topic is mentioned, e.g. the number of relative tweets in Twitter or search volume in Google, across a rather long period of time, while trendiness focuses on the speed of increase in mentioning a topic within a short period of time. A topic that has been popular for a while is most likely to be not trending anymore, as the number of tweets mentioning this topic would become steady even though it is still high.
1.2 Datasets
For the purpose of this study, Twitter’s tweets are used to extract the trends of topics in Twitter. The “official” trending topics as shown by the Twitter are also relied on for geographical pattern analysis. Google Trends and Alexa services are also used to obtain trends of the web sphere.
1.2.1 Twitter tweets
This paper uses a set of tweetsTfrom Ref.[9] comprising 132,210,436 tweets published by 7,404,248 users over the period from August 1st, 2009 to August 31st, 2009. Two time granularities are considered: a daily topic analysis which matches the Google Trends service time granularity[10], and a topic extraction on an hourly basis which matches the Alexa trends analysis. As in Ref.[11], it is observed that the frequency of the top 5% popular words accounts for more than 95% of words count in the overall daily and hourly subsets of tweetsT.

1.2.2 Official Twitter trending topics
The tweets described above do not provide enough geographic information. In order to analyze the geographic patterns of Twitter trending topics, this work further collects for the period spanning from September 1st to October 31st, 2012, and every five minutes, the top 10 trending topics are suggested by Twitter for the following countries: U.S, U.K, Canada, France and Australia, which are abbreviated toUS,UK,CA,FRandAUlater. There are 6,858 unique trending Twitter topics, which compose a topic setH.
1.2.3 Google trends

1.2.4 Alexa rank lists

2 Temporal analysis
This section investigates how the trending topics in microblog sphere behave in the web at first. Later, the section proceeds to analyze the reverse interrelation by studying the Alexa dataset compared to the collected Twitter dataset to examine how the trends of trending topics in the web look like in Twitter.
In summary, it is found that the trending topics are similar within the two worlds where at least 70% of the Twitter trending topics are likely to be also trending in the web and 72% of the web trending topics have been (or will be) also trending in the Twitter world. The results also suggest that although the trendiness in Twitter seems to be synchronous with the one in Google on daily granularity basis, most of the trends of these topics are actually driven by Twitter population in advance, and then spread in the web on a finer granularity (such as on an hourly basis). The notable observed difference is that trendiness in Twitter is highly unstable. It is also found that almost all Twitter trending topics exhibit a very low rank stability, which is opposed to the high stability observed for the web trending topics.
2.1 How do Twitter topics behave in the web?
As the topics extracted from tweets are used to collect their trends in Google, an analysis can be made on how accurately topics’ trends in Twitter can approximate their trends in Google.
2.1.1 Trends similarity in Twitter and Google
The similarity between trends in Twitter and Google using are examined using Kullback-Leibler divergence (also called relative entropy), which is a measure of the difference between two probabilitiesXandY[12]. The K-L divergence ofYfromX,DKL(X‖Y), is the expected number of extra bits required to code samples fromXwhen using a code based onY, rather than using a code based onX, i.e. the information lost whenYis used to approximateX. Typically, the K-L divergence ofYfromXis defined as follows:

(2)
The smaller the value is, the closer the two distributions are. In this paper,XandYare related to the Twitter trends and Google trends of topicc, respectively.X(i) (resp.Y(i)) is the ratio of trending index volume ofcat timeiin Twitter (resp. Google) to the total trending index volume ofcobserved in Twitter (resp. Google).
For each topic that has trends in both Twitter and Google, the K-L divergence of the topic trends in two spheres is observed. The K-L divergence of trends for randomly selected topic pairs from two spheres are also compared. This random selection is used as null hypothesis. Fig.1 shows the cumulative distribution function (CDF) of K-L divergences. A notable difference between the two K-L divergence distributions for both single-word topics and multi-words topics can be observed. For example, more than 60% of topic pairs have a K-L divergence less than 1 for the same single-word topics, while this value is only 43% for random selection.

Fig.1 Kullback-Leibler divergence in two spheres
2.1.2 Trending time analysis

Fig.2 Distribution of number of trending days for trends in Twitter and in Google
It is interested that compared with Google, topics in Twitter have a shorter trending time. For example, about 20% of the single-word topics are trending in Twitter for more than 3 days, while this proportion is 40% in Google and 20% of topics are even trending in Google for more than 6 days. This observation suggests that trendiness of topics in Twitter is much more volatile than in Google.
2.1.3 Highly positive trends analysis
Fig.3 plots the distribution of the number of highly positive trends for topics in Twitter and Google. Depending on the value ofα, the proportion of Twitter topics that do not exhibit any highly positive trend varies between 10% and 50% for single-word topics and between 10% and 70% for multi-words topics. Google shows a slightly larger number of highly positive trends than Twitter. For example, there are 30% of the single-word topics and 20% multi-words topics hitting more than 2 highly positive trends in Google withα= 75%, while this percentage in Twitter is about 20% for single-word topics and 10% for multi-words topics. The observation indicates that trending topics have a more stable impact on Google compared with in Twitter.
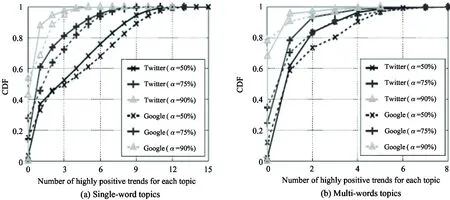
Fig.3 Distribution of number of highly positive trends for trends in Twitter and in Google
The trending days and highly positive trends in Twitter and Google are compared further by checking that whether a similarity exists between them in Table 1, where the likelihood is computed as the probability that if a topic trending (resp. has highly positive trends) in Twitter is also trending (resp. has highly positive trends) in Google based on the crawled dataset.

Table 1 Comparison of trendiness likelihood in Twitter and in Google for all extracted topics
The likelihood that a Twitter trending topic is also trending in Google is 65%, and the likelihood for a Twitter topic that exhibits a highly positive trend withα=50% in Twitter to similarly show a highly positive trend in Google is 70%. However, when picking a Twitter topic experienced a very highly positive trend (α=90%), there is only 30% of chances for that topic to experience the same highly positive trend in Google. While this lower number potentially stems from the high-selection of such topics in Twitter, it also suggests that Twitter trendiness is potentially more sensitive than Google. Given the different nature of usages of the two services, this is a reasonable explanation as Twitter users would potentially be more reactive to other users interests and topics.
2.1.4 Time offset analysis
The above results call for a deeper investigation of the time effect so that researchers can understand whether observed trends in one sphere can find their genesis in the other one. For this, the time offset is introduced to represent the difference between the trending times (resp. highly positive times) in Twitter and in Google for trending topics (resp. topics with highly positive trends). In this study, the time offset is defined as, based on a specific feature of trends (trending or highly positive trends), the difference between the first day this feature is observed in Twitter and the first day it is observed in Google. A positive value indicates that the feature happens first in Google and otherwise, it happens first in Twitter.
Fig.4 and Fig.5 depict the time offsets between trending and highly positive days for single-word topics respectively. It can be found that most of time offsets assemble around 0 where the proportion of time offsets in [-1,1] interval is much larger than other intervals. In particular, more than half of the time offsets between trending days (resp. highly positive days) in Twitter and Google are in [-1,1] interval, indicating that at most a one-day interval separates the trends in these two spheres. The similar results are observed on the multi-words topics and are omitted due to space limitation. These results show that the trendiness in Twitter is likely to be synchronous with the one in Google on daily granularity.

Fig.4 Time offset between the trending days of single-word topics

Fig.5 Time offset between the highly positive days of single-word topics
2.2 How do Web topics behave in Twitter?
2.2.1 Trends Similarity in Alexa and Twitter
Similar to the analysis of Twitter topics in web, the K-L divergences between Alexa trends and Twitter trends are calculated at first. Recall that in Sec.1, it is defined that if topiccis in the top trending list of Alexa at timei, then the trending index volume atiis 100; otherwise, it is 0.
As depicted in Fig.6, if the topic pairs in Alexa and Twitter are randomly selected, the K-L divergences between the two trends are distinctly larger than the ones of same topics, which means the Twitter trends can also be related to the corresponding web trends.

Fig.6 Kullback-Leibler divergence between Alexa trends and Twitter trends
2.2.2 Trending time analysis

2.2.3 Time offset analysis
The time offsets (in hour) between trending times of the same topics in Alexa and in Twitter are depicted in Fig.8, where the positive value indicates that thetrending feature happens first in Twitter and otherwise, it happens first in Alexa. Opposed to the results in Fig.4, the distribution of time offsets in Fig.8 is skewed towards the positive part, e.g. there are more than 65% time offsets are larger than 0 in Fig.8. It can be concluded that although the trendiness in Twitter seems to be synchronous with the one in Google on daily granularity, most of trends of these topics are actually driven by Twitter population in advance, and then spread in web on a finer granularity (such as hourly granularity). This result is also in accordance with the reports in Ref.[13].

Fig.7 Distribution of number of trending hours for Alexa trends and Twitter trends

Fig.8 Time offset between trending hours in Alexa and in Twitter
2.2.4 Rank stability analysis
The rank stability coefficient[14]of trends in Twitter and Alexa is calculated further in order to examine the volatility of trendiness within the two worlds. Given a time framet, the rank stability coefficient for the topNtrending topics in theith(i>1) bin is defined as
(3)
whereSN(i) is the set of topNtrending topics during theithtime frame. The rank stability coefficient has values within [0, 1], where 1 indicates no change and 0 means that all the topics in the list have changed.

Fig.9 Rank stability between Alexa top 20 trending topics and Twitter top 20 trending topics (hourly)
3 Spatial analysis
The interaction of information spreading in microblogs and web interests is not only reflected in time but also in the spatial dimension. It has been observed in Ref.[15] and Ref.[16] that both the topic’s “original” location and the location of the receivers strongly affect the diffusion patterns of the information. This section analyzes the spatial/geographical dimension of the interaction between microblog trends and web interests.
In summary, it is found that large majority of trending topics appear concurrently in not more than 2 countries in both two spheres, which is a strong evidence of the existence of locality of interest in the trendiness of microblogs and web. Besides, it is also observed that more than 60% of the locality of interest of individual topics exhibit similar patterns in Twitter and in Google.
3.1 Locality of interest
The concept of locality of interest is introduced to characterize the geographic characteristics of trending topics. Five countries, US, UK, CA, FR and AU, are chosen to study whether or not topiccis trending in a specific location. The fewer number of different regions a topic is trending in, the more significant the locality of interest will be. To analyze the locality of interest, the trending topics provided by Twitter from Sept. 1st, 2012 to Oct. 31st, 2012 (datasetH) in these 5 countries are used, and the statistics provided by Google Trends for the same topics within the same period are considered.
Fig.10 shows the trending topics overlap in the 5 different countries both in Twitter and Google. It can be observed that the Twitter’s trending topics have a more notable geographical concentration effect compared to Google. About 80% of Twitter trending topics appear in only one country while this proportion in Google is only 47.5%. In both Twitter and Google, the majority of topics get trending in not more than 2 countries (95.6% in Twitter and 65.0% in Google). This indicates clearly that trendiness both in Twitter and in Google is geography-dependent.

Fig.10 The overlap of the trending topics in 5 different countries
3.2 Similarity of locality of interest
After confirming the existence of locality of interest in Twitter and Google, similarity of the two spheres in terms of such locality is checked further. To this end, the notion of interest vector is used. The interest vector of topiccis composed of 5 elements in order,LUS(c),LUK(c),LCA(c),LFR(c) andLAU(c), each of which is binary and 1 represents topicctrending in this country and otherwise the value is 0.
Google Trends provides the top 10 trending countries for each topic, so the appearance in the top list can be used to define the interest vector of Google. That said,Lr(c) in Google is 1 ifris in the Google top country list ofc; otherwise, it is 0. As to Twitter, whether a topic is in the top trending topic list for each country is considered.Lr(c) in Twitter is 1 ifcis in the Twitter top trending topic list of countryr; otherwise, it is 0.

(4)

Fig.11 Distribution of Jaccard index between interest vectors in Twitter and in Google
4 Application
The previous sections found that individual topics in the Twitter sphere and the web sphere share similar trending patterns from both temporal and spatial aspects. Nevertheless, the trendiness in Twitter can be leading for a few hours and is highly unstable compared to the web. The observations suggest the possibility of inferring trending topics from Twitter for the web sphere, which are traditionally provided by search portals like Google.
In fact, the estimation of trends of queries on search engines (such as Google, Bing etc.) is a crucial task in Search Engine Marketing (SEM) analysis. In a typical SEM scenario, advertisers publish their advertisements with the assistant of search engines. In the creation of their advertisements, advertisers choose a keyword or a sequence of keywords (i.e. topics in the context of this paper) relevant to their business, called “ad keywords”, which will trigger the display of their advertisements in the returned search page of these ad keywords. As such, discovering the ad keywords searched frequently in search engine at a time (i.e. trending topics in web) is meaningful to capture high impressions and clicks of online advertisements[17-19]. This section shows that trending topics in Twitter could be used to discover superior Google ad keywords.
To this end, the top 10 trending topics of Twitter in US are sampled for every five minutes during two periods: from October 26th to November 2nd of 2013 and from February 2nd to February 8th of 2014. This results in a trending topic datasetTconsisting of 1,175 unique trending topics. Twitter is also crawled to get the tweets from US during the same time periods ofTusing Twitter’s streaming API. This results in 105,946 tweets randomly sampled by the Twitter API. Based on these tweets, 1,000 words are randomly chosen and are considered as a non-trending topics datasetN. This dataset is used as a reference for the comparison scenario.
For these 2,175 topics obtained from Twitter, the Google AdWords, which provides a “Keyword Planner” tool for helping users evaluate their ad keywords, is queried. The input of the tool is the chosen keyword and the output is the estimation of the number of impressions and clicks brought by this keyword based on the previous week statistics[20]. By querying this tool, the number of daily impressions and the number of daily clicks of each topic in US for the 10 following days after the topic is sampled from Twitter are obtained.
Fig.12 shows the CCDF (complementary CDF) of the average estimated number of impressions and clicks returned by “Keyword Planner” for trending topics and non-trending topics in Twitter during the considered 10 days. A significant gap between the distribution functions in terms of both impressions and clicks can be observed. There are a high volume of impressions/clicks for the trending topics. For example, 2% of the trending topics have more than 200,000 estimated impressions while none of the non-trending ones can reach this volume. The results confirm that trendiness in Twitter can be used to infer adwords with high impressions and clicks in SEM.

Fig.12 The distribution of average estimated number of impressions/clicks on Google AdWords for trending and non-trending topics in Twitter during the 10 days
Notably, although “Keyword Planner” provides, based on previous week statistics, official estimates for impressions and clicks on Google AdWords platform, obtaining an up-to-date information about these values is challenging for advertisers simply because of the one week blackout period of “Keyword Planner”. However, with the monitoring of Twitter, it can be shown here that advertisers can figure out the current market “status” of Google AdWords on a fine granularity (hours) basis.
5 Related work
Some studies focused on the temporal analysis, i.e. the co-occurrence in close time interval of popularity growth of resources and the diffusion of information in online social media. Sadikov, et al. in Ref.[21] used the features from online blogs and comments to predict the corresponding movies sales. Authors in Ref.[3] studied the correlation between the popularity of videos on a User Generated Content website and the spread of the video URLS by tweets. In Ref.[22], Teevan, et al. compared “simultaneous” search queries over microblogs platforms and on search engines. Kairam, et al. in Ref.[13] found that search and social media activity tend to follow similar temporal patterns. Giummole, et al. found that social trends fired by Twitter may lead to web hot trends derived from Google[23].
Other studies targeted the spatial dimension, i.e. the relationship between the location where a message is published and the scope of its diffusion. Brodersen, et al. found that social sharing generally widens the geographic reach of a video content[15]. Tsou, et al. in Ref.[16] introduced a new research framework for analyzing the spatial distribution of web pages and social media (Twitter) messages.
Among the previous work, the most similar one is the work in Ref.[13], where the researchers have found that social media activity around trending events on Twitter tends to lead query activity on search engines by 4 or 5 hours. However, the work of this paper has shown that the trendiness in Twitter can not only precede for a few hours but also highly unstable compared to the one in web, which indicates that the trending topics could be used as promising adwords in SEM and besides, and the data collected from Google AdWords is used to validate the conjecture. To the best of our knowledge, this study provides the first discussion about the usage scenarios in SEM based on such comparison.
6 Conclusion
This paper has compared the trending topics in Twitter and web (i.e. Google and Alexa) by considering both the temporal and spatial perspectives. It is found that the trending topics in Twitter and search in web tend to follow similar temporal patterns and that the trendiness in Twitter can precede by a few hours. However, trendiness is highly unstable in Twitter where top trending lists change more frequently. Besides, there is a geographical concentration effect of interest in both spheres. The trending “localities” are similar in the two spheres as well. Finally, the paper shows that these observations can be used for a “smart” predictive choice of adwords in SEM.
The ongoing work is to design a predictive statistical model. The latter should take into account the social graph structure and the multi-dimension of the topics to proactively react to prior observations from one of the spheres to accurately predict the future in the otherone.
Reference
[1] Rodrigues T, Benevenuto F, Cha M, et al. On word-of-mouth based discovery of the web. In:Proceedings of the ACM SIGCOMM Conference on Internet Measurement Conference, Berlin, Germany, 2011. 381-396
[2] Antoniades D, Polakis I, Kontaxis G, et al. Web: The web of short urls. In:Proceedings of the ACM International Conference on World Wide Web, Hyderabad, India, 2011. 715-724
[3] Wang Z, Sun L, Wu C, et al. Guiding internet-scale video service deployment using microblog-based prediction. In: Proceedings of the IEEE International Conference on Computer Communications, Orlando, USA, 2012. 2901-2905
[4] Alexa. Alexa website. https://www.alexa.com:Alexa, 2015
[5] Google. Helper. https://support.google.com/trends:Google, 2015
[6] Twitter. Twitter helper. https://support.twitter.com:Twitter, 2015
[7] Google.Stopword.http://code.google.com/p/stop-words:Google, 2015
[8] Blei D M, Ng A Y, Jordan M I. Latent dirichlet allocation.TheJournalofmachineLearningresearch, 2003, 3:993-1022
[9] Yang J, Leskovec J. Patterns of temporal variation in online media. In:Proceedings of the ACM International conference on Web Search and Data Mining, Hong Kong,China, 2011. 177-186
[10] Google.Googletrends.http://www.google.com/trends:Google, 2015
[11] Zipf G K. Human Behaviour and the Principle of Least-Effort. Cambridge: Addison-Wesley Publishers, 1949
[12] Kullback S, Leibler R A. On information and sufficiency.TheAnnalsofMathematicalStatistics, 1951, 22(22): 79-86
[13] Kairam S R, Morris M R, Teevan J, et al. Towards supporting search over trending events with social media. In:Proceedings of the AAAI International Conference on Web and Social Media, Cambridge, USA, 2013. 1-9
[14] Lempel R, Moran S. Rank-stability and rank-similarity of linkbased web ranking algorithms in authority-connected graphs.InformationRetrieval, 2005, 8(2):245-264
[15] Brodersen A, Scellato S, Wattenhofer M. Youtube around the world: geographic popularity of videos. In: Proceedings of the ACM International Conference on World Wide Web, Lyon, France, 2012. 241-250
[16] Tsou M H, Yang J A, Lusher D, et al. Mapping social activities and concepts with social media (twitter) and web search engines (yahoo and bing): a case study in 2012 US presidential election.CartographyandGeographicInformationScience, 2013, 40(4):337-348
[17] Joshi A, Motwani R. Keyword generation for search engine advertising. In: Proceedings of the IEEE International Conference on Data Mining, Hong Kong, China, 2006. 490-496
[18] Chen Y, Xue G R, Yu Y. Advertising keyword suggestion based on concept hierarchy.In:Proceedings of the ACM International Conference on Web Search and Data Mining, New York, USA, 2008. 251-260
[19] Thomaidou S, Vazirgiannis M. Multiword keyword recommendation system for online advertising. In: Proceedings of the IEEE International Conference on Advances in Social Networks Analysis and Mining, Taiwan, China, 2011. 423-427
[20] Google. Keywordplanner. http://adwords.google.com/ko/Keywor-dPlanner:Google, 2015
[21] Sadikov E, Parameswaran A, Venetis P. Blogs as predictors of movie success. In: Proceedings of the AAAI International Conference on Web and Social Media, San Jose, USA, 2009.1-9
[22] Teevan J, Ramage D, Morris M R. Twittersearch: A comparison of microblog search and web search. In: Proceedings of the AAAI International Conference on Web and Social Media, Barcelona, Spain, 2011. 35-44
[23] Giummole F, Orlando S, Tolomei G. A study on microblog and search engine user behaviors: How twitter trending topics help predict google hot queries.HUMAN, 2013, 2(3): 195
Wang Dong, born in 1987. He is a Ph.D candidate at the Institute of Computing Technology (ICT), Chinese Academy of Sciences (CAS). His research area includes network measurement and analysis of OSNs.
10.3772/j.issn.1006-6748.2016.02.006
①Supported by the Beijing Municipal Natural Science Foundation (No. 2015AA010201).
②To whom correspondence should be addressed. E-mail: wangdong01@ict.ac.cnReceived on Mar. 17, 2015
 High Technology Letters2016年2期
- High Technology Letters的其它文章
- Identity-based proxy multi-signature applicable to secure E-transaction delegations①
- An optimizing algorithm of static task scheduling problem based on hybrid genetic algorithm①
- Quotient space model based on algebraic structure①
- Distributed cubature Kalman filter based on observation bootstrap sampling①
- Intelligent outdoor video advertisement recommendation system based on analysis of audiences’ characteristics①
- Abnormal activity detection for surveillance video synopsis①