Numerical evaluation of passive control of shock wave/boundary layer interaction on NACA0012 airfoil using jagged wall
Mojtaba Dehghan Manshadi·Ramin Rabani
RESEARCH PAPER
Numerical evaluation of passive control of shock wave/boundary layer interaction on NACA0012 airfoil using jagged wall
Mojtaba Dehghan Manshadi1·Ramin Rabani2
Shock formation due to flow compressibility and its interaction with boundary layers has adverse effects on aerodynamic characteristics,such as drag increase and flow separation.The objective ofthispaperis to appraise the practicability ofweakening shock waves and,hence,reducing the wave drag in transonic flightregime using a two-dimensional jagged wall and thereby to gain an appropriate jagged wall shape for future empirical study.Different shapes of the jagged wall,including rectangular,circular,and triangular shapes,were employed.The numericalmethod was validated by experimental and numerical studies involving transonic flow over the NACA0012 airfoil,and the results presented here closely match previous experimental and numerical results.The impact of parameters,including shape and the length-to-spacing ratio of a jagged wall,was studied on aerodynamic forces and flow field.The results revealed that applying a jagged wall method on the upper surface of an airfoil changes the shock structure significantly and disintegrates it,which in turn leads to a decrease in wave drag.It was also found that the maximum drag coefficient decrease ofaround 17%occurswith a triangularshape,while the maximum increase in aerodynamic efficiency(lift-to-drag ratio)of around 10%happens with a rectangular shape at an angle of attack of 2.26◦.
✉ Mojtaba Dehghan Manshadi mdmanshadi@mut-es.ac.ir
Ramin Rabani ramin-rabani@stu.yazd.ac.ir
1Mechanical and Aerospace Engineering Department,Malek-Ashtar,University of Technology,Esfahan,Iran
2Department of Mechanical Engineering,Yazd University,Yazd,Iran
Jagged wall·Passive flow control·Shock wave/boundary layer interaction·Aerodynamic efficiency
1 Introduction
Transonic flows occur when there is mixed sub-and supersonic local flow in the same flow field(typically with free stream Mach numbers from M a=0.6 to M a=1.2).In this transonic flight regime,a dramatic increase in the drag takes place as the drag divergence Mach number is reached. The most common description of a transonic flow is when there is a supersonic“bubble”totally imbedded in a subsonic flow.The supersonic bubble terminated by a shock wave produceswave drag.Soon aftera shock wave appearsin the flow,the drag will increase rapidly with an increasing free-stream Mach number,leading to a destructive drag rise.Therefore,the control of shock waves and decrease in their adverse effects,including drag increase,flow separation,instability,and irregular fluctuations,are very important in aerodynamics.Flow controlinvolves passive oractive devices to effecta beneficialchange in wall-bound orfree-shearflows.Whether the task is to delay/advance transition,suppress/enhance turbulence,or prevent/provoke separation,useful end results include drag reduction,lift enhancement,mixing augmentation,and flow-induced noise suppression[1].
As a scientific discipline and as a technological curiosity,flow control is perhaps more hotly pursued by scientists and engineers than any other areas in fluid mechanics.One of the first ideas of passive control of shock wave/boundary layer interaction was to use a porous surface and a cavity underneath at the shock wave location.In this regard,Bahi et al.[2]undertook an experimental study to control the shock wave on the top surface of a circular arc and supercritical airfoils.Their results showed that the circulation of deceler-ated flow through the porous surface from the downstream to the upstream terminating shock wave location lowered the pressure distribution over the downstream region and minimized the flow separation.Savu and Trifu[3]investigated the passive control of a transonic airfoil by setting up a secondary flow through the porous surface(between the external region and the internal cavity of the airfoil)in both directions.Two different situations were considered for the secondary flow through the porous wall of the airfoil. In the first situation,called a ventilated cavity,the pressure inside the airfoil was equal to the static pressure of the free stream.In the second situation,called an unventilated cavity,there was no special connection between the internal airfoil cavity and the free stream and the pressure inside the cavity differed from free-stream pressure.The results stated that the pressure jump(shock wave)intensity on thick airfoils in the transonic regime was considerably reduced. Krogmann and Stanewsky[4]carried out an investigation of the effects of local boundary layer suction on the shock wave/boundary layer interaction.Three different geometries were considered in this regard,and a comparison of the three models indicated that the local boundary layer suction in the shock region delayed the developmentofshock-induced separation and considerably improved the overall aerodynamic characteristics.Raghunathan[5]experimentally studied the effect of flow passive control on the pressure fluctuations of transonic flow around an airfoil.To analyze the effects of passive shock wave/boundary layer control,a wall-mounted circular-arc half-model was employed.The result of using a perforated surface on the model was a noticeable decrease in the pressure fluctuations.Bohning[6]undertook a parametric and experimental investigation on the passive control of shock wave/boundary layerinteraction and studied the effect of various parameters,such as cavity length,cavity location,porosity value,and blowing type,on the lift and drag coefficients.The results revealed that the tangential added momentum caused a significant reduction of the momentum thickness,leading to a remarkable reduction of the viscous drag and subsequently of the total drag of the profile.
Pressure jump boundary condition is an appropriate method for simulating the passive control of shock waves. Doerffer and Szulc[7,8]simulated a perforated surface by proposing an equation to calculate the flow Mach number in the entrance holes of the perforated surface.This method of shock wave disintegration indicated that the substitution of a shock wave by a gradual compression changes completely the source of high-speed impulsive noise and carries the potential of its reduction.
Porous,compliant,and anisotropic coatings is another method of shock wave control.Venkataraman and Bottaro[9]studied the effect of this method on the fluid dynamical performance of a NACA0012 airfoil,under conditions of boundary layer separation.They found by a numerical parametric analysis thatthe coating modified the vortex shedding process,thereby contributing to enhanced performance.
Some researchers have also studied the effect of a passive control method on aerodynamic parameters[10,11],the reduction of stall effects[12,13],and irregular fluctuation and its amplitude[14].
In the majority of earlier studies,applying a passive control method was rather complicated and hard to implement,while adopting an uneven wall on the airfoil upper surface is an effective,simple,and applicable geometric method that can be used to control shock wave/boundary layer interactions and achieve higher aerodynamic performance. Therefore,in the present study a jagged wall with different shapes(rectangular,circular,and triangular)is employed for numerical simulation and its effects are analyzed on the flow field properties and aerodynamic characteristics.Because thisnovelgeometric method can be simply applied forempirical models,it can be considered for accurate modeling,optimization,and parametric study.
2 Modeling approach
2.1Governing equations
Transonic flow past an airfoil is governed by the compressible and unsteady state form of the fluid flow conservation equations,which include averaged Navier-Stokes equations,along with a total energy equation,including viscous dissipations.These equations are also coupled to a set with the perfect gas law.The governing equations can therefore be written in their compact Cartesian form as follows

where u,p,ρ,E,and keffare respectively average velocity,average pressure,density,total energy,and effective thermal conductivity,which equal the sum of laminar and turbulence thermal conductivities.
2.2Turbulence modeling

where the term k in Eq.(6)is the kinetic energy of the turbulence.To solve the system of equations,the term μtmust be calculated.The standard k-ω turbulence model is an empirical model based on model transport equations for the turbulence kinetic energy(k)and the specific dissipation rate(ω)[16].The k-ω shear-stress transport(SST)turbulence model was developed by Menter[17]to effectively blend a robust and accurate formulation of the k-ω turbulence model,which isapplied to the near-wallregion,with the freestream independence of the k-ε turbulence model,which is suitable in the far field.In fact,this model is employed to confer simultaneously the advantages of the k-ω turbulence model in low-Reynolds-number regions and the k-ε turbulence model in high-Reynolds-number regions.These features make the k-ω-SST turbulence model a comprehensive and reliable model for a wide range of flows,such as adverse pressure gradientflows,airfoils,and transonic shock waves.Therefore,in the present study the k-ω-SST turbulence model is employed for numerical simulation.
In the present study,the commercial RANS-based code ANSYS/FLUENT 15 was used;it offers a range of fully turbulent and transport equation-based transition models,including the k-ω-SST model.Free-stream boundary conditions were employed in the upstream,downstream,and outer boundaries.No-slip boundary conditions were used at the solid surfaces of the airfoil.In the numerical simulations,second-order upwind discretization in space was used,and the resulting system of equations was then solved using the couple-implicit procedure until a convergence criterion of O(5)reduction in all dependent variable residuals was satisfied.It should be noted that a free-stream turbulence level of Tu=0.1%was used.
3 Results and discussion
3.1Grid study and validation of transient flow past NACA0012 airfoil

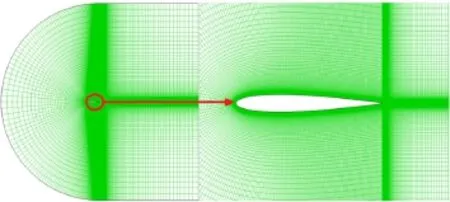
Fig.1 Schematic of domain and its boundary conditions used for numerical simulation.C denotes the length of the airfoil chord
Before applying the method of flow control,it is necessary to assess the ability of code to predict transonic flow past a popular,classic NACA0012 profile.The NACA0012 is the most exhaustively tested airfoil in wind tunnels in the history of aviation,having the greatest available experimental database.One of the well-known test cases that experimentally studied transonic airfoils is the work of Harris[18]at a Mach number of 0.8 and an angle of attack of 2.26◦.This flow condition is typical for the advancing blade of a helicopter rotor.In the present study,based on the experimental conditions of Harris[18],the flow parameters were chosen to obtain a Reynolds numberof9×106.AC-type grid topology was used fornumericalcalculations.Figure 1 depicts the domain and boundary conditions used fornumericalcalculations.The average distance from airfoil to far-field boundary was approximately 16 times the airfoil chord.
Because the accurate prediction ofa transition necessitates good resolution in the boundary layer,the wall coordinate y+of the first grid point off the body is ensured to be less than 1.In the present study,different sized grids with 40000,60000,80000,and 100000 quadrilateral cells were used to ensure grid independence of the calculated results.This was achieved by obtaining solutions with an increasing grid size until a stage was reached where the solution exhibited negligible change with a further increase in the number of cells,as shown in Table 1.In Table 1,the distribution of numerical data obtained from the transition models in terms of lift and drag coefficients of the NACA0012 airfoil versus grid size is given at α=2.26◦and Mach number 0.8.According to Table 1,the grid size thatgives a grid-independentresultwas selected to be 80000(Fig.2).
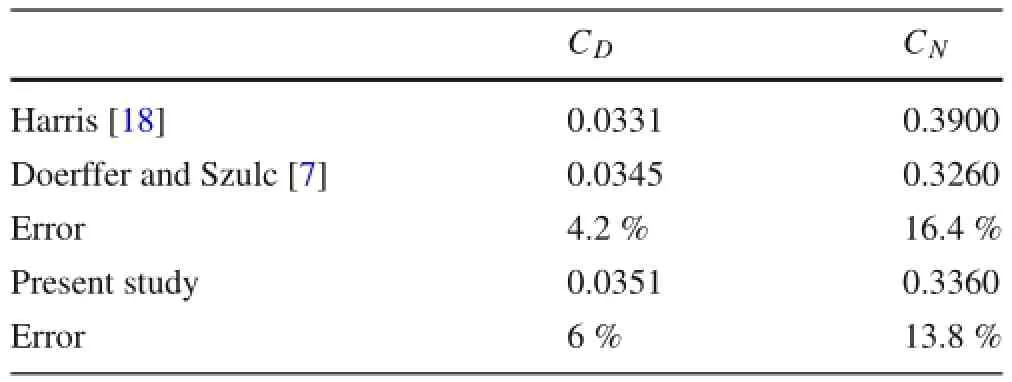
To validate the present numerical method,the variation of drag(CD)and normal force(CN)coefficients for the present study,the numericalresultsofDoerfferand Szulc[7],and the experimentaldata ofHarris[18]are presented in Table 2.Thenumerical results of both the present study and the study of Doerfferand Szulc[7]were compared with the experimental data of Harris[18](the data of Harris[18]were used forerror calculation).

Table 1 Lift and drag coefficients of the NACA0012 at α=2.26,Ma =0.8

Fig.2 Structured grid of NACA0012 airfoil for computational fluid dynamics(CFD)analysis

Fig.3 Pressure coefficient distribution over NACA0012 airfoil

Table 2 Drag and normal force coefficients of NACA0012 at α= 2.26◦,Ma=0.8
A comparison of the pressure coefficient distributions on the upper and lower surfaces of the airfoil reveals that the presentnumericalresults closely match the experimentaland CFD results(Fig.3).
Additionally,Fig.4 indicates the Mach number distribution around the airfoil in the present study and the numerical study of Doerffer and Szulc[7]at α=2.26◦.A high Mach number of free oncoming flow causes a strong acceleration of flow around the airfoil and the generation of a large supersonic region with a shock wave located near 50%of the chord.The shock is also strong enough to generate a flow separation extended to the trailing edge,predicted also by the computation results of Doerffer and Szulc[7].
3.2Grid study and validation of transient flow past NACA0012 airfoil with passive control of shock wave by jagged wall
First,to validate the present numerical method and evaluate its ability to predict a flow past the transonic NACA0012 airfoil in the presence of passive control methods,the experimental data of Mineck and Hartwich[19]were used.For this purpose,that part of the test of Mineck and Hartwich test that relates to the tests of a NACA0012 airfoil with a passive control of full-chord porosity(Fig.5)was considered.To simulate the porous upper surface of the airfoil,the method proposed by Doerffer and Szulc[7]was used.
Figure 6a,b indicates the pressure coefficient distribution over the NACA0012 airfoil at angles of attack of 2◦and 5◦(α=2◦and α=5◦)and Ma=0.8,with and without the passive control method.As is obvious,employing full chord perforation resulted in smoother pressure variation and,consequently,a weaker shock wave at both angles of attack. Overall agreement with the experimental data is also satisfactory,specifically for the perforation method.
Regarding the aim ofthe presentstudy,which is the investigation of the jagged wall effect on aerodynamic efficiency,three differentshapes ofjagged wallwere applied to the upper surface of an airfoil.The geometry of the jagged wall on a NACA0012 airfoilis shown in Fig.7.In this figure,W and P are respectively the length and spacing of the jagged wall.In all cases of the study,the depth of the jagged wall was considered to be 2.5%of the airfoil chord length.The jagged wall on the upper surface was also located between 0.2 and 0.8 of the airfoil chord.

Fig.4(Color online)Mach number distribution around airfoil in the present study(left)and the study of Doerffer and Szulc(right)[7]at Ma= 0.8,α=2.26◦

Fig.5 NACA0012 airfoil with full porous upper surface in transonic flow[19]
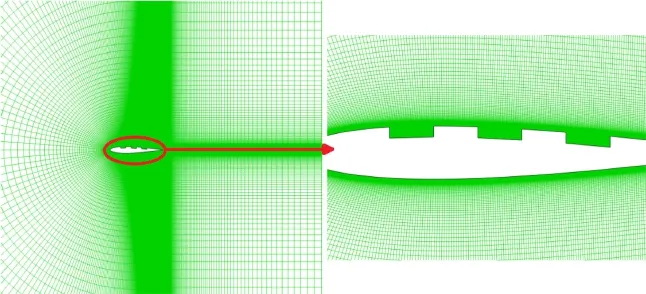
Figure 8 shows a view of the grid density around the air foil and jagged wall.To encompass small elements likely to emerge in the partition zone,the mesh was designed to be sufficiently dense to take into consideration the participation of these elements in detached flows(i.e.when vortexes separate from theiredges).Thus,in the vicinity ofthe jagged wall the mesh had the highest density while becoming less dense with the increasing distance from the wall.Different sized grids with 40000,60000,80000,and 100000 quadrilateral cells were used for the passive control method to ensure grid independence of the calculated results.In Table 3,the variation of drag coefficient and aerodynamic efficiency of the NACA0012 airfoil versus grid size was given at α=2.26◦and W/P=3(case 4).Finally,from the results of the gridindependency test,the grid with the number of cells,80000,was selected as the optimum grid for carrying out further calculations.

Fig.6 Pressure coefficient distribution over NACA0012 airfoil without and with full chord perforation.a α=2.26◦.b α=5.26◦

Table 3 Drag coefficient and aerodynamic efficiency of the NACA-0012 at α=2.26◦,W/P=3(case 4)

Table 4 Test cases of jagged walls
The variation ofthe length-to-spacing ratio(W/P)is given in Table 4(C denotesthe length ofthe airfoilchord).In case 3, the length-to-spacing ratio equals 1(W/P=1).Allsimulation was carried out at a Mach number of 0.8 and angles of attack of 2.26◦and 5.26◦,which are typical for the advantage blade of a helicopter rotor.
To better understand the effects of this passive control method,the variation of the pressure coefficient,friction coefficient,and Mach number distribution around the simple and jagged wallNACA0012 airfoils were studied.The Mach numberdistribution around the airfoilis shown in Fig.9.Itis found from the figure that applying the jagged wall method on the uppersurface ofthe airfoilchanges the shock structure significantly and diminishes its strength,which in turn leads to a decrease in wave drag.This shock disintegration is more pronounced with a triangular shape of jagged wall than with other shapes.It is worth mentioning that with the triangular shape,a pressure decrease is also observed at the lower surface of the airfoil,which greatly reduces the lift force.
Figures10 and 11 indicate the streamlines nearthe surface of the airfoil.As expected,for the simple airfoil(case a),the interaction between the shock wave and boundary layerleads to a rapid increase in the boundary layer thickness and the formation of a large separation bubble,especially at an angle of attack of 5.26◦,but applying the jagged wall on the upper surface of the airfoil causes the large separation bubble to disintegrate and break down into severalweak bubbles,which in turn causes a gradual reduction in the Mach number and a gradual increase in the static pressure rather than abrupt changes associated with a strong normal shock wave.The weaker normal shock wave results in a lower wave drag,in contrast to the simple airfoil.

Fig.8 Grid density around the jagged wall

Fig.9(Color online)Mach number distribution around.a Simple.b Triangular.c Rectangular jagged wall.d Circular jagged wall NACA0012 airfoil at α=2.26o(case 4)

Fig.10 Streamlines around.a Simple.b Rectangular.c Circular.d Triangular jagged wall at angle of attack of 2.26◦
In Fig.12 the pressure coefficientvariation overthe airfoil is indicated for simple and jagged wall airfoils.Employing a rectangularjagged wallshape on the uppersurface ofthe airfoil increases the pressure coefficient upstream of the shock wave and decreases it downstream of the shock wave.Based on the illustrations in Fig.13,the angle between the flow direction and the average surface slope upstream ofthe shock wave is smaller than thatdownstream ofthe shock wave,and the effect of the downstream pressure variation on the lift force is less than that of the upstream pressure variation. Additionally,the effect of the upstream pressure variation on the drag force is negligible compared with the effects of the downstream pressure variation.Consequently,an increase in the upstream pressure variation leads to a decrease in the lift force,and an increase in the downstream pressure variation leads to a decrease in the form drag.
Figure 14 demonstrates the friction coefficientvariation in the upper surface of the simple and jagged wall airfoils.The jagged wall control method causes the friction coefficient todecrease upstream of the shock and to increase downstream of the shock compared with the simple airfoil.On the other hand,owing to the broaderarea offriction decrease compared with the area of friction increase,the friction drag decreases. With regard to the simultaneous decrease offormand friction drags,the total drag also decreases.

Fig.11 Streamlines around.a Simple.b Rectangular.c Circular.d Triangular jagged wall at angle of attack of 5.26◦

Fig.12 Pressure coefficient distribution over NACA0012 airfoil at α=2.26o(case 4)

Fig.13 Geometry effects of normal shock upstream and downstream

Fig.14 Friction coefficient variation on upper surface of NACA0012 airfoil at α=2.26o(case 4)
In Fig.15 the pressure coefficient variation at the upper surface ofthe simple and the jagged wallairfoils is compared. In the triangular shape,the pressure coefficient increase upstream of the shock is higher than the two other shapes,which decreases the lift force.However,in comparison with the rectangular and circular shapes,the triangular shape shows almost a higher decrease in the pressure coefficient downstream of the shock,which in turn decreases the form drag.Anotherfactorthatadversely affects the liftforce in the triangularshape is the pressure decrease on the lowersurface of the airfoil compared with the two other shapes(Fig.16). According to Fig.13,although the passive control methodwas applied on the upper surface ofthe airfoil,with regard to Figs.15 and 16,itinfluences the flow field around the airfoil,especially itsuppersurface and to a lesserextentits lowersurface,which depends on the extent of shock disintegration on the upper surface.Because the triangular shape changes the shock structure more than the other two shapes,the adverse effect of the lower surface on the pressure distribution and lift force is much more discernible.

Fig.15(Color online)Pressure distribution over upper surface of NACA0012 airfoil at α=2.26ofor different shapes of jagged wall(case 4)

Fig.16(Color online)Pressure distribution over lower surface of NACA0012 airfoil at α=2.26ofor different shapes of jagged wall(case 4)
The Mach number distribution around the jagged wall NACA0012 airfoil is presented in Fig.17 for different shapes and length-to-spacing ratios of the jagged wall.With an increase in the length-to-spacing ratio,the shock system is affected and disintegrates at large length-to-spacing ratios(cases 4 and 5),resulting in a considerable wave drag decrease.The same result is also observed at a length-tospacing ratio of 1 for W=C/10(Fig.18).It should be noted that this shock disintegration leads to a decrease in the aerodynamic efficiency of airfoil,which is shown in Figs.19 and 20.
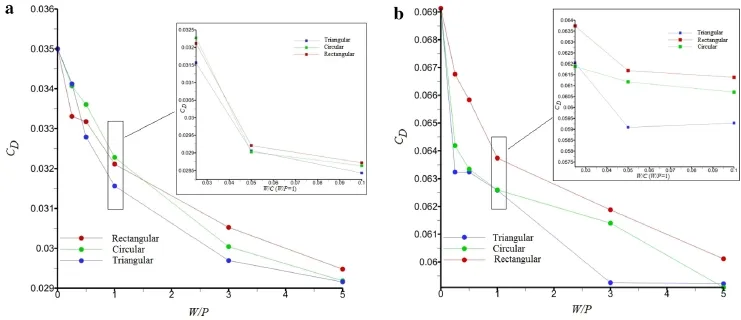
Figure 19 shows an assessmentofthe effectsofthe present passive control method on the variation of drag coefficient at two different angles of attack.It is found from the figure that applying the jagged wall to the upper surface of the airfoil decreases drag coefficient.The maximum drag coefficient decrease of around 17%occurs with a triangular shape at an angle of attack of 2.26◦,and a decrease of around 15% occurs at an angle of attack of 5.26◦(case,W/P=1.0).For a more accurate study of the effects of this passive control method on aerodynamic characteristics,the variation of the aerodynamic efficiency,defined as the ratio ofliftforce coefficientto the drag force coefficient,is indicated in Fig.20.For W/P<1,with an increase in the length-to-spacing ratio,the aerodynamic efficiency indicates an increasing trend.But for W/P>1,the aerodynamic efficiency shows a decreasing trend.In W/P=1 with an increase in the length/spacing of the jagged wall,the aerodynamic efficiency decreases.This implies that,although in all length-to-spacing ratios the drag force coefficient decreases and the aerodynamic efficiency increases,the reduction ofthe liftforce coefficientsuppresses the increasing trend of the aerodynamic efficiency and even decreases its value atlarge length-to spacing ratios.The maximum increase of around 10%in the aerodynamic efficiency happens with a rectangular shape at an angle of attack of 2.26,and an increase of around 14%occurs at an angle of attack of 5.26.
4 Conclusion
In this study a numerical simulation was carried out to investigate the effect of the passive shock wave control method,including a jagged wall with different shapes,applied to the upper surface of a NACA0012 airfoil,on the pressure field,Mach number distribution around the airfoil,and aerodynamic characteristics,including drag force and lift-to-drag ratio(aerodynamic efficiency),and thereby to achieve a desired jagged wall shape for future empirical study.The obtained results are as follows
(1)Applying the jagged wall method on the upper surface of an airfoil changes the shock structure significantly and diminishes its strength,which in turn leads to a decrease in wave drag.This shock disintegration is more pro-nounced with a triangular jagged wall shape than other shapes.

Fig.17(Color online)Mach number distribution around NACA0012 airfoil for different shapes of jagged wall at α=5.26o

Fig.18(Color online)Mach number distribution around NACA0012 airfoil for different shapes of jagged wall at W/P=1,α=5.26o

Fig.19 Drag coefficient variation for different W/P at a α=2.26oand b α=5.26o

Fig.20 Aerodynamic efficiency variation for different W/P at a α=2.26o and b α=5.26o
(2)Employing the jagged wall method on the upper surface of an airfoil increases the pressure coefficient upstream of the shock wave and decreases its value downstream of the shock wave.
(3)The jagged wall passive control method decreases the friction coefficient upstream of the shock wave and increases it downstream of the shock wave compared with a simple airfoil.On the other hand,owing to the broader area of friction decrease compared with the area of friction increase,the friction drag decreases.
(4)Although the passive control method was applied to the uppersurface ofthe airfoil,itaffects the flow field around the airfoil,especially its upper surface and,to a lesser extent,its lower surface,which depends on the extent of shock disintegration on the upper surface.
(5)The maximum drag coefficientdecrease,ofaround 17%,occurs with a triangular shape at an angle of attack of 2.26◦;the decrease is around 15%at an angle of attack of 5.26◦(W/P=1.0).
(6)At all length-to-spacing ratios,the drag force coefficient decreases,which in turn increases the aerodynamic efficiency.But the reduction in the lift force coefficient suppresses the increasing trend of the aerodynamic efficiency and even decreases its value at large length-tospacing ratios.
(7)The maximum increase in aerodynamic efficiency,of around 10%,happenswith a rectangularshape atan angle of attack of 2.26◦;an increase of around 14%occurs at an angle of attack of 5.26◦.
1.Gad,M.:Modern developments in flow control.Appl.Mech.Rev. 49,365-379(1996)
2.Bahi,L.,Ross,J.M.,Nagamatsu,T.:Passive shock wave/boundary layer control for transonic aerofoil drag reduction.AIAA 83,0137(1983)
3.Savu,G.,Trifu,O.:Porous aerofoils in transonic flow.AIAA J.22,989-991(1984)
4.Krogmann, P.,Stanewsky, E.:Effects of suction on shock/boundary-layer interaction and shock-induced separation.J.Aircr.22,37-42(1985)
5.Raghunathan,S.:Pressure fluctuation measurements with passive shock/boundary layer control.AIAA J.25,626-628(1987)
6.Bohning,R.:Passive Control of Shock/Boundary Layer Interaction.Springer,University of Karlsruhe(TH),Vienna(1996)
7.Doerffer,P.,Szulc,O.:Shock wave smearing by wall perforation. Arch.Mech.58,543-573(2006)
8.Doerffer,P.,Szulc,O.:Passive control of shock wave applied to helicopter rotor high-speed impulsive noise reduction.Inst.Fluid-Flow Mach.Polish Acad.Sci.14,297-305(2010)
9.Venkataraman,D.,Bottaro,A.:Flow separation control on a NACA0012 airfoil via a porous,compliant coating.IFMBE Proc. 31,52-55(2010)
10.Mabey,D.G.:Flow unsteadiness and model vibration in wind tunnels at subsonic and transonic speeds.Aeronautical Research council,London.No.1155(1971)
11.Sugmiller,N.L.,Marvin,J.G.,Levy,L.L.:Steady and unsteady transonic flow.AIAA J.16,1262-1270(1978)
12.Theide,P.,Krogmann,P..Stanewsky,E.:Active and passive shock/boundary layerinteraction controlon supercriticalaerofoils. AGARD-CP-365,24-1 to 24-13(1984)
13.Lock,R.C.,Williams,B.R.:Viscous-inviscid interactions in external aerodynamics.Prog.Aerosp.Sci.24,51-171(1987)
14.Chen,C.L.,Chow,Y.C.,Holst,T.L.,et al.:Numerical study of porous aerofoils in transonic flow.NASA TM 86713(1985)
15.Bartosiewicz,Y.,Aidoun,Z.,Desevaux,P.,et al.:Numerical and experimental investigations on supersonic ejectors.Int.J.Heat Fluid Flow 26,56-70(2005)
16.Wilcox,D.C.:Turbulence Modeling for CFD,3rd edn.DCWIndustries Inc,California(2006)
17.Menter,F.R.:Two-equation eddy-viscosity turbulence models for engineering applications.AIAA J.32,1598-1602(1994)
18.Harris,C.D.:Two-dimensional aerodynamic characteristics of the NACA0012 airfoil.In the Langley 8-foottransonic pressuretunnel. NASA Technical Memorandum 81927(1981)
19.Mineck,R.E.,Hartwich,P.M.:Effect of full-chord porosity on aerodynamic characteristics of the NACA 0012 airfoil.NASA Technical Paper 3591(1996)
11 July 2015/Revised:10 March 2016/Accepted:4 May 2016/Published online:2 September 2016
©The Chinese Society of Theoretical and Applied Mechanics;Institute of Mechanics,Chinese Academy of Sciences and Springer-Verlag Berlin Heidelberg 2016
- Acta Mechanica Sinica的其它文章
- Gradient systems and mechanical systems
- Contact force and mechanical loss of multistage cable under tension and bending
- Numerical study on the deformation of soil stratum and vertical wells with gas hydrate dissociation
- Reliability assessment on interfacial failure of thermal barrier coatings
- Nonlinear integral resonant controller for vibration reduction in nonlinear systems
- Numerical analysis of stress distribution in the upper arm tissues under an inflatable cuff:Implications for noninvasive blood pressure measurement

