聚焦形貌恢复方法模型设计
2016-08-01 09:13:13HAMAROV
中国光学 2016年4期
HAMAROV
Ivana*,
M
D Petr, HORV
TH Pavel
(捷克科学院物理研究所与帕拉茨基大学光学联合实验室,奥洛穆茨 772 07)
聚焦形貌恢复方法模型设计
Ivana*,
TH Pavel
(捷克科学院物理研究所与帕拉茨基大学光学联合实验室,奥洛穆茨 772 07)
摘要:采用基于拉普拉斯算符聚焦形貌恢复方法,提出了模拟目标深度测量的数值模型。数值模拟的核心是基于通过几何光学预测的理想图像的卷积与透镜广义孔径函数的多色点扩散函数,即用聚焦误差替代抛物线圆柱形貌或高斯函数。该模型可以使用基于聚焦形貌恢复方法的传感器真实组件参数、光源光谱、光学系统离差、相机的光谱灵敏度。提出了光学系统离差(消球差、消色差、色差)对确定目标表面形貌的精确度和可靠性的影响。结果表明,该模型可以有效提高实验效率,缩短时滞,降低成本。
关键词:模拟模型;三维目标散焦;聚焦形貌恢复方法;点扩散函数
1Introduction
The shape from focus method[1-4]is the technique used in the image processing for the obtaining depth-maps of the object. The principle of the method is based on the relation among the object distance, focal distance of the lens, and the image distance, which is given by the Gaussian lens law. In terms of geometrical optics, each point in the object plane is projected onto a single point in the image plane, and the focused image is obtained. However, in terms of wave optics, which involves wave character of light, a focused image “point” is no longer a point, but rather a spot. When the detection plane is displaced from the image plane, the defocused(blurred) image is obtained. During the measuring procedure, an images sequence of the same scene of the object under investigation is acquired by moving the object along the optical axis. The depth of the object is determined through searching for the position of the object where every object point is imaged sharply. For the determination of the focused image at each image point, the Sum-Modified Laplacian(SML) operator to the images sequence is applied[1].
The imaging performance of an optical system(image defocusation) is described by the convolution of the ideal image intensity(predicted by the geometrical optics) with the Point Spread Function(PSF)[1,5-7]. The convolution computation is often performed by the inverse Fourier transform of the product of the Fourier transform of both the ideal image and the PSF. However, the condition of the spatially invariant PSF has to be fulfilled. In the frequency domain, the Fourier transform of the PSF is the Optical Transfer Function(OTF)[8-9]. As the distance from the detection plane to the image plane increases, blurring effect increases. Hence the defo-cusing is a filtering process, while OTF presents the low-pass filter[1].
In order to use the above mentioned computation procedure for polychromatic light, two additional conditions need to be satisfied[6,10]:(1)constant spectral composition and uniform spectral sensitivity across the detector area; (2)small variation of the local magnification with wavelength. Thus, the computation procedure is valid for a restricted class of polychromatic objects of which the radiance spectrum emitted by the objects is the same, except for an intensity scaling factor, for every point in the objects.
The polychromatic PSF is often represented by a pillbox(cylinder) shape function[11]or Gaussian function[5], whose width relating to the blur circle(circle of confusion) around the image point is calibrated according to the parameters of the real experimental setup. The same computer modeling of the image defocusation based on the cylinder shape PSF[11]or Gaussian PSF[12]has been already developed and used, for instance, for assessing various focus measure operators[4]or reliability measure aimed at assessing the quality of the depth-map obtained using the shape from focus method[2].
However, the Gaussian function model as a sum of single light components does not incorporate weight of the components, and both Gaussian and pillbox model do not distinguish individual factors causing distortion in intensity pattern. Among these factors the lens aberration is worth mentioning. For our purpose we use more real model of image defocusation, which describes and involves these aspects much better.
In the presented paper we use a PSF computed as the Fourier transform of a generalized aperture function of lens[7,13-14], which includes a focus error(a deviation from focused imaging) causing image blurring. In order to approximate to a real situation,
we take into account spectral weights of individual components of light[6,8]. We also incorporate the chromatic aberration of the lens in consequence of a dispersion of a lens material causing additional defocusation of monochromatic light components. Our proposed model enables to influence the chromatic aberration by the use of an achromatic lens. Although, it is already known that the achromatic lenses with completely different chromatic aberration may have the same OTF[8].
Further, in the presented paper we simulate translation of a 3D object by changing the object distance and resulting imaging of the shifted object into the detection plane. Our simulation model is based on the above-mentioned mathematical operations and involves both image defocusing and determination of the best focus position of every object point from serious of images via the SML operator. However, simulation of the image defocusation for 3D object is complicated problem, because, in general, the PSF varies for each point in the image due to both various depths and optical aberrations. In this case, the PSF is spatially variant and the convenient approach which uses Fourier transform operations cannot be used and the convolution is computed directly. Nevertheless, calculating the PSF for the each point is not a practical approach for a large number of pixels. The simplest method that can be used in complexity reduction is to divide the image into different sections and consider a constant PSF inside each section(a piecewise invariant PSF). Then the space variant PSF can be expressed as a weighted summation of the invariant PSF[15-16]. However, rendering of individual sections of the image leads to blur discontinuity artifacts in the resulting image[15-17]. To suppress the artifacts, one of the solutions is to interpolate two adjacent PSFs to achieve smoother transition between corresponding sections[15-17]. To apply the median filter on the acquired depth map[18]can be another solution.
The aim of the paper is to propose a numerical model for simulation of the shape from focus method. The solution of the model uses weighted summation of the invariant PSFs. The model approaches the reality, and uses the polychromatic PSF of a generalized aperture function of lens including focus error to simulate image defocusation, a spectrum of a Standard illuminant, a dispersion function of a real imaging optical system and spectral sensitivity of a real light sensitive sensor. The model allows to propose parameters of a measuring sensor based on the shape from focus method and to increase effectivity of the experimental work. It means, for example, to decrease time lag and to reduce the operating expenses caused by successive selection of unsuitable sensor′s components. The utilization of the model is presented for three optical systems, an aberration-free optical system, an optical system with chromatic aberration and an achromatic optical system. The model allows to study accuracy and reliability of the determination of the object′s surface topography by means of the shape from focus method.
2Theory
2.1Monochromatic case


Fig.1 Detection of focused P′ and defocused P″ image of the object point P
For simplicity, let us collectively denote focusedIf(x′,y′) image and defocusedId(x′,y′) image asIf,d(x′,y′ ). The relation between the ideal image intensityI(x′,y′) and the intensityIf,d(x′,y′) is given by the convolution[14]:
(1)
wherehi(x′,y′) represents the intensity PSF of the incoherent illumination lens system(intensity impulse response) derived by means of the PSF of the coherent illumination lens system(amplitude impulse response)hu(x′,y′) ashi(x′,y′)=|hu(x′,y′)|2. The integral (1) depends on the focus errorε, which changes withd1ord2[13].
If the condition of the spatially invariant PSF is satisfied, convolution Eq.(1) in the spatial frequency domain (vx′,vy′) is given by
(2)
whereIF,D(vx′,vy′),I(vx′,vy′) andHi(vx′,vy′) are the Fourier transforms ofIf,d(x′,y′),I(x′,y′) and
hi(x′,y′). ComponentHi(vx′,vy′) is referred to as the optical transfer function. By means of the Fourier transform ofIF,D(x′,y′) the resulting imageIf,d(x′,y′) is obtained.

Fig.2 The depth z(x,y) of the 3D object and intensity distribution I(x′,y′) corresponding to its ideal image. The image is divided into the limited regions A, B, …, C (gray areas), in which the spatially invariant hi, j(x′,y′) is computed for j=1,2,…,N, while N denotes number of the regions. The depth z(x,y) changes in discrete increments to, j=to(height of a single step). For simplicity, we assume imaging 1∶1, therefore widths wo, j of individual steps are the same as the widths wi, j of the appropriate regions A, B, …,C
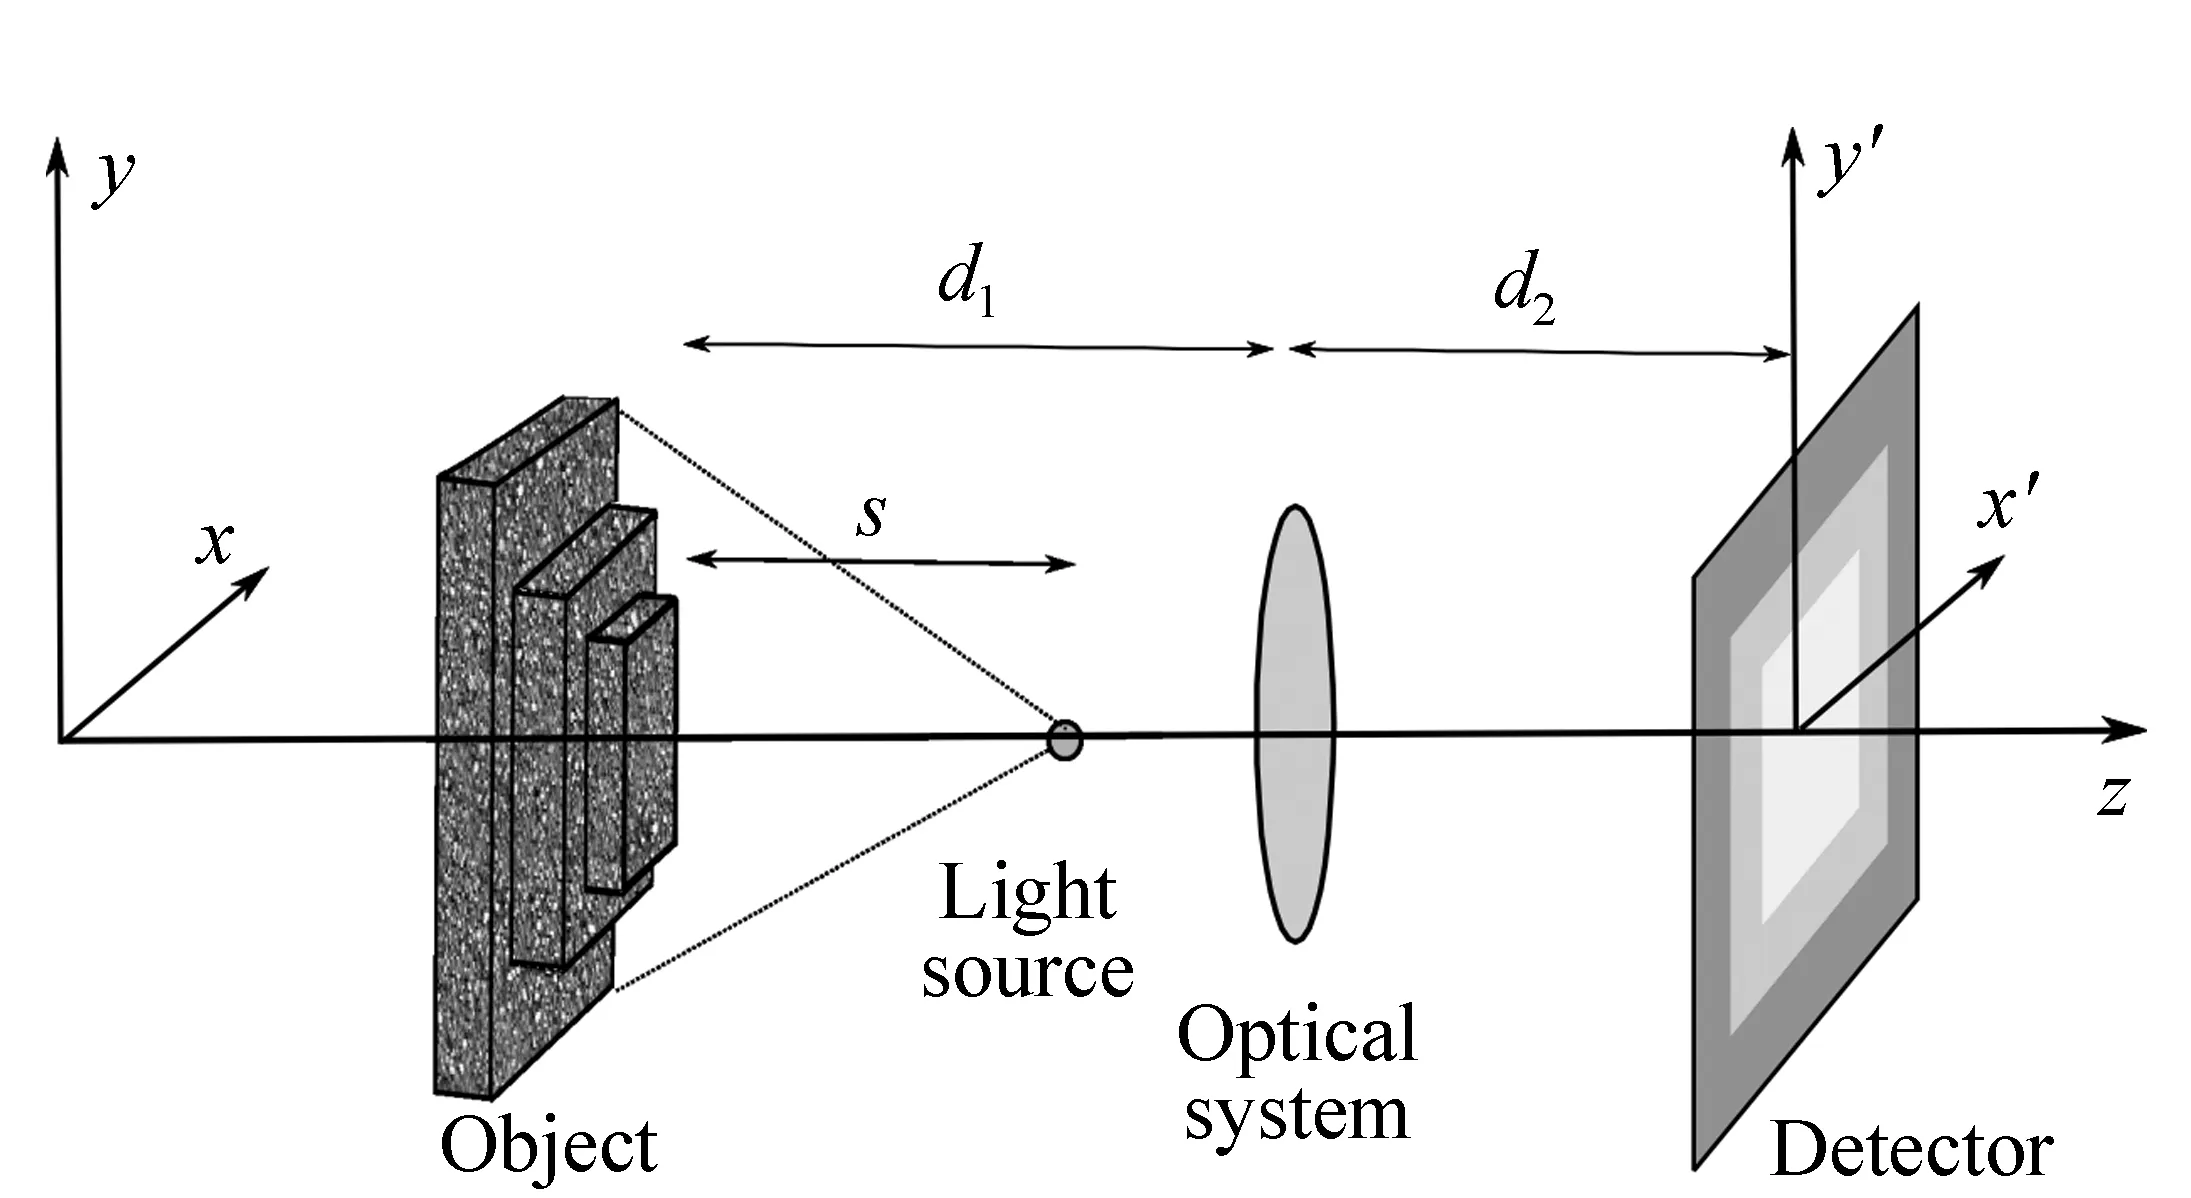
Fig.3 Scheme for simulation of the shape from focus method. The pyramidal object is placed at the distance d1 from the optical system. The image of the object produced by the optical system is observed at the distance d2 by means of the detector. Light source is situated at the distance s from the object
Let us assume that the object under investigation is a 3D object of pyramidal shape withNlevels and the distribution of the intensityI(x′,y′) resembles the depthz(x,y) of the object as is shown in Fig.2. The object is positioned according to the setup in Fig.3. In this case the condition of spatially invarianthi(x′,y′) is fulfilled only within the limited regions A, B,…, C(gray areas). The depthz(x,y) changes in discrete incrementsto,j=to(height of a single step). For simplicity, we assume imaging 1∶1, therefore widthswo,jof individual steps are the same as the widthswi,jof the appropriate regions A, B,…, C.
For instance, if a number of levels isN=3, the PSFhi(x′,y′) is defined as
(3)
Convolution Eq.(1) then becomes
(4)
where functionsa,b,care defined as

(5)

(6)
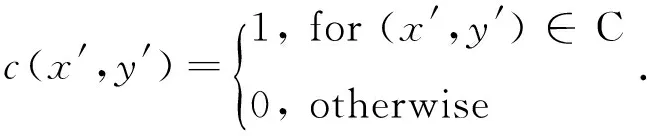
(7)
Alternatively, relation Eq.(2) becomes
(8)
whereaF(vx′,vy′),bF(vx′,vy′),cF(vx′,vy′) are the Fourier transforms ofa,b,c.
The PSFhi(x′,y′) can be derived by means of the Fourier transform of the generalized pupil functionp1(x,y) of the lens[7,13-14].
(9)
wherep(x,y) is a pupil function, andλis wavelength of the light. For a circular aperture of the radiusRthe pupil functionp(x,y) isp(x,y)=1 forx2+y2≤R2andp(x,y)=0 forx2+y2>R2. After substitutionp(x,y) into relation Eq.(9) and considering polar coordinatesx=r1cosφ,y=r1sinφandx′=r2cosθ,y′=r2sinθthe PSF Eq.(9) becomes
(10)
In this paper, the derivation of the PSF is based on the single lens and a single aperture. However, an actual image optical system may contain many lenses and apertures. In these cases, all these elements may be lumped into a single “black box”, and the significant properties can be completely described by specifying only the terminal properties of the aggregate[14].
2.2Polychromatic case

(11)
whereS(λ) is the spectral weight factor determined by the source-detector-filter combination and (λ1,λ2) is the range of wavelength within whichS(λ) takes significant values[6,8,19]. Both spectrum of the light source and the spectral sensitivity of the detector are multiplied to get resulting spectral weight factorS(λ)[19].
In case of polychromatic light the chromatic aberration as a consequence of the dispersion appears. Each of the monochromatic components of the light contributes to the overall blurring effect of the image, because each component is focused at various image distancesd2i. The focus error of the individual components is expressed by the relation[13-14]:
(12)
which is substituted to relation Eq.(10).
For purposes of the paper, the above-mentioned theoretical background is applied to the simulation of the measurement of 3D object topography by means of the shape from focus method. According to the principle of the method, the object under investigation is moved along the optical axis, while a sequence of the imagesIf,d(x′,y′) of the same scene of the object corresponding to the various object distancesd1is obtained and subsequently processed. The depth of the object is determined through searching the position where every point on the object is imaged sharply. For determination of the focused imageIf(x′,y′) at each image pointIf,d(x′,y′), the Sum-Modified Laplacian(SML) operator to the images sequence is applied[1].
Modified Laplacian operator is computed as[1]
(13)
where step represents variable space between pixels and the sum of the modified Laplacian function in a small window of sizeMaround a point (i,j) is of form

(14)
3Simulation description
We simulate the shape from focus method according to the setup shown in Fig.3. It consists of a source of the polychromatic light, a 3D object under investigation, an optical system and a detector. The simulation model comprises three cases:(a)aberration-free(ideal) optical system, (b)optical system with chromatic aberration and (c)achromatic optical system.
3.1Parameters of simulation
For simulation we use the following specific parameters:
An object is represented by a five-level(N=5) pyramidal nontransparent object, where a 1D profilez(x) and corresponding 1D ideal image intensity profileI(x′) are shown in Fig.4(a), 4(b). Height of the whole object is randomly chosen as 735 μm, therefore the height of the individual level(step) in the profilez(x) isto, j=to=735 μm/5=147 μm. The width of the individual step(gray areas in Fig.2) iswo,j=180 μm forj=1,…,N-1 andwo,j=360 μm forj=N. The widthwo,jof single steps at the depth mapz(x,y) is the same as the widthwi, jof the steps in the intensity distributionI(x′,y′). Height of the individual level(step) in the intensity distributionI(x′,y′) isti,j≈1/[s+(N-j+1)·to]2-1/[s+(N-j)·to]2, wheresrepresents a distance of the source from theN-th level(top) of the pyramidal object(Fig.3). During simulation procedure, we sets=10 mm. In the simulation model, we additionally assume that the gray level on each object level is not constant but fluctuates. The origin of the fluctuation is in the roughness of the object′s surface. Thus the intensity distributionI(x′,y′) contains fluctuation, as is depicted in Fig.4(d). The fluctuationIfluct(x′,y′) is added to the basic intensity distributionI(x′,y′) by summationI(x′,y′)+Ifluct(x′,y′). The valuesIfluct(x′,y′) are created by the random number generator with uniform distribution(mean value ofIfluctis 5 a.u., standard deviation ofIfluctis 3 a.u.).

Fig.4 (a)A one-dimensional profile z(x) of the object under test and (d) a resulting intensity distribution I(x′), computed by summation of (b) the intensity distribution I(x′) with (c) the fluctuation Ifluct(x′)
Distribution of the intensityI(x′,y′) is represented by a matrix of the size 902×902. Linear size of the matrix area is 2.15 mm, and distance between the neighboring points isδx=2.4 μm. The sampling for the intensity matrix is the same as the sampling for the matrices of the PSFshi,jcomputed for individual object level. Resulting sampling for the intensity matrix is, however, accommodated to sampling(pixel pitch) for the matrix of the detector, because
the detector has different sampling. Thus the intensity matrix has to be transformed into the matrix of the detector.
The detector is represented by a CMOS camera, monochromatic regime(Thorlabs catalogue, item DCC1545M[20]). Linear pixel size of the CMOS camera isδxCMOS=5.2 μm. In order to get sampling for the intensity matrix closer to the sampling for the matrix of the CMOS camera, resulting dimension of
the intensity matrix is decreased to 451×451 by means of summing up 2×2 intensity values to obtain a single intensity value. Resulting sampling is thenδx=4.8 μm. Information about the CMOS camera including its spectral sensitivity needed for computationS(λ) in relation Eq.(11) is available from Ref.[20].
The light source is represented by a Standard illuminant D65, and range of the wavelength is from 400 to 700 nm(increment 10 nm). Spectrum of the light source needed for computationS(λ) in relation Eq.(11) is available from Ref.[21].
For simulation of the shape from focus method we use the following specific parameters for three different cases of the optical system:
(a)aberration-free(ideal) optical system
Diameter of lensD=12.7 mm
Focal lengthf=75 mm
Image distanced2=0.15 m
Object distanced1=0.15 m
(b)optical system with chromatic aberration
Diameter of lensD=12.7 mm
Focal length forλfoc=550 nm,f(550 nm)=75 mm
Image distanced2=0.15 m
Object distanced1=0.15 m
Material:glass N-BK7. Dispersion formulan(λ) is acquired from Ref.[22]. Radius of a biconvex lensλfoc=550 nm is computed as[13]R550=2f550(n550-1)=0.077 778 4 m. Focal length as a function of wavelength computed as[13]f(λ)=R550/2[n(λ)-1] is then substituted into Eq.(12).
(c)achromatic optical system
Diameter of lens(doublet)D=12.7 mm
Focal length forλfoc=550 nm,f(550 nm)=75 mm
Image distanced2=0.15 m
Object distanced1=0.15 m
Material:mounted achromatic doublets N-BK7/SF2. Focal length increments Δfas a function of wavelength(acquired from Thorlabs catalogue, item AC127-075-A-ML[23]) are added to the focal lengthf(550 nm)=75 mm and substituted into Eq.(12).
The object movement along the optical axis is simulated by changing the object distanced1. The object distance of thej-th level isd1=do+δj,A, wheredois object distance forε=0(level is imaged sharply) andδj,A=(A-j)·to, j(j=1, 2, 3, 4, 5), whereArepresents the sequence numberjof the sharply imaged level. The change ofA(A=1, 2, 3, 4, 5) corresponds to the simulated object movement. If the level is in focus, thenj=A,δj,A=0 and the object distanced1=do=0.15 m.
The obtained sequences of images for variousd1are processed by the Sum-Modified Laplacian(SML) operator according to relations Eq.(13) and Eq.(14). The parameter step is set as step=1 according to Ref.[1]. In the method[1], in contrast to auto-focusing methods, a small window of size(3×3) is typically used. Therefore, we choose the same window size, i.e.,M=1.
3.2Results of simulation
Figs.5-7 show the results of simulation of determination of depth mapsz(x,y) of the object by means of the shape from focus method for three cases: aberration-free(ideal) optical system(Fig.5), optical system with chromatic aberration(Fig.6), achromatic optical system(Fig.7). Moreover, for illustration, Fig.8 shows the sum of modified Laplacian functionF(i,j) computed by Eq.(14) fori=225,j=125(the point on the third level of the pyramidal object) as a function ofd1for all three different cases of the optical system.
As is shown in Fig.5, for the aberration-free optical system the acquired depth map(Fig.5(c), 5(d)) is almost the same as the ideal case of the depth map(Fig.5(a), 5(b)) except the boundary artifacts between adjacent object levels. As mentioned in section 1, the artifacts appear in the resulting image due to rendering of individual sections of the image[15-17]. Good agreement between original and acquired topography of the object is caused by the fact that the ideal system does not count with inherent lens aberration. These aberrations negatively influence the evaluation of the resulting depth maps, as is depicted in Fig.6. In the case of the optical system with chromatic aberration, the distorted resulting depth map is obtained. One can conclude that due to the longitudinal lens aberration, the single lens system is not appropriate for the shape from focus method.

Fig.5 (a)An ideal case of the depth map z(x,y)(matrix of 451×451 pixels) of the object represented by the pyramid with 5 levels with total height 735 μm, and height of the individual level of the pyramid is 147 μm (b) a cross section of the depth map z(x,y) from (a) at a position y=225, (c)the depth map z(x,y) of the object acquired via simulation of the shape from focus method using the aberration-free optical system (d) a cross section of the depth map z(x,y) from (c) at a position y=225
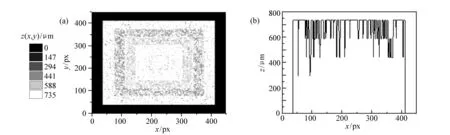
Fig.6 (a)A depth map z(x,y) of the object under test acquired via simulation of the shape from focus method using the optical system with chromatic aberration (b) a cross section of the depth map z(x,y) at a position y=225

Fig.7 (a)A depth map z(x,y) of the object under test acquired via simulation of the shape from focus method using the achromatic optical system (b) a cross section of the depth map z(x,y) at a position y=225
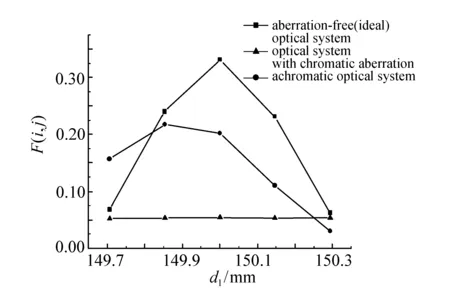
Fig.8 Sum of modified Laplacian function F(i, j) computed by Eq.(14) for i=225, j=125(the point on the third level of the pyramidal object) as a function of d1 for aberration-free(ideal) optical system, optical system with chromatic aberration and achromatic optical system. The total object height is 735 μm
In the case of achromatic optical system, the distortion in the resulting depth map is inhibited and the pyramidal shape of the object is maintained, as is shown in Fig.7. However, in contrast with the ideal aberration-free optical system, worse agreement between the original and the acquired depth mapz(x,y) of the object is achieved. The height of the whole object is 588 μm according to the results, instead of 735 μm. Further, except the first level, the positions of the individual levels in the original and acquired depth maps can not match. This can be caused by the limited resolution of the shape from focus method, which is defined by the depth of focusDofof the lens[24]. Depth of focusDofcan be derived asDof=1.22λ/(NA)2=1.22λ/(sinθ)2, where NA is the numerical aperture of the optical system andθrepresents the half-angle subtended by the exit pupil when viewed from the image plane[14,24]. In this case(forλ=550 nm)Dof=1.22λ/(sinθ)2≈1.22λ(2d2/D)2=374 μm. In our case, the step between two successive images is the same as the height of the individual levelto, j=147 μm. Therefore, in order to approach to the resolution limit of the method, let us increase the distancetototo=294 μm. The object′s height is nowvo·N=1 470 μm. The result of the simulation for this case is shown in Fig.9. Fig.10 shows the corresponding sum of modified Laplacian functionF(i,j) computed by Eq.(14) fori=225,j=125(the point on the third level of the pyramidal object) as a function ofd1.

Fig.9 (a)A one-dimensional profile z(x) of the object under test, (b) a depth map z(x,y) of the object under test acquired via simulation of the shape from focus method using the achromatic optical system (c) a cross section of the depth map z(x,y) at a position y=225. The total object′s height is 1470 μm

Fig.10 Sum of modified Laplacian function F(i, j) computed by Eq.(14) for i=225, j=125(the point on the third level of the pyramidal object) as a function of d1 for achromatic optical system. The total object height is 1470 μm
In comparison with Fig.7, better results are achieved. The acquired total height of the object as well as height of the individual levels of object under investigation corresponds to the object height profile in Fig.9(a). However, due to bigger blur discontinuity between two adjacent levels the more significant artifacts mentioned in section 1 appear. To suppress the artifacts, the median filter on the acquired depth map can be applied[18].
4Conclusion
The presented results show that the real sensor
based on the shape from focus method requires the achromatic optical system. Next the results show that the step of object displacement and the depth of focus of the optical system influence reliability of the method. The model approaches the reality, and uses imaging of the 3D object in polychromatic light, the Standard illuminant D65 as a source of light, a real CMOS camera and dispersion functions of optical systems with chromatic and minimized chromatic aberrations. Presented model can be used for the study of an effect of the experimental parameters on the accuracy and reliability of the object′s depth map determination. One can conclude the model allows to increase effectivity of the experimental work, to decrease time lag and to reduce the operating expenses caused by selection of unsuitable sensor′s components.
参考文献:
[1]NAYAR S K,NAKAGAWA Y. Shape from focus[J].IEEE,1994,16(8):824-831.
[2]PERTUZ S,PUIG D,GARCIA M A. Reliability measure for shape from focus[J].ImageVis.Comput.,2013,31(10):725-734.
[3]MAHMOOD M T,SHIM S,CHOI T S. Depth and image focus enhancement for digital cameras[C]. IEEE 15th International Symposium on Consumer Electronics,Singapore,2011:50-53.
[4]PERTUZ S,PUIG D,GARCIA M A. Analysis of focus measure operators for shape from focus[J].PatternRecognit.,2013,46(5):1415-1432.
[5]SUBBARAO M. Direct recovery of depth-map I:differential methods[C]. IEEE Computer Society Workshop on Computer Vision,Miami Beach,Florida,USA,1987:58-65.
[6]RAVIKUMAR S,THIBOS L N,BRADLEY A. Calculation of retinal image quality for polychromatic light[J].J.OptSoc.Am.A,2008,25(10):2395-2407.
[7]CLAXTON C D,STAUNTON R C. Measurement of the point-spread function of a noisy imaging system[J].J.Opt.Soc.Am.A,2008,25(1):159-170.
[8]TAKEDA M. Chromatic aberration matching of the polychromatic optical transfer function[J].Appl.Opt.,1981,20(4):684-687.
[9]MANDAL S. A novel technique for evaluating the polychromatic optical transfer function of defocused optical imaging systems[J].Optik,2013,124(17):2627-2629.
[10]BARNDEN R. Calculation of axial polychromatic optical transfer function[J].Opt.Acta,1974,21(12):981-1003.
[11]SUBBARAO M,LU M-C. Computer modeling and simulation of camera defocus[C]. Conference on Optics, Illumination, and Image Sensing for Machine Vision VII, Boston, Massachusetts,USA,1992,Proc. SPIE,1993,1822:110-120.
[12]MOELLER M,BENNING M,SCHÖNLIEB C,CREMERS D. Variational Depth from Focus Reconstruction[J].IEEE,2015,24(12):5369-5378.
[13]SALEH B E A,TEICH M C.FundamentalsofPhotonics[M]. New York:John Wiley & Sons,1991.
[14]GOODMAN J W.IntroductiontoFourierOptics[M]. New York:McGraw-Hill Book Co.,1968.
[15]ATIF M. Optimal depth estimation and extended depth of field from single images by computational imaging using chromatic aberrations[D]. Heidelberg:Ruperto Carola Heidelberg University,2013.
[16]HADJ S B,BLANC-FÉRAUD L. Modeling and removing depth variant blur in 3D fluorescence microscopy[C]. IEEE International Conference on Acoustics,Speech and Signal Processing,Kyoto,Japan,2012:689-692.
[17]BARSKY B A,TOBIAS M J,CHU D-P,etal.. Elimination of artifacts due to occlusion and discretization problems in image space blurring techniques[J].Graph.Models,2005,67(6):584-599.
[18]ZHANG L,NAYAR S. Projection defocus analysis for scene capture and image display[J].ACMTrans.Graph.,2006,25(3):907-915.
[19]FURLAN W D,SAAVEDRA G,SILVESTRE E,etal.. Polychromatic axial behavior of aberrated optical systems:Wigner distribution function approach[J].Appl.Opt.,1997,36(35):9146-9151.
[20]CMOS Camera DCC1545M[EB/OL]. [2016-01-07].http://www.thorlabs.de/newgrouppage9.cfm?objectgroup_id=4024/.
[21]Relative spectral power distribution of CIE Standard Illuminant D65[EB/OL]. [2016-01-07].http://files.cie.co.at/204.xls/.
[22]Dispersion formula of glass N-BK7[EB/OL]. [2016-01-07].http://refractiveindex.info/?shelf=glass&book=BK7& page=SCHOTT.
[23]Mounted Achromatic Doublet AC127-075-A-ML[EB/OL]. [2016-01-07]. https://www.thorlabs.de/newgrouppage9.cfm?objectgroup_id=2696.
[24]MADOU M J.ManufacturingTechniquesforMicrofabricationandNanotechnology[M]. Boca Raton,Florida:CRC Press-Taylor & Francis Group,2011.
Author biographies:

Ivana Hamarov(1982—), Ph.D., Institute of Physics of the Czech Academy of Sciences, Joint Laboratory of Optics of Palacky University and Institute of Physics AS CR. Her research interests are on numerical modeling and simulation of the optical fields and the proposal of the optical measuring sensors. E-mail:ivana.hamarova@upol.cz
收稿日期:2016-03-14;
修订日期:2016-04-29
基金项目:Supported by the grant of the Czech Science Foundation(No.13-12301S)
文章编号2095-1531(2016)04-0439-13
中图分类号:TH752
文献标识码:A
doi:10.3788/CO.20160904.0439
Design of a model for shape from focus method
(InstituteofPhysicsoftheCzechAcademyofSciences,JointLaboratoryofOpticsofPalackyUniversityandInstituteofPhysics,Olomouc772 07,CzechRepublic)*Correspondingauthor,E-mail:ivana.hamarova@upol.cz
Abstract:We propose a numerical model for simulation of an object depth measurement by means of a shape from focus method using Laplacian operator. The core of the simulation is based on convolution of an ideal image(predicted by the geometrical optics) with polychromatic point spread functions of a generalized aperture function of lens including focus error instead of more exploited the pillbox shape or the Gaussian functions. The model allows to employ parameters of real components of the sensor based on the method, a light source spectrum, dispersion of an optical system and spectral sensitivity of a camera. The influence of dispersion of optical systems(aberration-free, achromatic and with chromatic aberration) on accuracy and reliability of the determination of the object′s surface topography is presented. It is indicated that this model can increase the experiment effectively and decrease time lag with the reducing of operating expenses.
Key words:simulation model;defocusation of 3D object;shape from focus method;point spread function