
Improvement potential analysis for integrated fractionating and heat exchange processes in delayed coking units☆
2016-06-01 03:00:58YangLeiDanlinZengGuanghuiWang
Yang Lei,Danlin Zeng,Guanghui Wang
School of Chemical Engineering and Technology,Wuhan University of Science and Technology,Wuhan 430081,China
1.Introduction
Fractionating and heatexchange processes are commonly integrated system in re fineries,such as complex fractionator and heat exchanger network(HEN)systems in delayed coking units(DCUs)[1].Analysis and optimization of these energy integrated systems are mainly performed with mathematical modeling and thermodynamic analysis.
Currently,exergy analysis is conducted to identify and quantify the parts of systems with excessive irreversibility and determine the thermodynamic efficiency of fractionating or heat exchange processes[2-4].It describes the maximum available work when a type of energy is converted reversibly to a reference system in equilibrium with environmental conditions[5]and is a powerful tool for reducing the energy demand by locating inefficiencies from exergy losses of the system[6].Recently,pinch analysis and exergy analysis are combined to identify related thermodynamic imperfection with environmental concerns based on graph methods.Ishida and Ohno[7]presented a diagram(energy-direction factor diagram)to analyze exergy destructions based on the conception of a reversible distillation column,which is only acceptable to binary mixtures where the composition is uniquely determined by temperature.A new method for graphic exergy analysis of multicomponent distillation and for visualization of rate characteristics of a distillation column was proposed by using an energy utilization diagram(EUD)[8,9].Taprap and Ishida[10],by using a mass transfer model coupled with a mass and heat balance,developed the EUD for a distillation column in relation to thex-ydiagram in a logarithmic scale.The diagrams identified the amount of energy transformation and exergy loss of individual process,the heating and mixing of the liquid phase,cooling and mixing of the vapor phase and phase changes.By using a graphicalexergy analysis,Jin and Ishida[11]introduced EUDs to analyze advanced thermal power systems.Suggestions for improving the systems were described based on EUDs.Jinet al.[12]also used the graphical exergy methodology based on EUDs to analyze gas turbine cycle,based on the combination of humid air turbine cycle with an externally fired heater.Bouapetchet al.[13]extended EUDs to power availability for exergy loss analysis.A Modified subsystem power availability diagram was proposed to present the graphical exergy distribution.Using material utilization diagram,Budimanet al.[14]analyzed separation performance and exergy loss phenomena for a retro fitted distillation column.
The exergy loss pro file,characterized by its straightforwardness,has been widely used for a distillation column.For example,Le Goffet al.[15]introduced exergy loss pro files to design and optimize a distillation column.Budiman and Ishida[16]presented the exergy utilization diagram to indentify the targets for reducing energy and exergy consumptions.Khoaet al.[17]reported a novel method to analyze the exergy loss of the effect of design and operating parameters,which is graphically visualized by three dimensional exergy analysis curves,which revealthe correlations between exergy loss,design and operating parameters in a distillation column.
Feng and Zhu[18]used the strength of pinch analysis,in which system information is represented using simple diagrams(e.g.composite curves,grand composite curves),and obtained targets for the system under consideration prior to design.By combining the strengths of pinch and exergy analysis methods,the method could represent a whole system,including individualunitson one diagram,which ishelpful to quickly screen the promising modifications for improving a base case design.In order to address the energy integration,Anantharamanet al.[19]had Modified and extended the concept of energy level proposed by Feng and Zhu.As pressure,temperature and composition changes were taken into account when developing the theory for this method,energy level composite curves(ELCCs)could be applied to a wide range of processes and in particular to energy intensive chemical plants.
Exergy analysis identifies the system components with the highest thermodynamic inefficiencies and related processes,but only a part of the exergy destructions in the system could be avoided in practice.Based on the concepts of avoidable/unavoidable exergy destructions and investment costs,Weiet al.[20]presented an exergy analysis and an exergoeconomic evaluation to identify the energy-saving potentials in distillation processes.
Previous researches mainly concentrated on the exergy analysis for individual processes[7-10,14-17,20],such as fractionating or heat exchange,rarely for integrated systems[1].In this study,extending the concept of traditional ELCC,an advanced ELCC considering temperature dependence of heat capacity and integrating fractionating and heat exchange processes is constructed by using simulation results and a stepwise procedure.The concepts of avoidable/unavoidable exergy destructions are utilized to identify practically and economically possible improvements in the integrated system,which would give the maximum potential for process improvements.The application benefits of the method are illustrated with a DCU.
2.Advanced ELCC and Exergy Analysis
2.1.Advanced ELCC
In order to evaluate the quality of the energy fora system,the energy level for heat is de fined as[18]
whereT0is the temperature in ambient conditions,andTis the temperature for streams.
For a steady-state- flow system,the heat exergy can be expressed as

The ε-Qdiagram is the basis of the ELCC,with the energy level(ε)and enthalpy(Qor ΔH)as the ordinate and abscissa,respectively,as shown in Fig.1.For a complex fractionator with superheated vapor feed and pump-around heat removal,the ε-Qdiagram for heat exchange and fractionating processes is shown in Fig.1(b).
When the thermal energy is concerned,the energy levelis expressed as Eq.(1),and ΔHis equivalent to the exchanged heatQ.The heat exergy is deduced to
The ε-Qdiagram is an upgraded version of temperature-enthalpy(T-H)diagram.On the premise of no heat dissipating,the energy composite curves(so-calledT-Hdiagram)for a simple heat exchange process can be converted into the energy level composite curve(so-calledε-Qdiagram).The shaded area represents exergy destruction in the heat transfer or fractionating process as shown in Fig.1.
The complex fractionating and heat exchange processes can be revealed by ELCC in Fig.2(a)and(b),respectively.The two processes can be integrated in one figure as shown in Fig.2(c).To decrease the exergy destruction for the fractionating process,some modifications can be implemented for improving the energy-use efficiency.For example,as shown in Fig.2(d),as the return temperature of the pumparound stream increases,the curve for heat removal is changed.The new exergy distribution for the fractionating process is illustrated by a dotted line.The curve for pump-around heat removal,which is the hot stream in the heat exchange process,approaches to the curve for feed.Therefore,some parameters are varied for the heat exchange process,including the outlet temperature of the hot and cold streams in the heat exchanger.The new exergy distribution for the heat exchange process is illustrated in Fig.2(e)by a dotted line.These two improved processes can be integrated in one figure as shown in Fig.2(f).It reveals that a part of the decreased exergy destruction in the fractionating process is diverted into the exergy destruction in the heat exchange process.More exergy can be recovered.
Hence,in the ELCC for the integrated system,the exergy destruction distribution is clearly indicated in one figure.More accurate practical results can be obtained by considering temperature dependence of heat capacity.The interactions between different processes are identified when the processes are improved.
Energy is generally transferred from fractionating processes at higher energy levels to heat exchange processes at lower energy levels.The interaction between fractionating processes(energy donating)and heatexchange processes(energy accepting)can be properly revealed in the advanced ELCC.Therefore,both energy and exergy balances for a whole system can be represented simultaneously.
Astep wise procedure forconstruction of advanced ELCC isdescribed as follows.
Step 1:To simplify the flow sheet and de fine the boundary of the chosen integrated system,its envelope should be de fined first containing the fractionator and all heat exchangers involving air and water coolers.Then the simulation for the system is set up in order to obtain the physical properties of involved streams.
Step 2:The curves in the ELCC are subdivided into two categories:one represents materials(e.g.feed or product),another represents energy flow(e.g.heat removal).The final temperature of the material is de fined as 288.15 K,which is different with energy flows.The final temperature of heat removal is the return temperature.Especially,the cold utilities cannot be plotted in the ELCC such as cooling water and air,which move discharged exergy from selected system to the surroundings.
Step 3:Forevery processin the integrated system,the temperature and corresponding enthalpy formaterialor energy flows are obtained based on the simulation.The temperature is converted to the energy levelby calculating Eq.(1).In the ELCC,the ordinate and abscissa represent the energy level and enthalpy difference,respectively.To obtain more accurate fitting results,as many data as possible are de fined to plot a curve for presenting material or energy flows.
Step 4:The curves for the energy donating/accepting terms of the fractionator can be moved horizontally,relative to one another such that the higher energy level curve is to the left of the lowerenergy levelcurve and cold streamsin the heatexchange process are moved horizontally until they are covered completely by corresponding hot streams.

Fig.1.ε-Q diagram.(a)Heat exchange process;(b)complex fractionating process.
Step 5:The least squares method is used to fitting the equation of each curve.These equations are similar to

whereaandbare the corresponding polynomial fitting coefficients.Equations with a higher degree can ensure the R-square more than 0.9999.In this equation,temperature dependence of heat capacity is considered.
Step 6:The exergy destruction distribution of the integrated system is determined by calculating the integral areas in the advanced ELCC.
Similar to the composite curves of pinch analysis,there is no limit to move the curves horizontally.This graphical representation of energy donating and accepting composite curves gives physical insight to an engineer regarding energy degradation and interaction between fractionating and heat exchange processes.The principle of energy transfer from a higher value of ε to a lower value is valid as higher temperature streams will have a higher ε from Eq.(1).Hence,this graphical representation,developed to the analogous pinch representation for heat recovery,can effectively reveal the performance of individual process units indicating the exergy donating/accepting trends.It is worth noting that the heat capacity of each stream is not considered as a constant in the advanced ELCC.Therefore,the calculated results of exergy destructions are more accurate to suggest the potential for improvements.
2.2.Exergy analysis based on avoidable/unavoidable exergy destructions
The exergy destruction rate˙ED,kassociated with thekth component of the system consists of one avoidable(superscript AV)and another unavoidable(superscript UN)part.An exergy balance and the total exergy destruction in a process can be described as[18]
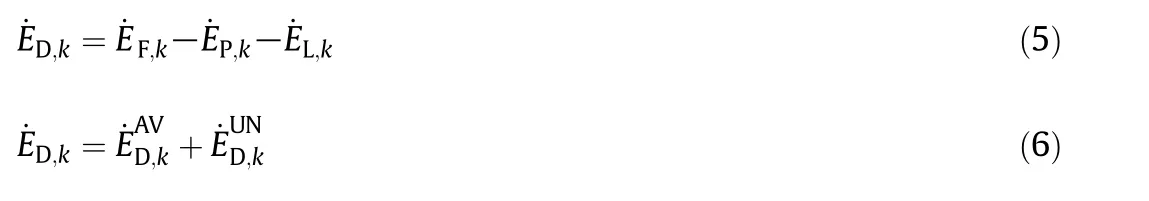
where˙EF,k,˙EP,kand˙EL,kdenote the fuel,product,and exergy loss of thekth component,respectively.
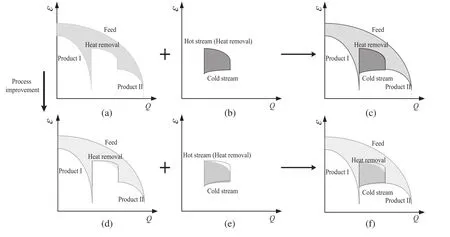
Fig.2.ELCC for an integrated system with process improvement.(a)Fractionating process;(b)heatexchange process;(c)integrated system;(d)fractionating process with improvement;(e)heat exchange process with improvement;(f)integrated system with process improvement.
The thermodynamic inefficiency of a component consists exclusively of exergy loss(i.e.=0)in this study.Hence,exergy efficiency,ηk,related to avoidable exergy destruction,indicates the comparison of exergy efficiency of different components,de fined as

and the potential for improvements for an individual component is measured by the ratio

Practical and valuable improvements can be found by the two evaluation indexes through calculating Eqs.(7)and(8)for the integrated system.The accurate estimation of unavoidable exergy destruction for the heat exchange and fractionating processes is crucial to the quantitative evaluation and identification for potential improvements.
The exergy destructionis calculated by the advanced ELCC through the difference of integral area between hot and cold stream curves for an adiabatic heat exchange process.
Based on the concept of avoidable/unavoidable exergy destructions,for an adiabatic heat exchange process is given by[18]

whereis the heat duty of a heat exchanger,Thais the mean temperature of the hot stream,Tcais the mean temperature of the cold stream,Ris the universal gas constant,pis the pressure,and Δpis the pressure drop.For simplicity,the pressure drop for hot and cold streams is ignored in the heat exchanger(Δph= Δpc=0).
The optimal temperature approach ΔToptis applied to calculate(Tha-Tca)opt[21]

Under the current economic and technical conditions(tradeoff between the costs of fuel and heat exchanger investment),some optimal temperature differences are presented for different conditions[21].In detail,the optimal temperature difference is de fined as 15 K for the heat exchangers,in which there is no phase transition for streams.Otherwise,the temperature approach is de fined as 10 K.
Thus,the unavoidable exergy destruction rateof a heat exchanger is calculated from Eqs.(9)and(10).Furthermore,we can analyze and evaluate the energy-saving potential and efficiency of energy use for different heat exchangers by Eqs.(7)and(8).
For an adiabatic fractionating process,the total exergy destruction is

whereanddenote the exergy destruction of an irreversible separation process and the thermodynamic exergy difference,respectively.
The minimum or unavoidable exergy destruction is determined by the reversible fractionating process.Under ideal conditions,when fractionating is a reversible process for mixing,the minimumexergy destruction is the thermodynamic exergy difference for fractionating,which can be calculated by[22]whereNjdenotes the mole ratio between fractionjand allfractions,andR=8.314 J·mol-1·K-1.
is calculated using Eqs.(11)and(12),in which energy-saving potential of process improvements is de fined for the fractionator.On the basis of the above analysis,andcorrespond to avoidable and unavoidable exergy destructions for the fractionating process,respectively.
Thus far,the avoidable exergy destruction is usually applied to analyze the process inefficiency for single processes,while the interaction between fractionating and heat exchange processes is rarely considered.In general,energy efficiency improvement will be effectively arrived by considering interactions between different processes.
3.Improving Potential Analysis for a Delayed Coking Unit
A DCU in a Chinese re finery is considered as a case study to reveal the exergy analysis for an integrated system based on the advanced ELCC,which is shown in Fig.3.The simulation strategy about the complex fractionator can be found in Ref.[23].A steady state simulation is set up using the simulation system PRO/II.The data for the improving potential analysis are from the simulation results,which are valid compared with the operational data.
3.1.Integrated system and its ELCC
AconventionalDCUgenerally consists of three sections,i.e.coking,oil and gas separation,and heat exchange network.Envelope I is chosen as the boundary of the flow sheet for exergy analysis in Fig.3,which represents the fractionating and heat exchange processes.It includes a complex fractionator,10 heat exchangers,3 water coolers and 4 air coolers.The heat sources include pump-around heat removal and products donated by the complex fractionator.The heatsinks contain feeds,reboiling streams in the absorption and stabilization system and feed water for steam generation.The integrated system looks simple,but the interaction between the components is complex.Forexample,the heatremoval distribution or the operating parameters of the fractionator may be varied in the fractionating process optimization.The fractionator is optimized in isolation,but the HEN may be influenced by those changes so that the utility cost increases obviously.For clarity,the system flow sheet is simplified to Fig.4,where solid lines represent material flows,dotted lines represent energy flows,and black boxes refer to several sections of the column,in which the mass transfer is not considered.
It is assumed that the system is adiabatic and the pressure exergy is ignored.Then the constructing method is also used to generate the ELCC for the case study as shown in Fig.5.
Fitting equations are de fined for hot and cold stream curves by Eq.(4)and the results are listed in Table 1.For this integrated system,the simplified exergy destruction calculation results without considering temperature dependence of heatcapacity are compared with the results from the advanced ELCC in Fig.6.The results of some components are different,so it is necessary to consider non-linear heat capacities varied with temperature for some material and energy flows.
Moreover,basic information for calculating the unavoidable exergy destruction of the fractionator is listed in Table 2.According to Eq.(12),the unavoidable exergy destruction of the fractionator in this case study is given by

3.2.Exergy analysis and evaluation


Fig.3.Flow diagram for a DCU.
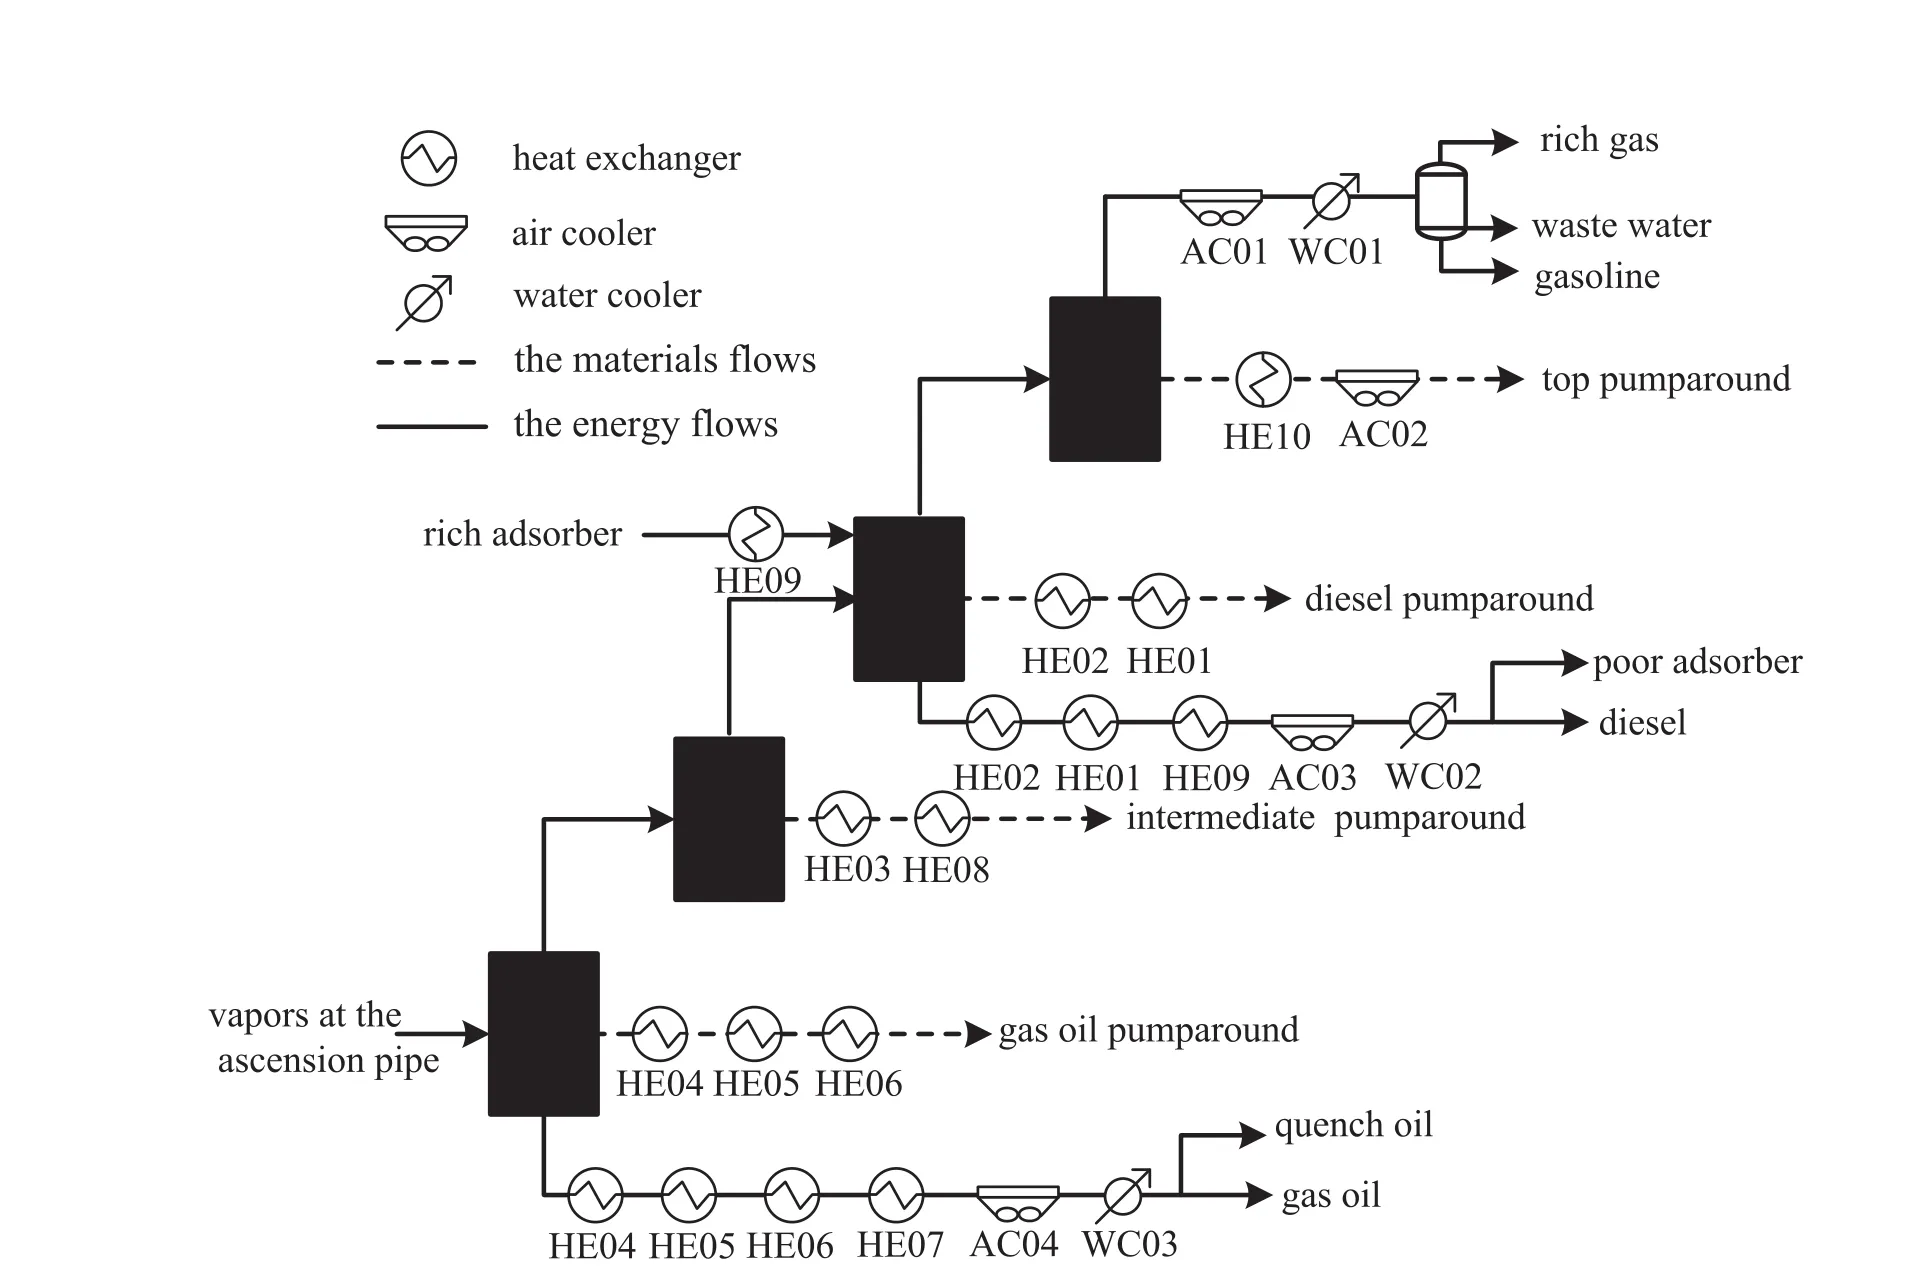
Fig.4.Schematic diagram of an integrated system.
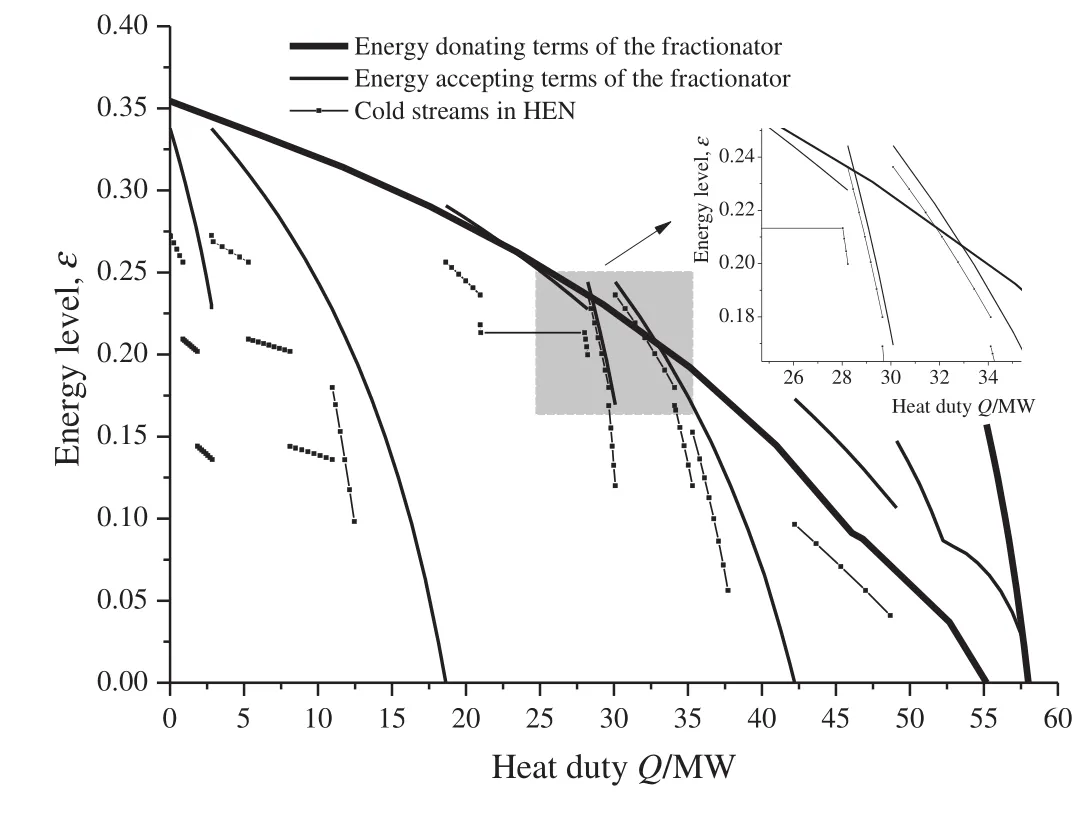
Fig.5.Advanced ELCC for the case study.
Table 3 reveals the unavoidable exergy destruction rate,avoidable exergy destruction rate,the ratio ofand,and the exergy efficiency ηkwhich are calculated for each component.Corresponding to Fig.4,avoidable and unavoidable destruction distributions of the integrated fractionating and heat exchange processes are shown in Fig.7.The rateand ratioare the thermodynamic measures for the potential of improving the performance of thekth component in isolation,which are shown in Fig.8.
3.3.Discussion
The main contributors to the exergy destruction in the integrated system are in descending order of importance:HE05,HE08,fractionator,HE10,HE06,HE04,HE09,HE07,HE03,HE01,and HE02.However,indicates the potential of improvements when the component is considered in isolation,and represents the percentage of the incurred exergy destruction in a component that could be avoided.Moreover,this variable isde fined as the energy-saving potential.anddemonstrate a dominant part ofwhich can be reduced by using the best technology in some components of the integrated system.In Fig.8,the value ofis more than 90%in HE05 and HE08.A significant part of the exergy destruction in these high temperature heat exchangers is avoidable.The avoidable exergy destruction is mainly caused by ahigher temperature approach between hot and cold streams.For example,the cold stream ofHE08 is the deaerated water,which is heated to generate steam at 1.0 MPa by the intermediate pump-around.Because the energy level for the cold stream in HE03 is higher than that in HE08,we suggest increasing the area of HE03 so as to decrease the temperature of the hot stream in HE08.
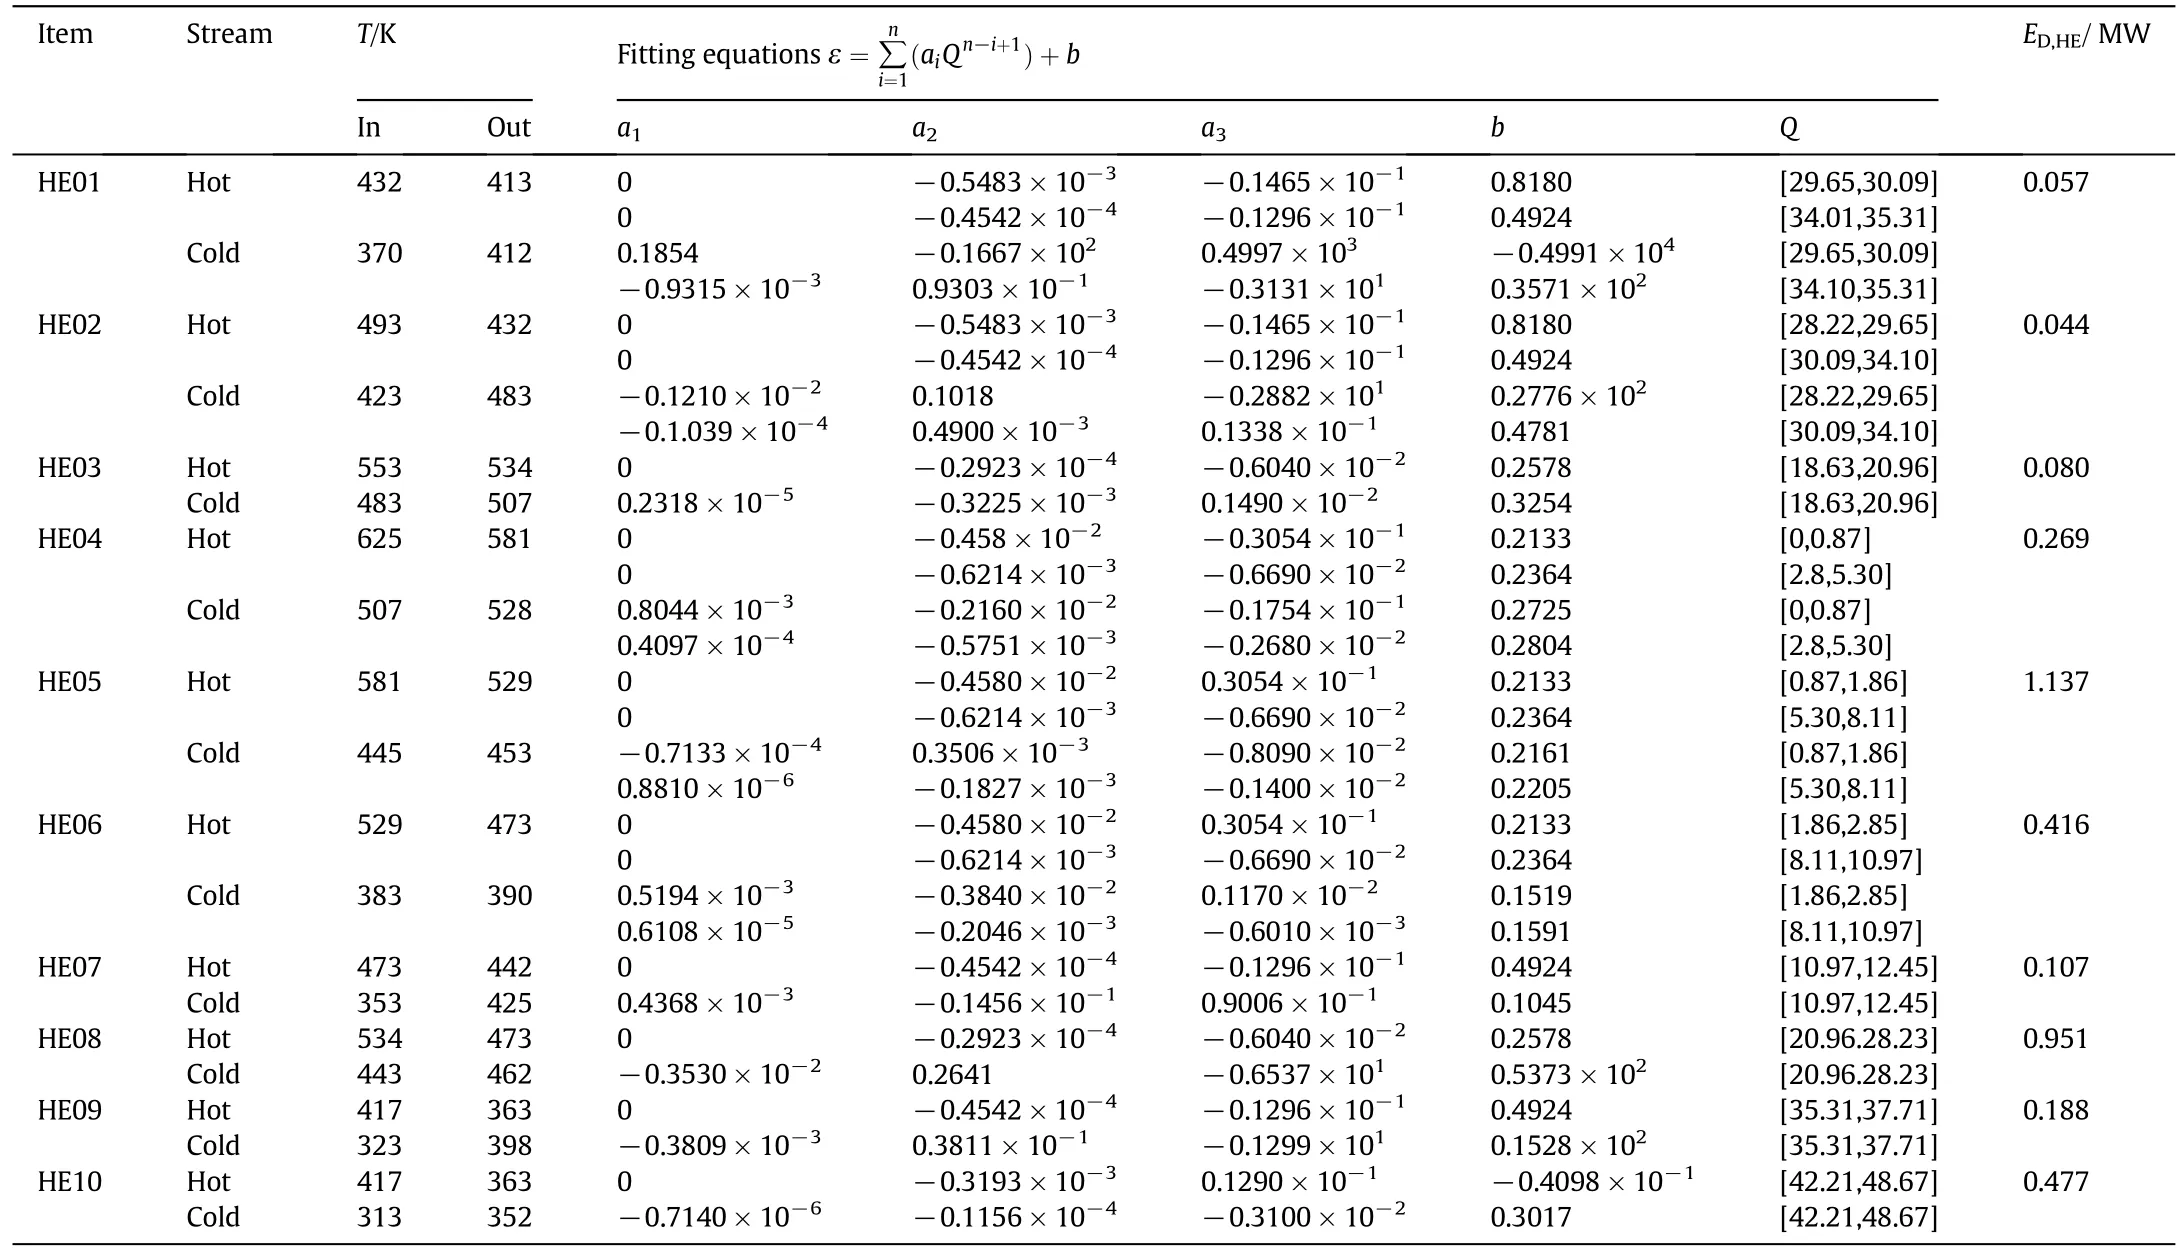
Table 1Basic information and calculated results of heat exchange processes

Fig.6.Comparison of the results for the simplified calculation method and the advanced ELCC.
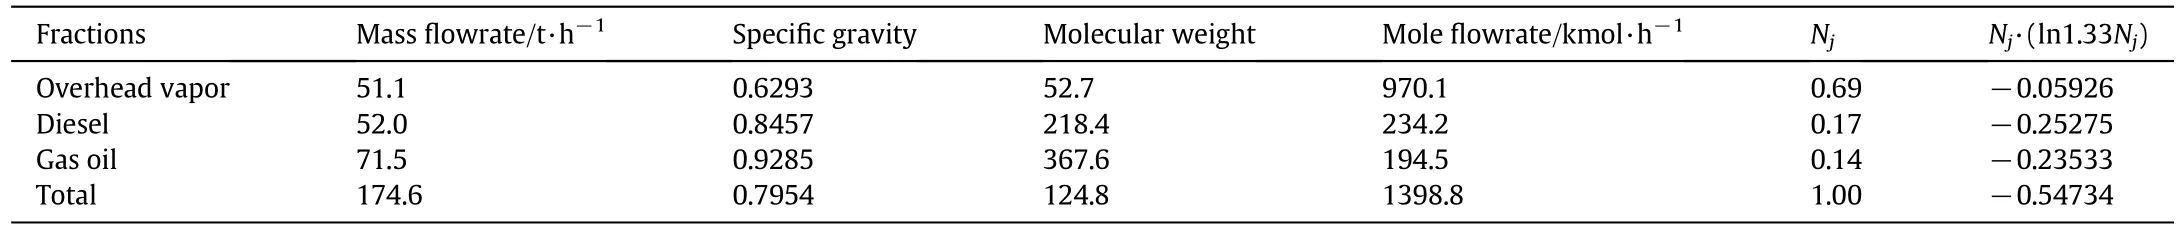
Table 2Basic information for calculating the unavoidable exergy destruction of the fractionator

Table 3Results from the exergy analysis including avoidable and unavoidable exergy destruction rates and evaluation for selected components
Meanwhile,exergy efficiencies without considering avoidable/unavoidable exergy destructions for the components are ranked in descending order as follows:HE02,fractionator,HE03,HE04,HE01,HE07,HE08,HE09,HE06,HE10,and HE05.The results of conventional exergy analysis can be strongly supplemented by the exergy analysis when considering avoidable/unavoidable exergy destructions.According to the irorigins,irreversibilities identified in the conventionalexergy analysis can be split.Only part of the irreversibilities thatcan be avoided should be considered for the improvement of a system with the integrated processes.The values of ηkfor the components are ranked in descending order as follows:HE02,fractionator,HE01,HE03,HE04,HE07,HE09,HE08,HE10,HE06,and HE05.In a conventional exergy analysis,the lower exergy efficiency is generally considered to have a greater retro fit potential.It unreasonably indicates that the fractionator has a great energy-saving potential.However,due to the fractionating requirements,the valuesand ηkfor the fractionator are 38.1%and 97.3%,respectively.Compared with other components,it is obvious that the fractionator is not the most promising component for improvement.
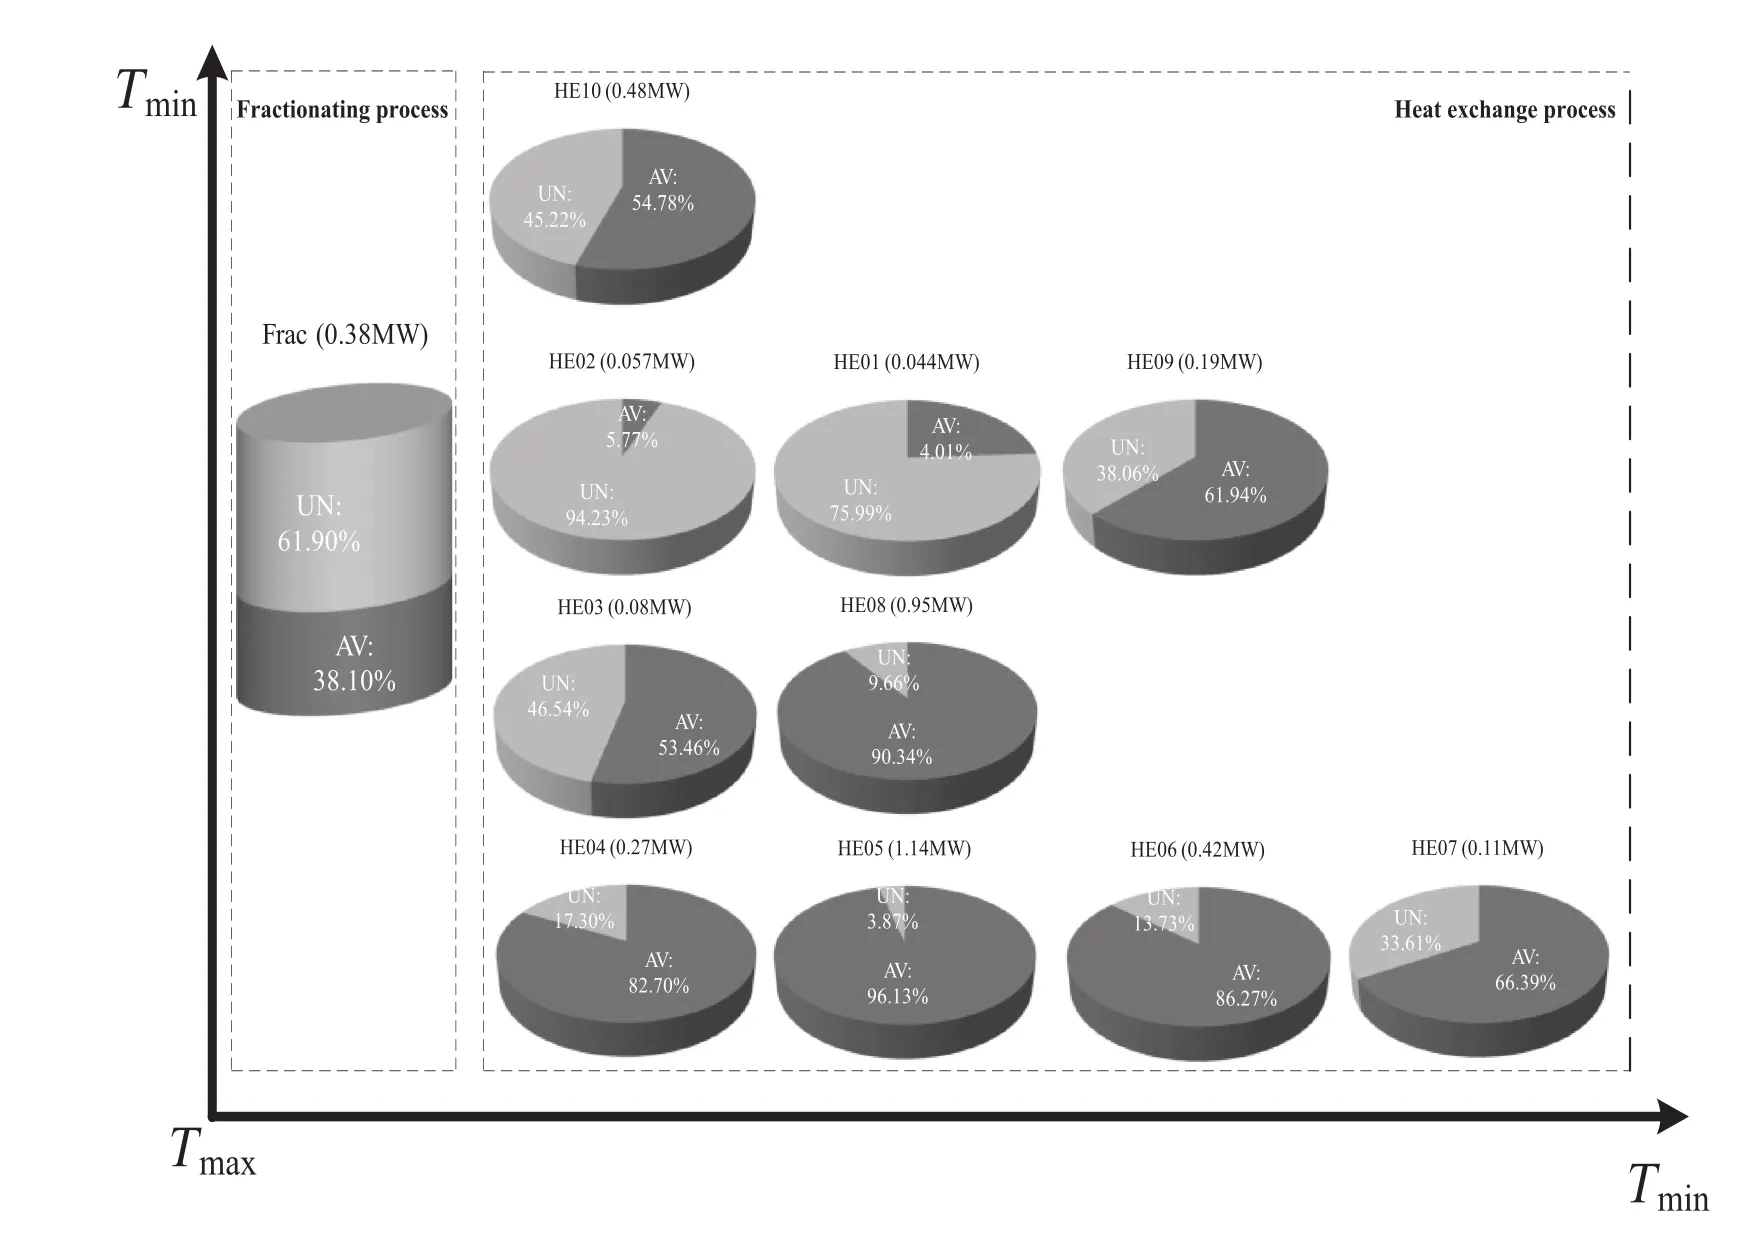
Fig.7.Avoidable and unavoidable destruction distributions of the integrated fractionating and heat exchange processes.
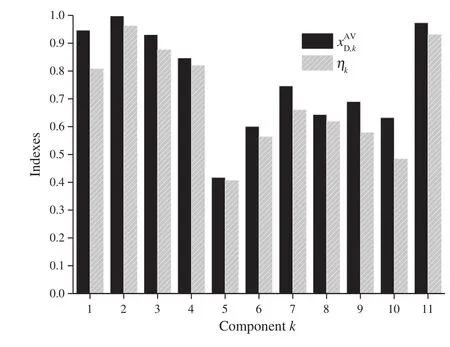
Fig.8.Exergy evaluation for the case study.
Based on the temperature pro file of the integrated system as shown in Fig.5,some improvements can be effectively evaluated.The fractionation and heat exchange processes in an integrated system tightly interact with each other.When the exergy destruction of fractionator is decreased,the total exergy destruction of the integrated system may be decreased less than that of the fractionator.In order to improve the energy efficiency of the fractionation process,the exergy destruction should be decreased.According to Fig.5,the curves representing energy accepting terms of the fractionator should be closer to the ones representing energy donating terms of the fractionator.For the heat exchange process,the curves representing the cold streams in HENmay be close to the ones representing energy accepting terms of the fractionator.For example,when the return temperature of the pump-around is increased and heatremovalduty is unchanged,the exergy destruction of fractionator is decreased.However,by the effect of heat exchange process,the total exergy destruction of the integrated system may not have the same reduction with the fractionator.Similar to the pinch method,the integration opportunities between the system and the streams outside the system could be appointed in the ELCC,in which the energy level is considered.
4.Conclusions
By applying the advanced ELCC and concepts of avoidable/unavoidable exergy destructions,a novel method of exergy analysis is introduced for improving integrated fractionating and heat exchange processes.In the advanced ELCC,temperature dependence of heat capacity is considered and fractionating and heat exchange processes are integrated in one figure.More accurate results of exergy destructions are obtained.
An integrated system for fractionating and heat exchange processes in a delayed coking unit is analyzed and evaluated to demonstrate the effectiveness of the proposed method.Through the calculation for avoidable/unavoidable exergy destructions,the major cause of inef ficiency in the system is identified.The exergy destruction results with the advanced ELCC are different from that with simplified exergy destruction calculation.More accurate results can be obtained.Furthermore,exergy efficiencies without considering avoidable/unavoidable exergy destructions for the components are different.The results reveal that the heat exchange between gas oil and deethanization gasoline has the highestpotentialfor improvement,and the lowestexergy efficiency of the component in the integrated system is only 29.4%.The improvement potential and exergy efficiency for the fractionator are 38.1%and 97.3%,respectively.Compared with other components,it is obvious that the fractionator is not the most promising component for improvement.
Nomenclature
aincidence coefficient
bincidence coefficient
˙Eexergy rate,MW
ppressure,MPa
Qheat duty,MW
Runiversal gas constant,J·mol-1·K-1
Ttemperature,K
Tcamean temperature of cold stream,K
Thamean temperature of hot stream,K
ε energy level
η efficiency,%
Superscripts
AV avoidable
UN unavoidable
Subscripts
a average
c cold stream
D destruction
F feed
Frac fractionator
h hot stream
in/out inlet stream/outlet stream
jpetroleum fractions
kcomponents in the system
opt optimization
P product
0 ambient conditions
[1]Y.Lei,B.J.Zhang,Q.L.Chen,Thermodynamic analysis and modeling for typical feedpreheating and fractionating processes in delayed cokers,Comput.Aided Chem.Eng.31(2012)655-659.
[2]Y.Demirel,Thermodynamic analysis of separation systems,Sep.Sci.Technol.39(2004)3897-3942.
[3]Y.Demirel,Assessment of thermodynamic performances for distillation columns,Int.J.Exergy3(2006)345-361.
[4]J.M.Dealy,M.E.Weber,Thermodynamic analysis of process efficiency,Appl.Energy6(1980)177-201.
[5]R.Rivero,Application of the exergy concept in the petroleum re fining and petrochemical industry,Energy Convers.Manag.43(2002)1199-1220.
[6]Y.Lara,P.Lisbona,A.Martínez,L.M.Romeo,Design and analysis of heat exchanger networks for integrated Ca-looping systems,Appl.Energy111(2013)690-700.
[7]M.Ishida,T.Ohno,Application of energy direction factor diagram for exergy analysis of a distillation column,J.Chem.Eng.Jpn.16(4)(1983)281-287.
[8]M.Ishida,R.Taprap,Application of energy-utilization diagram for graphic exergy analysis of multicomponent distillation column,J.Chem.Eng.Jpn.25(4)(1992)396-402.
[9]M.Ishida,R.Taprap,Introduction of individual energy level for exergy analysis of process systems with multiple components,J.Chem.Eng.Jpn.26(4)(1993)437-439.
[10]R.Taprap,M.Ishida,Graphic exergy analysis of processes in distillation column by energy-utilization diagrams,AIChE J.42(6)(1996)1633-1641.
[11]H.G.Jin,M.Ishida,Graphical exergy analysis of complex cycles,Energy18(6)(1993)615-625.
[12]H.G.Jin,H.B.Zhao,Z.L.Liu,R.X.Cai,A novel EFHAT system and exergy analysis with energy utilization diagram,Energy29(12)(2004)1983-1991.
[13]W.Bouapetch,P.Tungwungwiwat,T.Srinophakun,Extension of energy-utilisation diagram to power availability for exergy loss analysis,Int.J.Exergy12(3)(2013)323-343.
[14]A.Budiman,Sutijan,D.R.Sawitri,Graphical exergy analysis of retro fitted distillation column,Int.J.Exergy8(4)(2011)477-493.
[15]P.Le Goff,T.Cachot,R.Rivero,Exergy analysis of distillation processes,Chem.Eng.Technol.19(6)(1996)478-485.
[16]A.Budiman,M.Ishida,Three-dimensional graphical exergy analysis of a distillation column,J.Chem.Eng.Jpn29(4)(1996)662-668.
[17]T.D.Khoa,M.Shuhaimi,H.Hashim,M.H.Panjeshahi,Optimal design of distillation column using three dimensional exergy analysis curves,Energy35(12)(2010)5309-5319.
[18]X.Feng,X.X.Zhu,Combining pinch and exergy analysis for process modifications,Appl.Therm.Eng.17(3)(1997)246-261.
[19]R.Anantharaman,O.S.Abbas,T.Gundersen,Energy level composite curves—A new graphical methodology for the integration of energy intensive processes,Appl.Therm.Eng.26(13)(2006)1378-1384.
[20]Z.Q.Wei,B.J.Zhang,S.Y.Wu,Q.L.Chen,G.Tsatsaronis,Energy-use analysis and evaluation of distillation systems through avoidable exergy destruction and investment costs,Energy42(1)(2012)424-433.
[21]I.C.Kemp,Pinch analysis and process integration,Butterworth-Heinemann,Amsterdam,2007.
[22]B.Hua,Estimation of exergy difference in the separating process of petroleum and its distillates,Acta Pet.Sin.(Pet.Process.Sect.)2(3)(1986)102-107.
[23]Y.Lei,B.J.Zhang,X.Q.Hou,Q.L.Chen,A novel strategy for simulating the main fractionator of delayed cokers by separating the de-superheating process,Chin.J.Chem.Eng.21(3)(2013)285-294.
 Chinese Journal of Chemical Engineering2016年8期
- Chinese Journal of Chemical Engineering的其它文章
- Synthesis of hierarchical dendritic micro-nano structure ZnFe2O4 and photocatalytic activities for water splitting☆
- Simultaneous desulfurization and denitrification of sintering flue gas via composite absorbent☆
- Non-catalytic conversion of wheat straw,walnut shell and almond shell into hydrogen rich gas in supercritical water media
- Synthesis and characterization of poppy seed oil methyl esters
- Biodieselproduction fromgreen seaweed Ulva fasciata catalyzed by novel waste catalysts from Pakistan Steel Industry
- Increasing isobutanol yield by double-gene deletion of PDC6 and LPD1 in Saccharomyces cerevisiae☆