Liquid–liquid equilibrium extraction ofethanolwith mixed solvent for bioethanolconcentration
HiroakiHabaki,Haihao Hu,RyuichiEgashira*
Department ofInternationalDevelopment Engineering,Graduate SchoolofScience and Engineering,Tokyo Institute ofTechnology,Tokyo 152-0000,Japan
1.Introduction
The production of fuels derived from biomass has been developed based on carbon neutralconceptto reduce netcarbon dioxide emission.Bioethanol,one of the modern forms ofbiomass fuels,has the potential to be a sustainable transportation fuelreplacing currentmotorgasoline,and the demands ofbioethanolare expanding in recent year.
Bioethanolis produced from the fermentation of the biomass and the mass fraction of ethanol in the aqueous fermentation solution is around 0.15 atmost.According to the specifications of ethanol solution for blending motor gasoline,the mass fraction of ethanolis needed to be adjusted higher than 0.992[1].Since the ethanol–water system forms azeotropic mixture at0.96 of ethanolby mass fraction,it is impossible to concentrate the ethanol content in the aqueous solution higher than the azeotrope point from the fermented solution only by the ordinary distillation technique.
Generally the concentration of ethanolcontentshould be conducted by 2 steps;pre-concentration and dehydration steps[2–6].In the first preconcentration step,the mass fraction ofethanolshould be increased up to around 0.9,and in the followed dehydration step,the anhydrousethanol solution would be obtained to meetthe specification.For this bioethanol concentration and dehydration process,various kinds of separation techniques have been proposed,such as the membrane separation,adsorption,ordinary solvent extraction,and supercritical fluid extraction.The ordinary extraction technique has been studied as both methods of the pre-concentration and dehydration,and the liquid–liquid equilibrium data for ethanol,water and severalorganic liquids have been measured[7,8].Gasoline was tested as extraction solvent to produce gasohol[9].This process was evaluated to be very effective to dehydrate the concentrated ethanolsolution but the heat duties required at the reboilers were estimated to be relatively high because of the large throughputof gasoline.A large number oforganic solvents have been examined to measure the extraction of ethanol,such as hydrocarbons of alkanes and aromatics,highercarboxylic acid,and higheralcohol.The solventof m-xylene showed high separation selectivity ofethanolrelative to water[10]butthe distribution coefficient ofethanolwas relatively small.Furfural,a kind of aldehydes and commercially used as an extraction solvent for re fining lube oil,can be considered to be a favorable solvent,because generally aldehydes have high ethanolsolubility.However the liquid–liquid equilibrium data ofethanolwith aldehyde solvents has not been fully studied yet.
The objective of this study was to apply the solventextraction ofethanolwith aldehyde solventto the bioethanolconcentration process.Furfuraland benzaldehyde were selected from the aldehydes as extraction solvents,with which the solubility ofwater is small,expecting large distribution coefficient ofethanol.m-Xylene showed low distribution coefficient and better separation selectivity ofethanolrelative to water,as reported in the previous study[10].Then the mixing effects of m-xylene and employed aldehyde solvents on the ethanolconcentration would be also examined.The liquid–liquid equilibrium of ethanol,water and mentioned solvents was measured and the separation of ethanolfrom synthesized fermented ethanolsolution was discussed.
2.Liquid-liquid equilibrium measurement
2.1.Experimental
2.1.1.Materials
Special grade chemicals,ethanol,furfural,benzaldehyde and mxylene were purchased from Wako Pure Chemical Industries,Ltd.The purity ofeach compound was checked by gas chromatography before every run to con firm the mass fraction purity of higher than 0.99.
2.1.2.Procedure
Table 1 shows the experimentalconditions for liquid–liquid equilibrium extraction.The measurements were conducted with three kinds of pure solvents,such as m-xylene,furfuraland benzaldehyde,and two kinds of mixed solvents,the mixture of m-xylene and furfuralor benzaldehyde,respectively.The speci fied amountsof the ethanolfeed solution and solventwere putin conical flasks with screw tops,and continuously shaken in the isothermalbath for 48 h,when the equilibrium condition was assumed to have been reached.The two phases were then separated with a separating funneland the obtained solutions were analyzed by gas chromatography(Shimadzu Ltd.,GC-17A)with a flame ionization detector,in which the column temperature was maintained at 353 K for the initial 10 min,and then increased at 5 K·min-1up to 423 K.A Karl Fischer aquameter(Metrohm Ltd.,758 KFD Titrino)was used with dehydrated methanolof HYDRANAL methanoland titration solution of HYDRANAL composite 5,purchased from Sigma-Aldrich Co.,to measure the water concentration of each solution.
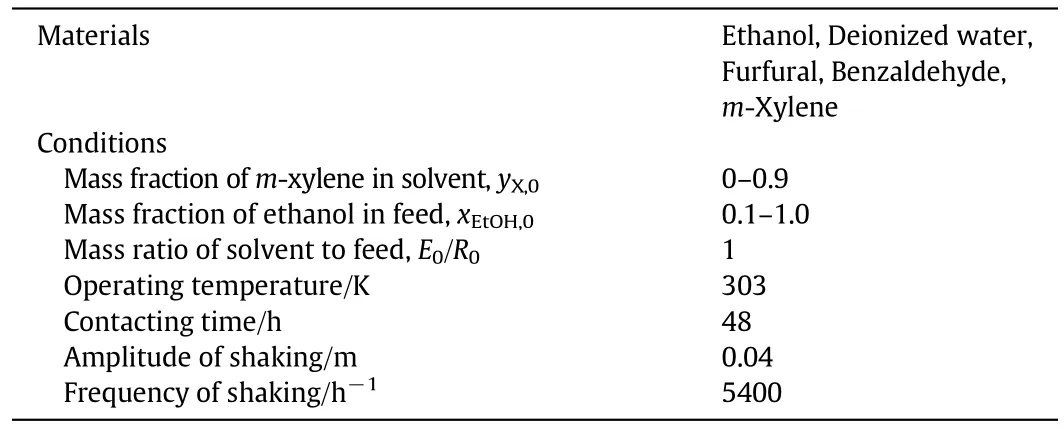
Table 1 Experimentalconditions for batch liquid–liquid equilibrium extraction
2.2.Results and discussion
For mostcases,the systems of the aqueous ethanolsolution and solvent mixtures were in liquid–liquid two phase regions,and did not form stable emulsion.The phase separations in liquid–liquid two phase regions were easily carried out.The systems without water content,i.e.the mixtures of the employed solventand pure ethanol,were in the homogeneous phase regions.In the cases offurfuraland benzaldehyde solvents,the densities of the extractphases(organic phases)were greaterthan those of the raf finate phases(aqueous phases)in the measured range.With m-xylene solvent,the densities of the raf finate phases were greaterthan those of the extract phases.When the mixed solvents were used,the densities of the extractphases were greater in the cases of yX,0<0.7,and in the concentration range of yX,0>0.7,those of the raf finate phases were greater.
The distribution ratio ofcomponent i,mi,was defined as,

where xiand yidenote the mass fractions ofcomponent i in the raf finate and extract phases at equilibrium,respectively.The mass fraction of ethanol in the extract phase on a solvent-free basis,y′EtOH,was expressed as,

The separation selectivity ofethanolrelative to water was defined as,

The experimentalliquid–liquid equilibrium data for the ternary and quaternary systems are shown in Appendix I.Fig.1 shows the triangular diagrams of the liquid–liquid equilibrium for ternary and quaternary systems.In the cases of quaternary systems,mass fraction of solvent was expressed by the sum of the mass fractions of two solvent components.The resultsof m-xylene–ethanol–watersystem in thisstudy were quite similar to those measured in the previous study[10].In the cases ofternary systems,two-phase region was the largestwith m-xylene solvent,followed by benzaldehyde and furfural,and the solubility curve with m-xylene solvent was close to that with benzaldehyde.When the mixed solvent of m-xylene and furfuralor benzaldehyde of yX,0=0.5 was used,the region of two liquid–liquid phase was significantly enlarged in the case offurfuralsolvent,although the benzaldehyde solvent was little affected by the addition of m-xylene.Then the effects of the mass fraction of m-xylene in the m-xylene and furfuralmixture solvent,yX,0,on the liquid–liquid equilibrium were examined,as shown in Fig.1(c).The effects of yX,0on the ethanoldistribution were apparent and the two phase region was simply enlarged as yX,0increased.The liquid–liquid equilibrium of ethanol–water–furfural–m-xylene system was estimated by the NRTL model,one of the most popular thermodynamic models.The activity coefficient was expressed as,
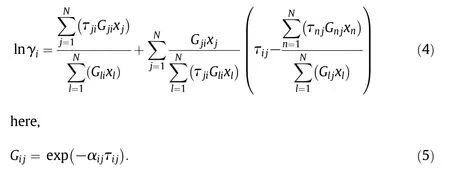
The values ofτijwere obtained by fitting the experimentalresults as shown in Fig.1(c),whereαijwas set as 0.2,and shown in Table 2.The estimation results are shown in Fig.1(c)as the dashed line.The liquid–liquid equilibrium with the employed system could be fully expressed by the NRTL modelwith the obtained parameters.
Fig.2 shows the plots of the ethanolmass fractions on a solvent-free basis in the extract phase,y′EtOH,against the initialethanolmass fractions in the feed solutions,xEtOH,0.For all the measurements,y′EtOHs were larger than xEtOH,0s for the respective conditions;that is to say ethanol was concentrated in the extract phase more than water.The y′EtOHincreased as xEtOH,0,attained each maximum value,and decreased in the larger range of xEtOH,0.As yEtOHincreased,the mass fraction of water in the extract phase should also increase and y′EtOHshould consequently decrease.The y′EtOHincreased in the orderoffurfural,benzaldehyde and m-xylene for the single solvents.With m-xylene solvent,y′EtOHgotso close to the mass fraction of azeotrope pointin ethanol–water system,0.96 ofethanol(mass fraction),but still was lower than azeotrope point.When the mixture solvents of yX,0=0.5 were used,y′EtOHs were larger with benzaldehyde than those with furfural.In the cases of m-xylene and furfuralmixtures,y′EtOHincreased as yX,0.In the cases of the mixture solvents of furfural and m-xylene,y′EtOHincreased as yX,0,and the efficiency of ethanol concentration was improved as yX,0increased.
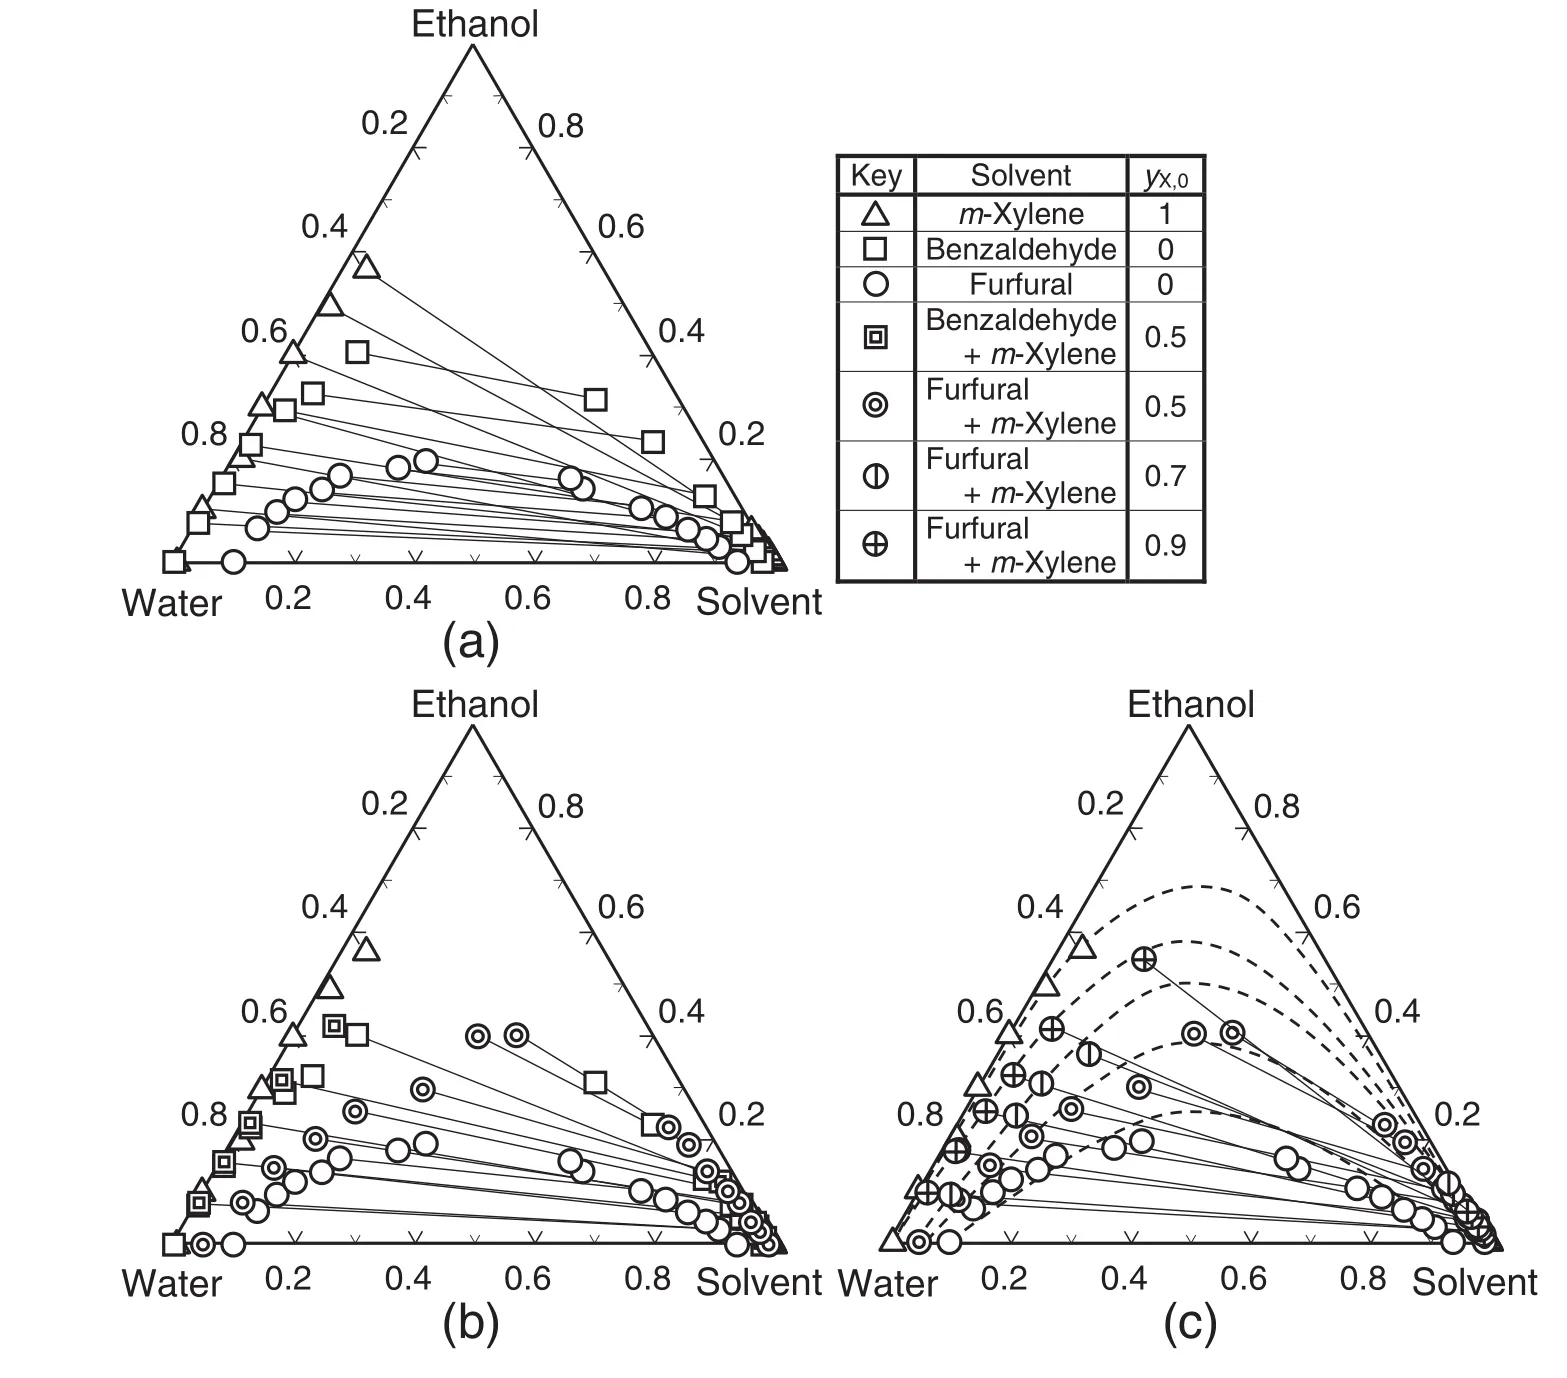
Fig.1.Triangular diagrams of liquid–liquid equilibrium for ternary and quaternary systems.(a):Ternary systems with pure solvents of m-xylene,benzaldehyde and furfural.(b):Quaternary systems with solvent mixtures of m-xylene and benzaldehyde or furfuralat y X,0=0.5.(c):Quaternary systems with solvent mixture ofm-xylene and furfuralin the range of y X,0 from 0.5 to 0.9.

Table 2 NRTL Parameters ofτi,j for ethanol–water–furfural–m-xylene system
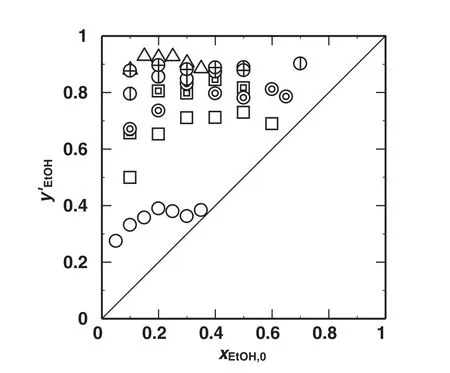
Fig.2.Effects of initialethanolmass fractions in feed solutions,x EtOH,0,on mass fraction ofethanolon a solvent-free basis in the extract phase,y′EtOH.Keys are the same as used in Fig.1.
Fig.3 shows the plot of the separation selectivity ofethanolrelative to water,βEtOH,W,againstthe distribution coefficientofethanol,mEtOH.For any solvent,βEtOH,Wdecreased as mEtOHincreased.The βEtOH,Wwith m-xylene was the largest among the employed solvents,followed by benzaldehyde and furfural.The mEtOHwas larger with furfural or benzaldehyde than that with m-xylene,and those with furfural and benzaldehyde were in comparable level.The solventmixture offurfural and m-xylene showed the higher mEtOHandβEtOH,Wthan that of benzaldehyde and m-xylene when yX,0=0.5.As yX,0increased,βEtOH,Wincreased and mEtOHwas little affected to be kept in the relatively large range.Accordingly the mixture solvent of furfural and m-xylene at yX,0=0.9 was expected as a better solvent to concentrate ethanol.
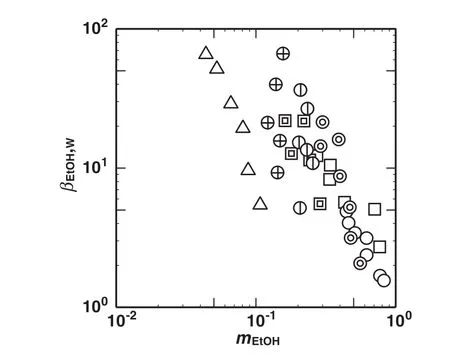
Fig.3.Effects ofdistribution coefficient ofethanol,m EtOH,on separation selectivity ofethanolrelative to water,βEtOH,W.Keys are the same as used in Fig.1.
3.Process simulation for pre-concentration of ethanol
3.1.Simulation
The extraction ofethanolfromthe fermented broth solution was numerically simulated with a countercurrent multistage extractor by continuous operation.The schematic diagram of the extractor is shown in Fig.A1 of Appendix II,and the simulation conditions are shown in Table 3.The feed ethanolsolution and solvent were countercurrently contacted in the extractor.The material balances for all components and component i at each stage k are represented by,

where Rk,Ek,xk,iand yk,irepresent the mass flow rates of the raf finate and extract,and the mass fraction of component i at the k-th stage.The constrains on the mass fractions of component i are shown as,


Table 3 Principalcalculation conditions for countercurrent multistage extraction
The totalyield ofethanol for this process was defined as,

The assumption ofequilibrium stage was valid for each stage,and the liquid–liquid equilibrium relationship was predicted by the NRTL model with the parameters obtained above.The process for preconcentration ofethanolby extraction was simulated to evaluate the efficiency of ethanol concentration.
3.2.Simulation results and discussion
Fig.4 shows the effects of the totalstage number of the extractor,n,on the mass fraction ofethanolin the extract phase from the 1st stage on a solvent-free basis,y′0,EtOH.The y′0,EtOHincreased as the totalstage number of the extractor.The change of y′0,EtOHwas significant in the range of 1<n<3,and got gradualin the range of n>3.Fig.5 shows the effects of solvent/feed flow ratio,S/F,on the yield ofethanol,YEtOH,and y′EtOHin the case of n=5.The YEtOHdrastically increased and y′EtOHgradually decreased as S/F increased.To attain the yield of 0.9,the extraction should be operated in the range of S/F>9,and this value might be infeasible for the practicaluse.Generally the solventrecovery unit should be necessary and distillation operation is commonly used.In this case,to attain higher yield ofethanol,the ethanolin the raffinate should be recovered and the distillation operation would be necessary as well.Accordingly this extraction process should require two distillation columns atleast.Then the process evaluation should be developed with both the pre-concentration and dehydration processes.

Fig.4.Effects of stage number ofextractor on mass fraction of ethanolin extract phase from the 1st stage on a solvent-free basis,y′0,EtOH,at S/F=1.
4.Conclusions
The liquid–liquid equilibria ofethanolin the ternary and quaternary systems were measured with the solvents of m-xylene,benzaldehyde and furfuralfor the purpose of the ethanolconcentration in the aqueous solution.The liquid–liquid two-phase region was the largest with mxylene solvent,followed by benzaldehyde and furfural.The region of two liquid–liquid phases became larger with the mixed solvent of mxylene and furfuralthan that with furfuralsolvent,and it was enlarged as the content of m-xylene in the solvent increased.The NRTL model was applied to the ethanol–water–furfural–m-xylene system,and the modelcould wellexpress the liquid–liquid equilibrium of the system.
For any solvent,the separation selectivity of ethanol relative to water decreased as the distribution coefficient of ethanol increased.The separation selectivity with m-xylene was the largest among the employed solvents,followed by benzaldehyde and furfural.The solvent mixture of furfural and m-xylene showed relatively high distribution coefficient of ethanol and separation selectivity,even in the higher mass fraction of m-xylene in the solventphase.Accordingly the mixture solvent offur fural with higher mass fraction of m-xylene was expected as a better solventto concentrate ethanol.
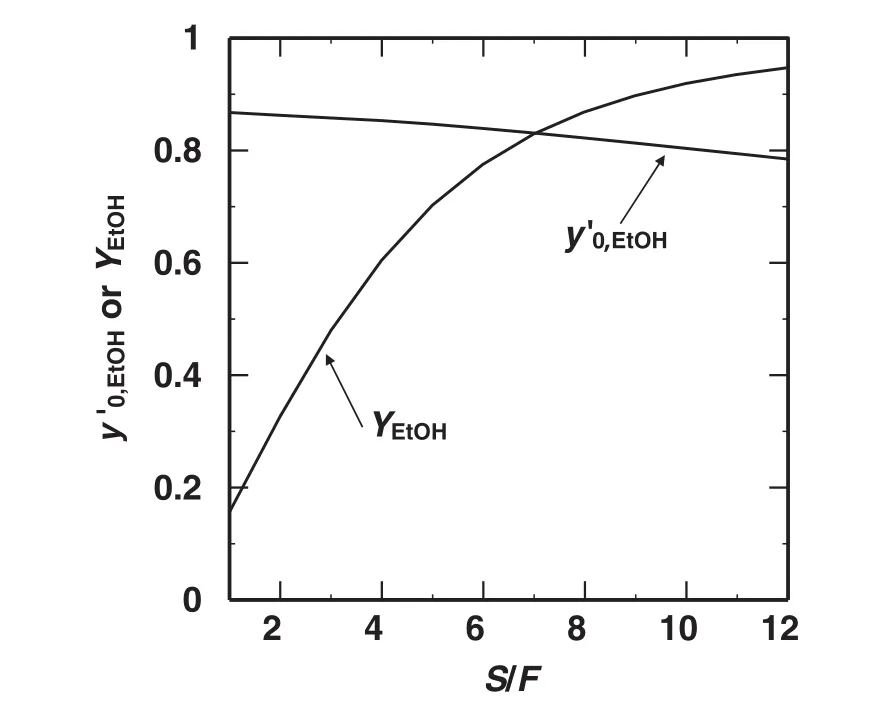
Fig.5.Effects of S/F on the yield ofethanol,Y EtOH,and y′EtOH at n=5.
Then the ethanolextraction with a countercurrent multistage extractor by a continuous operation was simulated to evaluate the extraction performance.The ethanolcontent could be concentrated in the extract phase with relatively smallnumber of extraction stages but low yield of ethanolwas obtained.To enhance the yield,the ethanolrecovery from the raf finate should be necessary and the process performance should be evaluated by the whole process including the dehydration step.
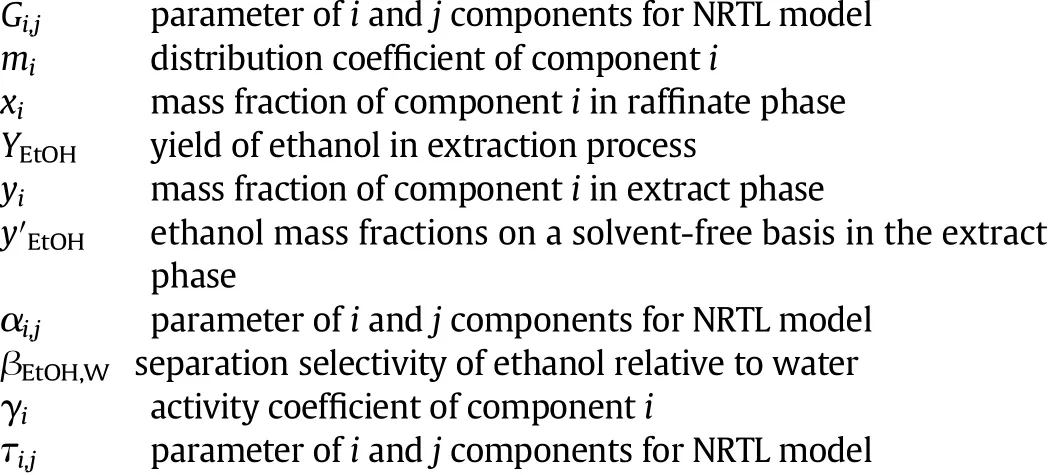
Nomenclatures
Subscripts
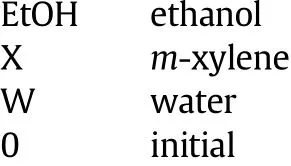
Appendix I
The numericaldata of the liquid–liquid equilibrium measurements are listed in Tables A1 to A6.
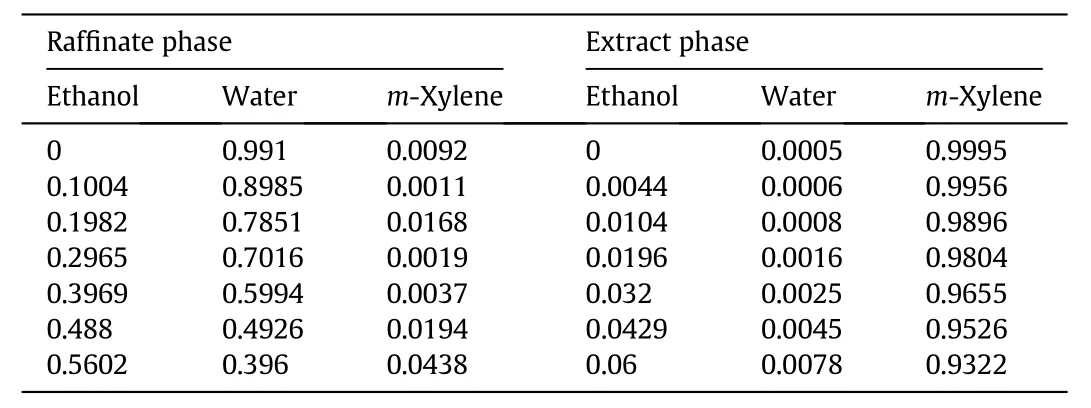
Table A1 Liquid–liquid equilibrium data ofethanol–water–xylene ternary systems at 298 K(mass fraction)
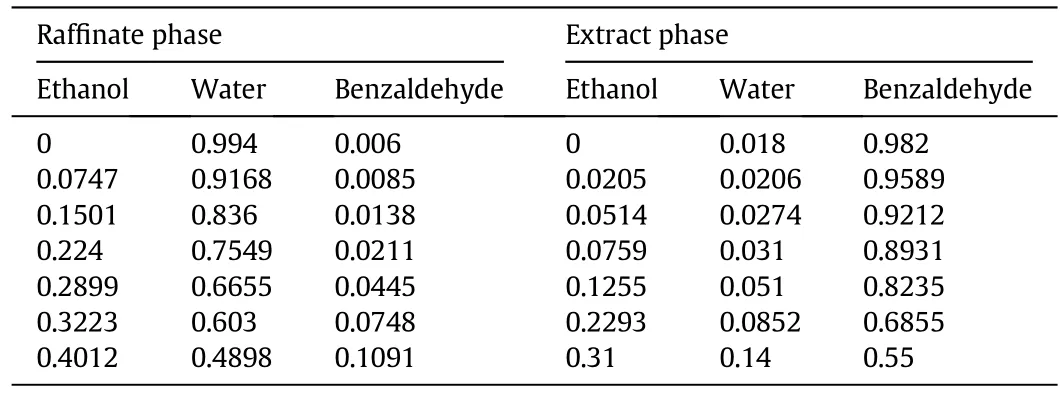
Table A2 Liquid–liquid equilibrium data ofethanol–water–benzaldehyde ternary systems at 298 K(mass fraction)

Table A3 Liquid–liquid equilibrium data of ethanol–water–benzaldehyde–xylene quaternary systems at 298 K and y0,X=0.5(mass fraction)

Table A4 Liquid–liquid equilibrium data ofethanol–water–furfural–xylene quaternary systems at 298 K and y0,X=0.5(mass fraction)

Table A5 Liquid–liquid equilibrium data of ethanol–water–furfural–xylene quaternary system at 298 K and y0,X=0.7(mass fraction)
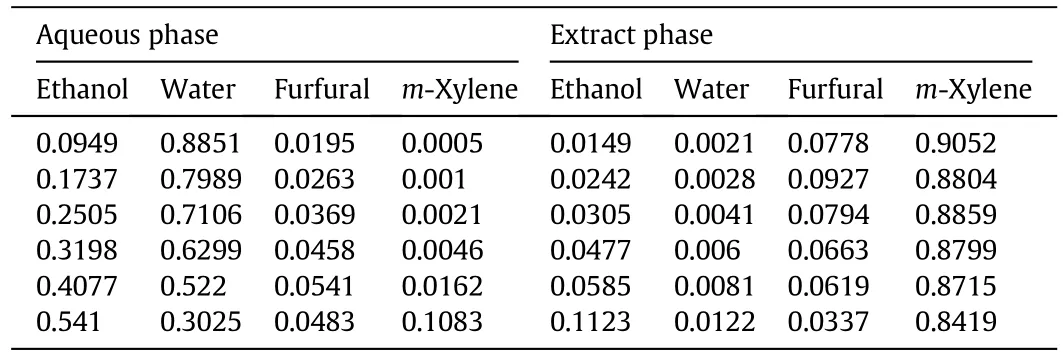
Table A6 Liquid–liquid equilibrium data of ethanol–water–furfural–xylene quaternary system at 298 K and y0,X=0.7(mass fraction)
Appendix II
The process description used in the process simulation was shown in Fig.A1.
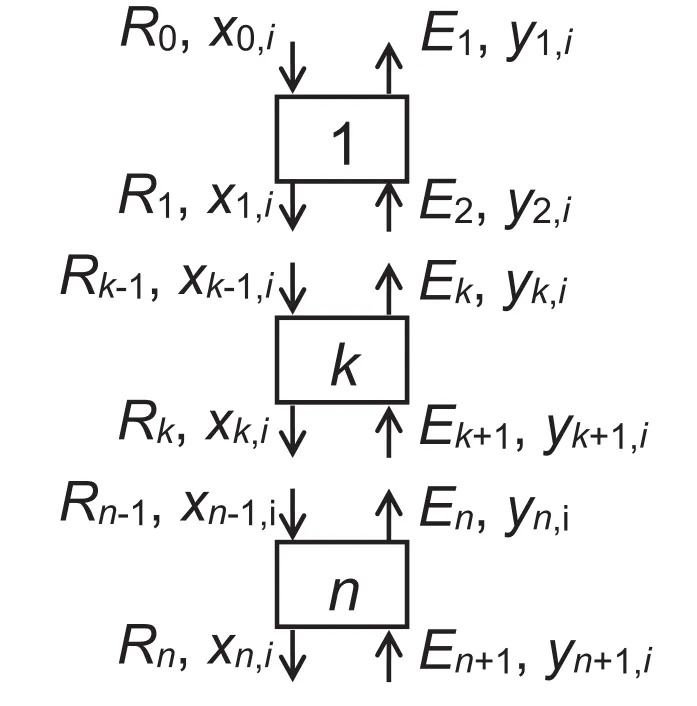
Fig.A1.Schematic diagram ofcountercurrent multistage extractor by continuous operation for ethanolconcentration.
[1]Japan Automobile Manufacturers Association,Quality of bio-ethanol and use of ethanol-blended gasoline,JAMA Position Statement,FQ-01,2009.
[2]W.L.Luyben,Controlof a multiunit heterogeneous azeotropic distillation process,AIChE J.52(2)(2006)623–637.
[3]Y.Morigami,M.Kondo,J.Abe,H.Kita,K.Okamoto,The first large-scale pervaporation plant using tubular-type module with zeolite NaA membrane,Sep.Purif.Technol.25(1–3)(2001)251–260.
[4]S.Al-Asheh,F.Ganat,N.Al-Lagtah,Separation ofethanol–water mixtures using molecular sieves and biobased adsorbents,Chem.Eng.Res.Des.82(7)(2004)855–864.
[5]S.Diaz,H.Gros,E.A.Brignole,Thermodynamic modeling,synthesis and optimization of extraction–dehydration processes,Comput.Chem.Eng.24(9-10)(2000)2069–2080.
[6]J.W.Roddy,Distribution of ethanol–water mixtures to organic liquids,Ind.Eng.Chem.Process.Des.Dev.20(3)(1981)104–116.
[7]J.W.Roddy,C.F.Coleman,Distribution ofethanol–water mixtures to normalalkanes from C6 to C16,Ind.Eng.Chem.Fundam.20(3)(1981)250–254.
[8]A.M.Dadgar,G.L.Foutch,Evaluation of solvents for the recovery of clostridium fermentation products by liquid–liquid extraction,Biotechnol.Bioeng.Symp.15(15)(1985)612–617.
[9]A.Chianese,F.Zinnamosca,Ethanol dehydration by azeotropic distillation with a mixed-solvent,Chem.Eng.J.43(1990)59–65.
[10]H.Habaki,O.Tabata,J.Kawasaki,R.Egashira,J.Jpn.Pet.Inst.53(3)(2010)135–143.
 Chinese Journal of Chemical Engineering2016年2期
- Chinese Journal of Chemical Engineering的其它文章
- Relationship between breakthrough curve and adsorption isotherm of Ca(II)imprinted chitosan microspheres for metaladsorption☆
- Experimental study on the effects of big particles physical characteristics on the hydraulic transport inside a horizontal pipe
- Investigation of extraction fraction in con fined impinging jet reactors for tri-butyl-phosphate extracting butyric acid process☆
- Experimental evaluation and modeling of liquid jet penetration to estimate droplet size in a three-phase riser reactor
- Photorheologically reversible micelle composed ofpolymerizable cationic surfactant and 4-phenylazo benzoic acid☆
- Review on current advances,future challenges and consideration issues for post-combustion CO2 capture using amine-based absorbents☆
