Experimental study on the effects of big particles physical characteristics on the hydraulic transport inside a horizontal pipe
Salah Zouaoui*,Hassane DjebouriKamal Mohammedi,So fiane Khelladi,Aomar Ait Aider
1 LMSE Laboratory,Mouloud Mammeri University of Tizi-Ouzou,P.O.Box 17 RP15000,Algeria
2 LEMILaboratory MESO,M'Hamed Bougara University of Boumerdes,35000,Algeria
3 DynFluid Laboratory,Arts et Metiers Paris Tech,151 boulevard de l'Hôpital,75013 Paris,France
1.Introduction
During these last decades,the demand of mineral materials from emerging countries strongly increased,causing the exploitation of new deposits.For this reason,several firms have recently launched a subsea mining project study,and the main task was to estimate the pressure drop of solid–liquid mixture in the flow line for various flow regimes.In this case,the circuit would have various and complex shapes,including vertical,horizontal ones,potentially bends,and S-shapes.
In general,solid transport is divided into three major flow patterns[1]:
(1)Pseudo-homogeneous or homogeneous flow and heterogeneous flow.
(2)Heterogeneous and sliding bed flow(or moving bed flow).
(3)Saltation and stationary bed flow.
In a pseudo-homogeneous flow case,the particles are distributed almost uniformly over the pipe cross-section and moved at a very high velocity.When the flow velocity of the particles decreases,the heterogeneous flow pattern occurs if there is a concentration gradient in the direction perpendicular to the pipe axis.Most of particles are carried out in the lower part of the pipe cross-section.
Transporting solid particles in a fluid flow is very complex.Many researchers have tried to create a mathematical modelin order to predict the head losses in slurry transport.Such as the models of Zandi[2],Turian and Yuan[3],Doron et al.[4],Doron and Barnea[5],Wilson and Pugh[6],Matousek[7],Bratland[8],and references therein.Lahiri and Ghanta[9]proposed a hybrid supportvector regression-genetic algorithm approach to predicting the pressure drop of solid–liquid slurry flow.Recently,Edelin etal.[10]reported an experimental investigation of the transportof fluids composed ofwater and smallsize polypropylene particles,in order to study the transport of floating particles,also to determine the conditions that minimize the energy consumed by installations designed to this type of flow.These models enabled a fast and a global approach of the transported solid quantity in fluid flows,butthey are generally approximate[11].A predictive model for transporting large particles in vertical pipes was proposed and rati fied on a set ofexperimental data,based on the work ofNewitt etal.[12],Richardson and Zaki[13],Xia etal.[14],and Yoon etal.[15].In horizontal pipes,the prediction of the flow patterns and pressure gradient known as a complex problem is treated via experimental correl ations.Some of them are restricted to one ortwo flow patterns[16–18].However,differentauthors[12,19–21]claim to apply these correlations for all flow patterns of liquid–solid systems.Miedema[22,23]proposed a new head loss model for slurry transport in the heterogeneous regime.This model shows resemblance with the Durand and Condolios[24]model.However the in fluence of the pipe diameter is much less matching the experimental results in larger pipes.
Many parameters are needed to describe the solid transport,such as water flow rate and solid particles,particle density and diameter,and the pressure drop along the pipe.This lastis considered to be the mainly important parameter in solid–liquid flow.Most investigations carried out concerns only the very small ratio of particle to pipe diameter and low solid concentration.In this present study,an experimental investigation is conducted in a small scale to identify the effects of physical characteristics of big particles on the hydraulic transport in horizontal pipe.Moreover,in fluence of concentration,size and density of particles on the pressure drop,and mixture velocity above which the bed starts to move(critical velocity)are highlighted.Also,this work allows one to understand the blocking problem of the pipelines transporting water-solid mixture.
2.Experimental Device
2.1.Test loop
We performed a series oftests with the experimental loop shown in Fig.1,and the different materials used are described below.We focused on the liquid–solid flow in a horizontalrigid pipe of length L=2×2 m and diameter D=60 mm.This tube carries a 180°horizontal curve with 30 cm of diameter curvature.The test loop composed with a pump to supply the circuitwith clear water and an injection system for solid particles.The particles fall down by gravity through a flexible tube connecting the bottom of particle tank to the main duct via a buffer zone.The last one,situated between the two valves is divided into three compartments of known capacity,allows us to determine the mean solid flow rate.The flow rate of injected particles into the pipe is adjusted by the lower valve(Fig.1).Globally the particles flow is relatively stable and uniform,since we are dealing with a mean particles flow rate through measurement of time elapsed between opening and closure of the lowervalve.The mixture arrives finally in a systemto separate the solid from the liquid.This system consists of a firsttank with a filter to recover the solid particles and allows only water to pass to the second tank.In order to realize a closed circuit for water,the second tank is connected to a pump which delivers the water into the circuit(Fig.1).
2.2.Particles and pipe
The circuit is constructed with Plexiglas tube to allow the visualization of the flow.The calibrated beads of alumina(Umicore,Alumina Degussit 92%,with a relative size dispersion of 10%),and glass(SiLi,SiLibeads type M,with a relative dispersion of size of 4%)are used[11].The particles are relatively large,with size up to 25%of the pipe diameter.Their physical and geometrical characteristics are summarized in Fig.2.
2.3.Control parameters
To masseur the flow parameters,we need some necessary measuring instruments.The water flow rate is measured using an electromagnetic flow meter(KROHNE Opti flux 2000),and adjusted using a pump's variator.The flow rate of solids is controlled by a device designed and realized in the laboratory.Optical measurements are also performed with a high-speed camera(Optronis CamRecord600).Typically 1000 images are recorded with a resolution of 1280×1024 pixels at a frame rate of 500 Hz.The flow is illuminated backwards with a LED plate from Phlox,and the pressure drop is measured using two differential pressure sensors(VEGADIF65,VEGA,Germany).
The aim of the present work is to measure the pressure drops in different parts of the test loop as a function of solid concentration and mixture velocity.The parameters that are adjusted with experimental means are the volumetric flow rates of liquid(Ql)and of solids(Qs).To present the results we define the mixture velocity(Um)and the delivered concentration(C)as follows:

where S is the cross-section area of the pipe,and the mixture velocity(Um)presents a volumetric average of the velocities of each phase.
The pressure drops(G)are expressed in terms of hydraulic gradients(meters of water column per meter of pipe):

where ρeis the water density equal1000 kg·m-3and L the distance between the pressure taps equalto 1.4 m.
3.Results and Discussion
The thick black line in all figures stands for the measured hydraulic gradient with pure water flowing(C=0%).The Reynolds number is 105and the flow is fully turbulent and the estimated rugosity is 20μm.We observe inside the pipe that the pressure drop and the mixture speed start to increase with quadratic rate,and the curve has the form:
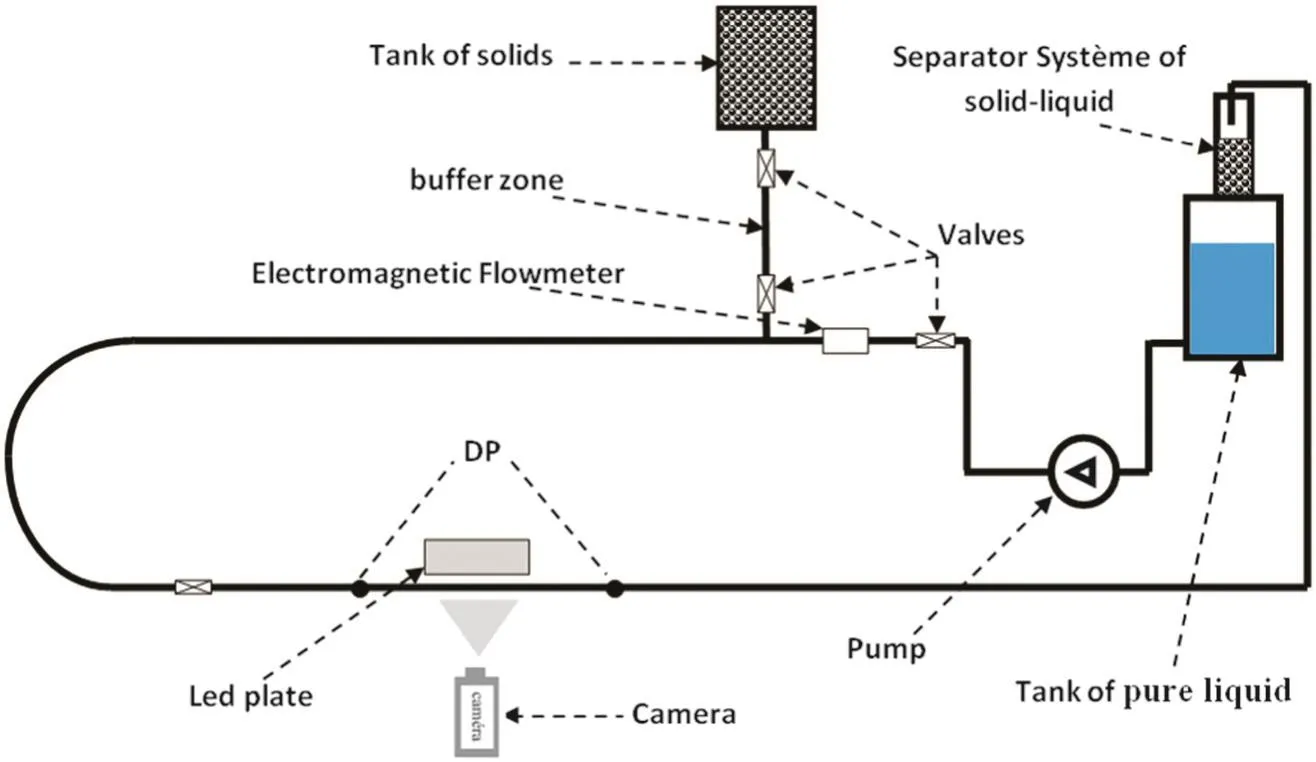
Fig.1.Sketch oftest loop.

Fig.2.Physical characteristics of the calibrated beads.

where the friction coefficientλis calculated by the Cole brook formula.
All curves in this study present the evolution of the hydraulic gradient as a function of the mixture speed for different particles types(alumina and glass)with different size and concentration.We see that for all the speed flow,the pressure drop is much higher than in the case of clear water.Moreover,the pressure drop curve does not vary monotonically with the mixture velocity.Following the definition of Doron etal.[4],the mixture velocity corresponding to the minimum hydraulic gradient is called the critical velocity(Uc).
Some pictures taken for the glass beads of diameter 10 mm at C=10%,are presented in Fig.3 for different velocities.It shows that the flow regimes vary with the mixture speed:at low mixture speed we see the presence of a compactstationary bed at the bottom of the pipe(Fig.3a);around the critical velocity(Uc)we observe a compact moving bed(Fig.3b);at high speed,as we can see also a pseudo homogeneous dispersed flow(Fig.3c).
3.1.Effects of concentration of alumina and glass particles
This subsection is devoted to the comparison of the pressure drop curves with various concentrations and identical physical characteristics of the beads(density,size).
The effects of the concentration are shown in the Figs.4 to 7.
From Figs.4 to 7,we note that the increase in the delivered concentration leads to an increase in the pressure drop.Furthermore,the change in the concentration seems to increase only slightly the critical velocity(Fig.4).Please note that with 5%concentration in most figures the pressure curves crosses the pure watercurve(C=0%)in Figs.5 to 7,due to the measurements errors.

Fig.4.Hydraulic gradient versus speed mixture.Alumina's concentration effect of6 mm size.
The curvature of the pressure drop evolution in solid–liquid flow is due to the various flow regimes in horizontal pipe.At high mixture velocities(Um>Uc),where the particles are suspended,the pressure drop is usually somewhat higher than that of the carrier liquid(water).We are in pseudo-homogeneous dispersed flow with a vertical concentration gradient(Fig.3c).Reduction of the mixture velocity(Um≈Uc),the concentration of particles in the bottom of the pipe reaches the compactness limit,leads to a moving bed formation(Fig.3b)and to pressure drops much higher than those of the pure water.For even lower speeds(Um<Uc),a stationary bed is formed below a moving bed(Fig.3a).So there are two or three layers.
For the case of alumina beads of6 mm,density ρal=3650 kg·m-3,and delivered concentration C=5%,the magnitude of the minimal pressure drop at the criticalvelocity Uc≃2.3 m·s-1is Gc≃0.11 m·m-1(Fig.4).

Fig.3.Pictures illustrating the different flow regimes with increasing mixture speed.(Glass beads 10 mm,C=10%).a)Compact stationary bed,b)compact moving bed,c)pseudo-homogeneous dispersed flow.

Fig.5.Hydraulic gradient versus speed mixture.Alumina's concentration effect of15 mm size.
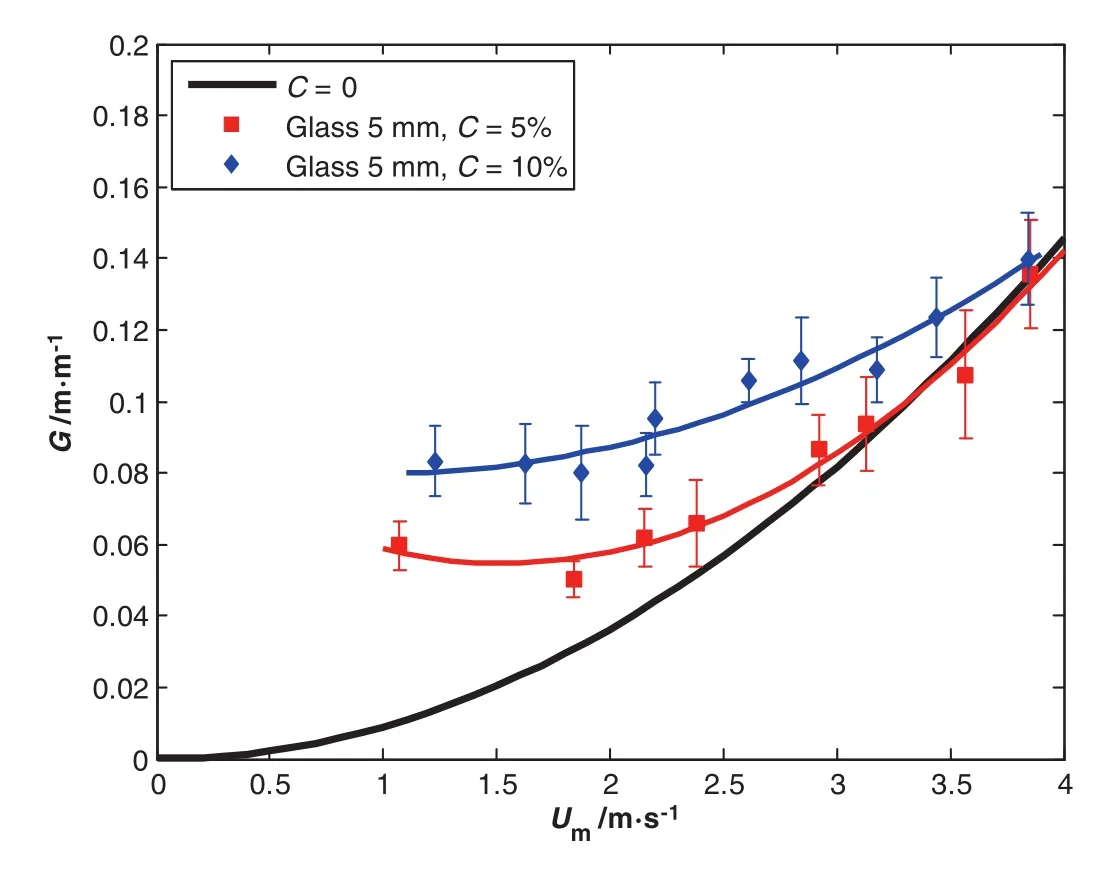
Fig.6.Hydraulic gradient versus speed mixture.Glass's concentration effect of5 mm size.
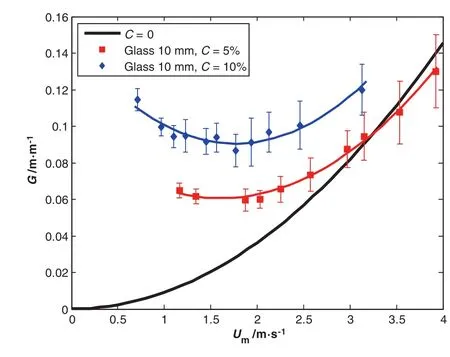
Fig.7.Hydraulic gradient versus speed mixture.Glass's concentration effect of10 mm size.
3.2.Density effects
Figs.8 and 9 show experimental measurements of the pressure drop for the two types of solids(alumina and glass)with almostsimilar size(dp≃5 mm)and two different densities,respectivel yρal=3650 kg·m-3and ρG=2500 kg·m-3for two differentconcentrations,respectively C=5%and C=10%.
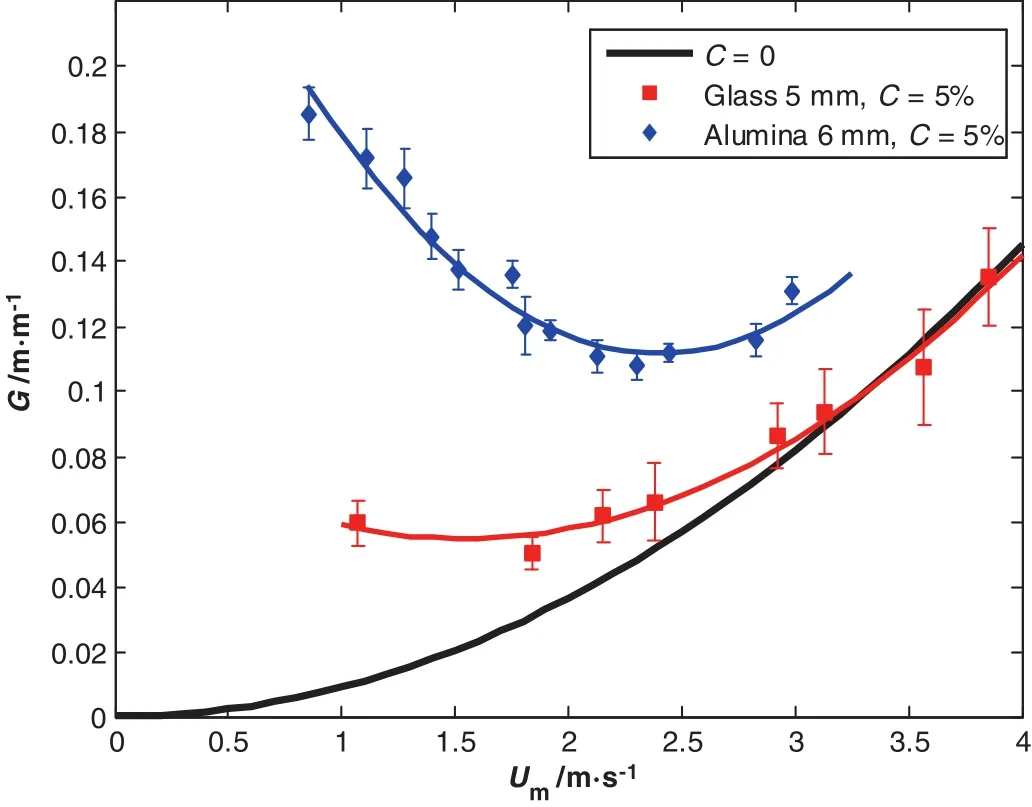
Fig.8.Hydraulic gradient versus speed mixture.Density effect for C=5%.
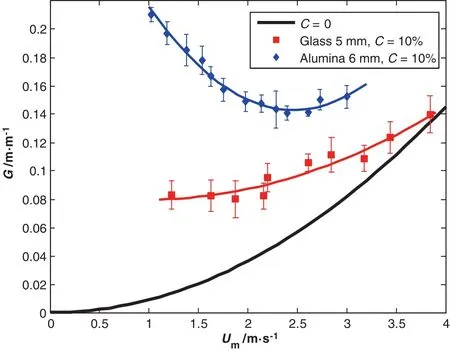
Fig.9.Hydraulic gradient versus speed mixture.Density effect for C=10%.
We note that the increase in density leads to a considerable increase in the pressure loss and the criticalspeed.The shape of these curves is very similar to the work of Newitt etal.[12],Doron etal.[4],and Ravelet et al.[11].
3.3.Size effects
To illustrate the effect of the size on the solid particles on the pressure drop we take the same types of particles(density)with the same concentration.Figs.10 and 11 show the alumina size effect on the hydraulic gradient with,respectively,5%and 10%of concentration.
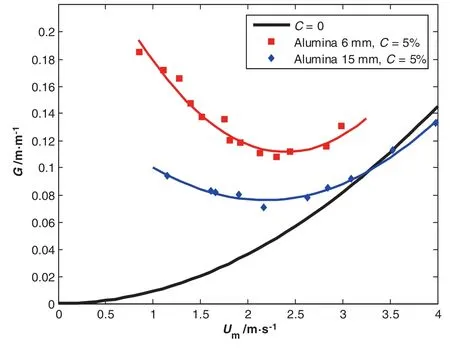
Fig.10.Hydraulic gradient versus speed mixture.Alumina's size effect with C=5%.
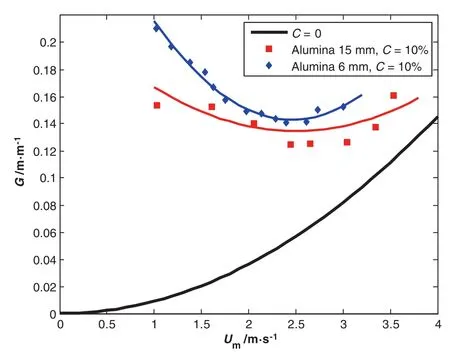
Fig.11.Hydraulic gradient versus speed mixture.Alumina's size effect with C=10%.
Figs.12 and 13 show the glass bead size effect on the hydraulic gradient with,respectively,5%and 10%of concentration.
We perform the comparison of the two sizes ofbeads with same specific mass at the same concentration,and we observe that the effects of the alumina size on the pressure drop are to decrease by large particles.However,the critical velocity does not seem to be affected by the particle size.Such behavior is found in the results of Raveletetal.[11].We notice that this outcome has not been reported in previous works,mainly dealing with particles below 4 mm.On the other hand,we can't con firm this result for the glass particles(Figs.12 and 13).
4.Conclusions
In this work,the water/solid particle flow inside a pipe was visualized and measured pressure drop as a function of the solid–liquid mixture speed studied.Calibrated beads of alumina and glass with different sizes and densities were used.The particles are relatively large with sizes between 8%and 25%of the pipe diameter.The main results are summarized below:
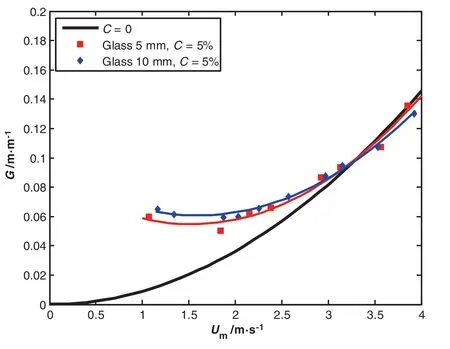
Fig.12.Hydraulic gradient versus speed mixture.Glass's size effect with C=5%.
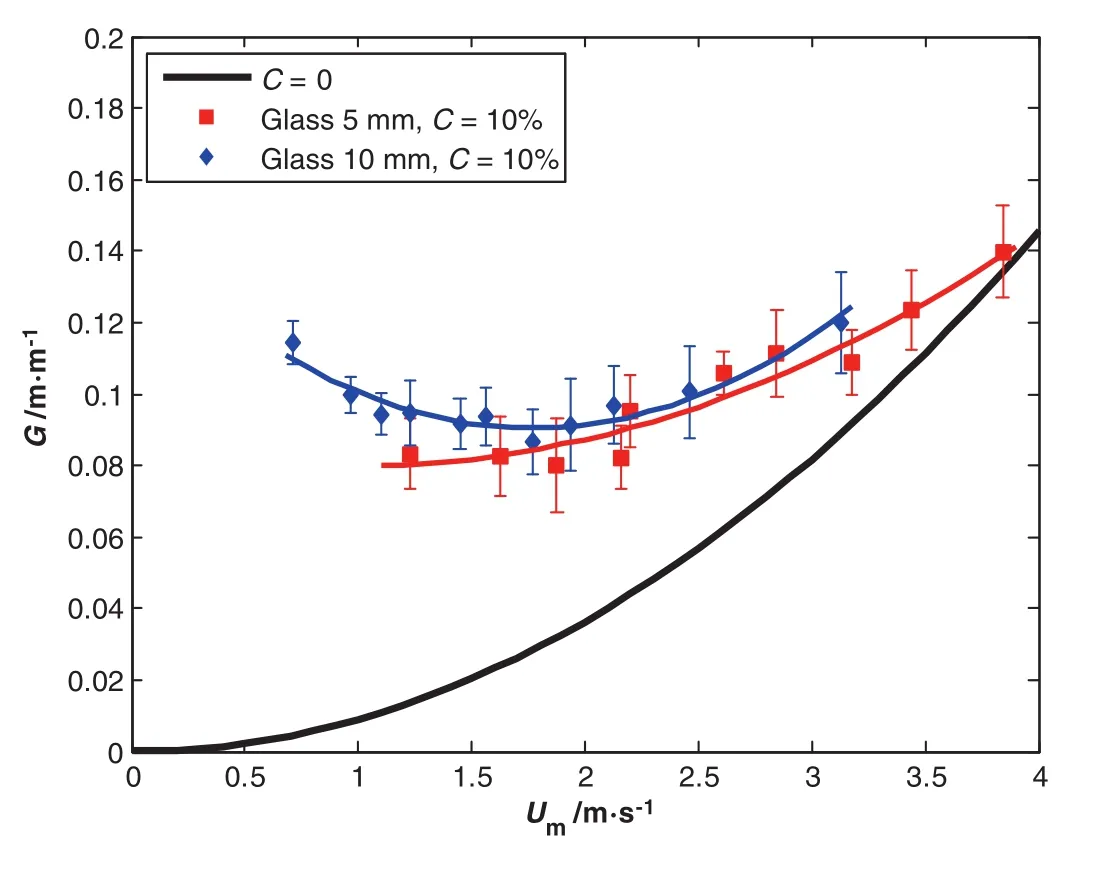
Fig.13.Hydraulic gradient versus speed mixture.Glass's size effect with C=10%.
·The pressure drop is higher with solid particles.
·For Um<Uc,a flow regime with a stationary bed is observed and above this bed is flowing a ball-compact layer.As a result,the pressure drop increases.
·When Um>Uc,the particles are keptin suspension and the pressure drop curves follow the trend of clear water curve.We observe a pseudo-homogeneous dispersed flow.
·Around the critical velocity Uc,a separate flow regime with a compact moving bed is noted.
·When the concentration increases,the pressure drop increases and the criticalspeed increases slightly.
·The pressure drop and the critical velocity increase when the density increases.The density has a strong effect on the transition point between the stationary bed flow and the dispersed flow.
·The hydraulic gradient decreases with an increase in the alumina particle size in a horizontal pipe for a given specific mass and concentration.However,for glass particles,the result is not confirmed yet.
The obtained data are so difficult to model because of many factors affecting the pressure drop and their relative importance varies drastically with the velocity.The efforts are to be devoted to establishing reliable pressure drop correlations.
Nomenclature

Acknowledgments
This research was supported by the DynFluid Laboratory at Arts et Métiers Paris Tech.We would like to express our gratitude to Pr.Farid BAKIR for his assistance in the design and development of the experiment.
[1]P.Doron,D.Barnea,Flow pattern maps for solid–liquid flow in pipes,Int.J.Multiphase Flow 22(1996)273–283.
[2]I.Zandi,Hydraulic transportofbulky materials,in:I.Zandi(Ed.),Advances in solid–liquid flow in pipes and its applications,Pergamon Press,Oxford 1971,pp.1–34.
[3]R.M.Turian,T.F.Yuan,Flow of slurries in pipelines,AIChE J.23(1977)232–243.
[4]P.Doron,D.Granica,D.Barnea,Slurry flow in horizontal pipes,experimental and modeling,Int.J.Multiphase Flow 13(4)(1987)535–547.
[5]P.Doron,D.Barnea,A three layer model for solid liquid flow in horizontalpipes,Int.J.Multiphase Flow 19(6)(1993)1029–1043.
[6]K.C.Wilson,F.J.Pugh,Dispersive-force modeling ofturbulent suspension in heterogeneous slurry flow,Can.J.Chem.Eng.66(1988)721–727.
[7]V.Matousek,Flow mechanism of sand/water mixtures in pipelines(PhD Thesis)Delft University of Technology,Delft,Netherlands,1997.
[8]O.Bratland,Pipe Flow 2,Multiphase Flow Assurance,Electronic book,www.drbratland.com/PipeFlow2/index.html2010.
[9]S.K.Lahiri,K.C.Ghanta,Prediction ofpressure drop of slurry flow in pipeline by hybrid support vector regression and genetic algorithm model,Chin.J.Chem.Eng.16(6)(2008)841–848.
[10]D.Edelin,P.C.Czujko,C.Castelain,C.Josset,F.Fayolle,Experimentaldetermination of the energy optimum for the transport of floating particles in pipes,Exp.Thermal Fluid Sci.68(2015)634–643.
[11]F.Ravelet,F.Bakir,S.Khelladi,R.Rey,Experimentalstudy of hydraulic transport of large particles in horizontalpipes,Exp.ThermalFluid Sci.45(2013)87–197.
[12]D.M.Newitt,M.C.Richardson,M.Abbott,R.B.Turtle,Hydraulic conveying of solids in horizontalpipes,Trans.Inst.Chem.Eng.33(1955)93–113.
[13]J.F.Richardson,W.N.Zaki,Sedimentation and fluidisation,Trans.Inst.Chem.Eng.32(1957)35–53.
[14]J.X.Xia,J.R.Ni,C.Mendoza,Hydraulic lifting of manganese nodules through a riser,J.Offshore Mech.Arct.Eng.126(1)(2004)72–77.
[15]C.H.Yoon,J.S.Kang,Y.C.Park,Y.J.Kim,J.M.Park,S.K.Kwon,Solid-liquid flow experiment with real and arti ficial manganese nodules in flexible hoses,Proceedings of the Eighteenth International Off shore and Polar Engineering Conference,Vancouver,Canada 2008,pp.68–72.
[16]H.A.Babcock,The sliding bed flow regime,Hydrotransport I.Proceedings of the First International Conference on the Hydraulics of Transport of Solids in Pipes,Coventry,England,1970.
[17]M.Toda,H.Konno,S.Saito,Simulation of limit-deposit velocity in horizontalliquid–solid flow,Proceedings of the Seventh International Conference on the Hydraulic Transport of Solids in Pipes,Sendai,Japan,Paper J2 1980,pp.347–358.
[18]G.A.Wani,Criticalvelocity in multisize particle transport through pipes,Chapter 4 in encyclopedia of fluid mechanics,vol.5,Slurry Flow Technology,Gulf Publishing Company,Book Division,1986.
[19]J.W.Hayden,T.E.Stelson,Hydraulic conveyance of solids in pipes,in:I.Zandi(Ed.),Advances in solid–liquid flow in pipes and its applications,Pergamon Press,Oxford 1971,pp.149–163.
[20]R.M.Turian,T.F.Yuan,Flow of slurries in pipelines,AICHE J.23(1977)232–243.
[21]P.E.Baha Abulnaga,Slurry systems,handbook,McGraw-Hill,2002 4.1–4.66.
[22]S.A.Miedema,An overview of theories describing head losses in slurry transport:A tribute to some of the early researchers,ASME 32nd International Conference on Ocean,Offshore and Arctic Engineering,ASME,2013(V04AT04A038).
[23]S.A.Miedema,A head loss model for slurry transport in the heterogeneous regime,Ocean Eng.106(2015)360–370.
[24]R.Durand,E.Condolios,Etude expérimentale du refoulement des matériaux en conduites en particulier des produits de dragage et des schlamms,Deuxièmes Journées de l'Hydraulique(Grenoble)1952,pp.27–55.
 Chinese Journal of Chemical Engineering2016年2期
- Chinese Journal of Chemical Engineering的其它文章
- Relationship between breakthrough curve and adsorption isotherm of Ca(II)imprinted chitosan microspheres for metaladsorption☆
- Investigation of extraction fraction in con fined impinging jet reactors for tri-butyl-phosphate extracting butyric acid process☆
- Experimental evaluation and modeling of liquid jet penetration to estimate droplet size in a three-phase riser reactor
- Photorheologically reversible micelle composed ofpolymerizable cationic surfactant and 4-phenylazo benzoic acid☆
- Review on current advances,future challenges and consideration issues for post-combustion CO2 capture using amine-based absorbents☆
- Analysis of drop deformation dynamics in turbulent flow
