Analysis of drop deformation dynamics in turbulent flow
Stephanie Nachtigall*,DanielZedel,Matthias Kraume
Chair of Chemicaland Process Engineering,Technische Universität Berlin,Berlin 10587,Germany
1.Introduction
Turbulent dispersions of two immiscible liquids are part of various applications for example in chemical,food or pharmaceutica lindustries.Drop breakage and drop coalescence thereby determine the resulting drop size distribution(DSD).Consequently,both counteracting phenomena in fluence the interfacial area for energy or mass transfer between both phases and the resulting process efficiency.The great industrialimportance goes along with comprehensive scientific research activities over the last decades.In dispersed systems drop breakage and coalescence not only occur simultaneously but also in fluence each other.Therefore,they must be investigated separately to gain a more detailed understanding of differentin fluencing factors and the physical basics of each process.In orderto reduce the high amountof in fluencing factors of the whole process it is advantageous to analyze single droplets.No interactions between droplets can occur and they do not in fluence the flow structure,which was shown for example by Galinat et al.[1].
In this work drop breakage in turbulent flow is analyzed.The main focus lies on the drop deformation dynamics,which was found to be not negligible(for example[2,3]).For example the breakage time stillis discussed contradictorily[4]and,therefore,open for further improvements.
The basis and current state of the art of turbulent particle breakup will be described below.Furthermore,an overview of existing single fluid particle breakage investigations will be given,which shows the variety ofdifferent approaches existing in literature.Corresponding literature references,which focus on the description and experimentalanalysis of droplet breakup in laminar flow(for example[2,5,6])also exist.As this work is dedicated to drop breakage in turbulent flow,this willhowever not be further described here in more detail.
1.1.Turbulentparticle breakup
In the pioneer works of Kolmogorov[7]and Hinze[8]particle breakup due to turbulent velocity and corresponding pressure fluctuations is described based on Kolmogorov's theory of localisotropic turbulence from 1941[9,10].
It is widely accepted that breakage occurs when the externalforces and stresses exerted on particles by the continuous phase exceed the internalforces and stresses which hold the particle together.Thereby,turbulentvelocity fluctuationsoverthe distance of the particle diameter are suggested to be responsible for breakup[8,11].In general,larger turbulentstructures were found to be responsible only for the transportation of the particles,while smaller eddies,not containing enough energy for breakage,only deform particles[12].According to Hinze[8],the deforming stresses due to turbulent pressure fluctuations can be approximated byApplying Kolmogorov's theory of localisotropic turbulence[9,10]and assuming turbulent structures in the inertialsubrange to be responsible for the breakup lead to:

The deforming stressesτdefinduce a flow inside the particle which leads to a stabilizing viscous stress τη.The flow velocity can,thereby,be approximated byAdditionally,the particle is stabilized due to the interfacialtension.Hinze[8]described the stabilizing stresses as follows:


The resulting three stresses,which determine turbulent particle breakup are characterized by two dimensionless numbers.Hinze[8]chose one which he allocated to the group of the Weber numbers and one of the viscosity group,which is also commonly known as the Ohnesorge number:While the Ohnesorge number describes the stabilizing effect of the viscosity in comparison to the stabilizing effect of the interfacialtension,the Weber number describes the deforming stress due to a dynamic pressure in comparison to the stabilizing effect of the interfacialtension.The Weber number mustexceed a criticalvalue for fluid particle breakage to occur,which determines the maximumstable particle size.As the whole process can be described by these dimensionless numbers,the corresponding critical Weber number must depend on the Ohnesorge number[8]:

In the past a lot of results of differentmixing applications were not explainable only on basis of the described theory.Consequently,extensions and modifications of the concept can be found in literature.Some authors assumed velocity gradients in the mean flow to be mainly responsible for breakage and their neglecting not being valid.Depending on the process parameters,Kumar et al.[13,14]suggested that besides the turbulent fluctuations other breakage mechanisms occur in a stirred tank.In accordance to Wichterle[15]they expected the shear layer on the blade to be mainly responsible for drop breakage.Additionally,the elongation flow behind the stirrer was suggested to in fluence drop breakage,which was also found for example by[16,17].Ali et al.[18]and Chang et al.[19]described effects of the mean velocity depending on the Reynolds number and the dispersed phase properties.
When turbulent structures were supposed to be mainly responsible for the breakage process,some authors assumed eddies which are smaller than the droplets being responsible for breakage.This was for example concluded by Nambiar et al.[20]from their assumption of breakages into small droplets,whose surface energies correspond to the energy of smaller eddies.Additionally,different authors(for example[21,22])suggested particle oscillations to be mainly in fluenced by smaller eddies.Instead,the observation of macro-scale deformations led other authors[23]to the conclusion that much larger turbulent structures are responsible for fluid particle breakage.As Andersson and Andersson[3,24]observed drop oscillations,as well as macroscale deformations,they consequently stated that all kinds of eddy sizes can be involved in the breakage process.
Sprow[25]already postulated in 1967 that depending on the droplet size processes in the inertialor in the viscous subrange can become responsible for drop breakage.Therefore,the Kolmogorov length scale λ =(ν3/ε)1/4[9,10]which is a measure of the smallestoccurring eddies in the systems,is considered.Droplets much smaller than this scale are expected to be in fluenced by processes in the viscous subrange(see for example[26]),where viscous(for example.[26,27])or inertialforces(for example[28])are assumed to be responsible for breakage.
Risso[2]criticized the Weberconcept and stated that the breakup of particles in turbulent flow cannotbe described by a simple force balance between deforming and stabilizing effects.Instead he expected particle dynamics to mainly in fluence the behavior prior to breakage.Fluid particles undergo deformation and relaxation processes.They are determined by the stabilizing interfacialtension and dispersed phase viscosity,as well as deforming forces of one or more successive eddies.While some authors described fluid particles through a linear damped oscillator[2,21,22,29],Kumar et al.[30]considered drop oscillations in a stirred tank through a two-stage model.Droplets thereby change position between the stirrer vicinity where deformations and breakages occur and outside this area where relaxation processes dominate.Consequently,fluid particle breakup can result from more successive eddies through resonant effects.In order to describe macro-scale deformations prior to breakage Andersson and Andersson[3]defined two criteria which must be satisfied for the particle breakup to occur.Besides a simple stress criterion that must be fulfilled for the achievementof the criticalparticle deformation,an energy criterion wasformulated in order to describe the duration of the deformation process.
Ithas to be mentioned here that the deformation dynamics is atleast partly considered through the stabilizing effect of the dispersed phase viscosity which mainly in fluences the deformation time(for example[31]).Differentapproaches existfor the prediction ofmaximumstable drop diameters considering the dispersed phase viscosity within the framework of the critical Weber concept.Besides more or less simple summations of both stabilizing forces(for example[32–34]),the droplets were described by a Kelvin–Voigtmodel[35–37],which can also be regarded as an overdamped linear oscillator[38].
1.2.Experimentalinvestigations of single fluid particle breakup
Despite comprehensive experimentalresearch activities,a generally accepted and valid description of turbulent particle breakup and corresponding mathematicalmodels are stillmissing.Instead,different and sometimes even contradictory results were concluded from experimentalinvestigations.For example Sleicher[39]and Swarz and Kessler[40]investigated drop breakages in a turbulent pipe flow.Even though they used the same dispersed phase they came to inconsistent results.Sleicher[39]observed drop breakages mainly near the pipe wall,where gradients of the mean flow dominate.Instead,Swarz and Kessler[40]found breakage to occur in the turbulent core of the flow,which accordingly led to the description ofdifferent breakage mechanisms.
One reason might be the restricted transferability of the results from one set-up to another[2].Not only the flow properties,but also the experimentalconditions can differ significantly in two different set-ups.The widespread application of tap water,instead of deionized water(for example[21,22]),might be one problem here.Also,missing specifications of the experimental parameters,like the investigated initial particle size(forexample[41]),restrictthe comparability.Furthermore,breakage characteristics were defined in different ways.The critical Weber number and the corresponding maximum stable diameter are given as examples here.They were derived from the events where no breakages[42]occur,as well as where 20%of the droplets break[39].Especially a comparison of the breakage times is difficult,as notonly differentdefinitions exist,butalso in some literature references(forexample[41,43])their definitions are totally missing.Andersson and Andersson[3]used the inverse of the breakage rate,which they calculated from the breakage probability and the residence time of the drops.Instead,Hesketh etal.[21]considered the interval between the beginning deformation and the subsequentbreakage process.These authors furthermore regarded halfof the oscillation time for the description of the breakage time.The beginning deformation was thereby determined manually,which is according to the authors'opinion also a criticalpoint.
In order to gain a more detailed understanding of the breakage mechanisms,different breakage aspects were analyzed experimentally.However,in most literature references only some breakage characteristics were considered and especially the breakage dynamics was neglected in most works.Table 1 summarizes those investigations of single particles,which include a description of particle oscillations,breakage or deformation times and corresponding deformation states.The investigated parameters describing the breakage dynamics,as well as the varied process parameters,are listed.Finally,possible restrictions are annotated.
The comprehensive works of Galinat et al.[1,29,44]should be highlighted here,as in their works a detailed description of the whole breakage process was conducted.This means that not only the deformations and oscillations prior to breakage were considered,but also the breakage probability,the breakage location,as well as corresponding breakage mechanisms and resulting daughter drops were determined.However,they only investigated one dispersed phase.As in most of the works only few in fluencing parameters were varied,especially the role of the physical properties could not be described properly under the variation of the initial drop size and the energy input.For example Andersson and Andersson[24]analyzed an octanol droplet(γ =8.5 mN·m-1;ηd=6.5 mPa·s)in order to describe the in fluence of the dispersed phase viscosity in comparison to a low viscosity droplet(γ=53 mN·m-1;ηd=1.5 mPa·s).A proper analysis might be difficult,as not only the viscosity was increased,but also the inter facialtension was significantly lower in their investigated system,which also must be considered.
However,according to the authors'opinion one of the major drawbacks ofmost literature references is the smallamount of investigated breakage events.This does notallow a statistically valid analysis of the breakage process(see annotations Table 1).
The turbulent breakage channel used in this work,was already under investigation in previous works of Maaß etal.[4,45–48].However,only two low viscosity droplet phases and particular breakage parameters were analyzed.
Despite the comprehensive scientific research activities,different and sometimes contradictory principles describing drop breakage were described in literature.Expensive and time-consuming experiments are consequently stillneeded for the development of new processes and emulsified products[50].A deeper understanding of the drop breakage mechanism is still desired,which was also concluded forexample by Andersson and Andersson[24]in 2006.This work focuses on drop dynamics in turbulent flow,as it was not or only partly considered in the past.Most investigators describe the behavior of some droplets exemplarily in their work and observe significant deformations prior to breakage.Nevertheless,a systematic and detailed analysis including the objective determination of the deformation state is still missing.Especially the in fluence of the physical properties is thereby not described properly.

Table 1 Selected investigations of single fluid particles considering the deformation dynamics
2.Analysis of Single Drop Breakages in Turbulent Flow
2.1.Experimentalset-up and procedure
Experiments were carried out in a specialbreakage channel(see[4,45–48])which simpli fies the flow field in a stirred tank and simulates the region around the impeller.Maaßet al.[47]con firmed this simplification by experimental and numerical investigations,comparing the flow conditions in a stirred tank with those in the drop breakage cell.Fig.1 shows a simplified flow diagram of the set-up including a more detailed illustration of the drop breakage channel in the right part.Deionized water(1)was pumped with a rotary pump(2)through a magnetic inductive flow meter(3)to the breakage channel.In order to ensure a proper operational mode of the flowmeter,potassium chloride(KCl—Merck KGaA)was added in an amount of c=1.6 × 10⁻¹g·L-1.An in fluence of ions on the breakage process was not found[41,51],while the in fluence of ions on coalescence processes is wellknown[52,53].
The breakage channelitself(4)consisted of two parts.In the upper part the deformation and breakage of drops were analyzed,while in the lower part the generation of drops took place.In order to allow the opticalanalysis of both processes,the high-speed camera and lighting equipment could be mounted at both parts.
Drops were generated by a Hamilton®dosing pump PSD/3.Depending on the desired size and the physical properties,they were introduced by glass cannulas or metal needles and taken off by the continuous water flow(see Fig.2 as example).Three differententry positions were located in the lower part of the channe with varying cross sectionalareas.This corresponds to flow velocities of9%,17%or 46%of the velocity in the upper part,where drop breakage was investigated.
Prior to the drop breakage examination,the size distribution of at least200 droplets was analyzed to ensure the steady injection ofequally sized drops into the flow in a so-called mother drop analysis(see[47]).In accordance to the results of Maaßetal.[47]the mother drop diameters followed a narrow normaldistribution.For the Paraf fin oil/water system more than 94%of the droplets diameter lay within an interval of±5%around the arithmetic mean.For the other investigated systems more than 95%of the analyzed dropletdiameters lay within an interval of±10%around the arithmetic mean and the corresponding standard deviations were always smaller than 5%.In this work results of a constant mother droplet diameter of dp=1.0 mm are presented.
In the upperpart,a single blade of a Rushton turbine(dstirrer=0.08 m)was mounted in a rectangular glass channel(30×30×60 mm).For the opticalanalysis of single drops passing the stirrer blade,pictures were taken with a frame rate of822 frames per second.For the investigations an area of 30×60 mm perpendicular to the fluid flow was resolved with approximately 10 Pixels per mm(Px·mm-1).The breakage event was defined to occur as soon as more than one particle was visible in the investigated area,after a mother droplet crossed the stirrer blade.Fig.3 shows breaking of a 1 mm paraffin oildroplet as example.
In this work results of a constantcontinuous flow rate of3185 L·h-1are presented.This flow rate corresponds to a velocity of0.98 m·s-1in the upper part of breakage channel and 1.52 m·s-1at stirrer height,which is a typicalrelative velocity between the stirrer and the fluid flow in a stirred tank.The resulting Reynolds number(Re=udhyd/ν)was therefore 2.9×10⁴and the flow of the continuous water phase was consequently turbulent.Experiments were conducted atroom temperature.
At least 1600 droplets passing the area of interest were investigated for each parameter set(constant drop diameter,flow rate,and investigated system)of this work.Incorrect sequences which could not be analyzed automatically,for example due to air bubbles or other misleading particles,were neglected.For a detailed overview of investigated droplets,error-free sequences and the resulting number of available breakage events see Table 2.
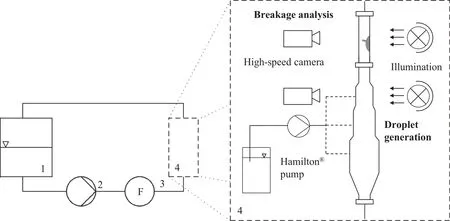
Fig.1.Simplified flow diagram of the experimentalset-up(leftpart):(1)storage tank,(2)pump,(3)flow meter,(4)breakage channel,and drop breakage channelin detail(right part).

Fig.2.Generation of a petroleum droplet(d p=1.0 mm)with a glass cannula(Δt=18 ms).

Fig.3.Sequence of a breaking 1 mm paraffin oildroplet crossing the investigated area.

Table 2 Number of investigated sequences and corresponding number ofvalid breakage events
In this work the results of two dispersed phases,namely petroleum(Merck KGaA)and paraffin oil(Fauth+Co.KG)are presented.Both phases were blended with a non-water soluble dye(Sudanblack,RAL Diagnostics,c=7.5×10⁻²g·L-1)in order to increase the opticalproperties of the image data.Maaßand Kraume[4]investigated the in fluence of that dye on the evolution of the drop size distributions in a standard stirred vessel(T=150 mm,H/T=1).They found out that the distributions with dye were always broader than the ones without.However,the maximum deviations of the Sauter mean diameters with and without dye were less than 10%.This was considered to be acceptable in comparison to the significantly improved opticalproperties,which made the droplets easily visible and allowed the fully automatic analysis of the image data.
For some experiments sodium dodecylsulfate(SDS—Merck KGaA)was added to the continuous phase in order to quantify the in fluence of the interfacialtension.The concentration of c=1 × 10⁻²mol·L-1was above the criticalmicelle concentration of8.2 × 10-3mol·L-1[54].SDS is an anionic hydrophilic surfactant(HLB=40[55])which belongs to the fast adsorbing surfactants[56,57].
Physical properties of the systems were measured with and without dye.While differences in densities and viscosities were always smaller than 1%,a significant in fluence of the dye on the transient evolution of the interfacialtension was found.As already stated in previous works of Maaßet al.(e.g.[4,47]),the steady state interfacialtension between the organic phase and water was decreased by the addition of the dye,which seemed to accumulate at the interface over a certain time.Physical properties of the investigated systems are summarized in Table 3.Densities of the two phases were thereby determined using an oscillating U-tube density meter(DMA 4500,Anton Paar).The viscosity of the paraffin oil was measured with a rotational viscometer(RheolabQC,Anton Paar GmbH),while for the low viscosity petroleuma capillary viscometer(iVisc,Lauda Dr.R.Wobser GmbH&Co)was used.Allmeasurements were conducted at 20°C.
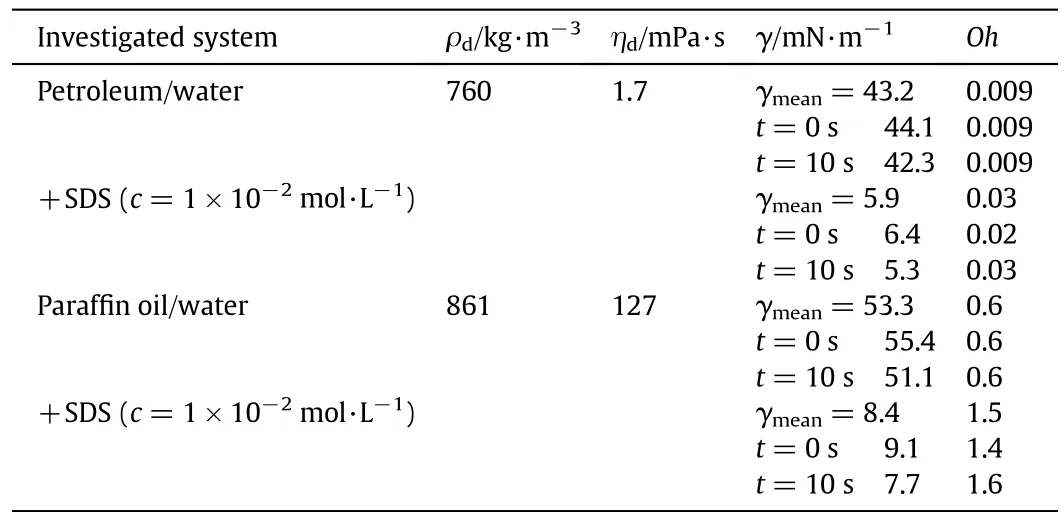
Table 3 Physical properties of the investigated systems
Inter facial tensions were determined with a Pendant Drop apparatus(OCA 20,DataPhysics)at room temperature.Measurements were conducted over a certain time untilsteady state was reached and no more dye accumulated at the interface.Assuming the droplets'rising velocity to be comparable to the flow velocity of the continuous phase and depending on the entry position,it took the droplets between 0.3 and 3.4 s to ascend.Table 3 depicts the measured values of the systems with dye after droplet generation(t=0 s)and after 10 s ofmeasuring time(t=10 s).After 10 s alldroplets musthave entered the area of interest.Therefore,the relevant value of the interfacialtension must be between the values measured for zero and 10 s.As characteristic value,the arithmetic mean valueγmeanwas used and is also given in Table 3.
In literature,differentcriticalvalues are given,for which the stabilizing effects due to the dispersed phase viscosity can be neglected and only the stabilizing effect of the interfacialtension has to be taken into account.For example Arai et al.[35]stated a critical value ofηd=10 mPa·s.This corresponds wellto the experimentalresults of Hall et al.[58],who determined a critical value ofηd=9.6 mPa·s.Chen and Middleman[59]could describe their experimental results without the consideration of the dispersed phase viscosities up to values of ηd=28.8 mPa·s.Thus,it can be assumed that for the petroleum/water system with a dispersed phase viscosity ofηd=1.7 mPa·s the stabilizing effect of the viscosity can be neglected,while for the viscous paraffin oil(ηd=127 mPa·s)their effect must be considered.
2.2.Automated image analysis with Matlab®
The images were fully automatically evaluated with Matlab®.In the first published works of Maaß et al.[45–47]ImagePro® was used for image analysis,which involved a lot of time-consuming manual steps and allowed only the analysis of few breakage parameters.
For the drop recognition,different image processing steps,which can be seen for three paraffin oil drops in Fig.4,were applied to the original image data.The first step comprised an image-subtraction to eliminate portions of the image that were identical to the background(i.e.the stirrer blade and disc,as well as the channel walls).The background image was defined for each sequence resulting from a comparison of the gray value distribution between two consecutive images.As the background images were defined to be images not showing any drops,a picture with small differences in the gray value distribution to the previous one was selected as background image.
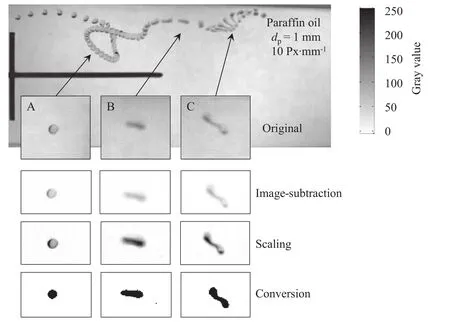
Fig.4.Image processing steps for the fully automatic analysis of single drop breakages with Matlab®.
In the resulting difference-image,the gray values did not have maximum spread anymore.To sharpen the boundaries of the drops and make the recognition easier,the gray values were multiplied by a scaling factor,calculated from the maximum gray value found after subtraction(factor=255/gray valuemax)for each sequence.Therefore,all the gray values were expanded into a 255 value range again.
Finally,the images were subjected to a conversion process.This conversion allocated the value 0(black)to each pixelabove the threshold(TS)and the value 1(white)to allothers.Therefore,allobjects in the image could be labeled and collected for their properties(pixelarea,position ofcenter ofgravity,dimension).The threshold mainly in fluenced the size and the geometry of the recognized droplet,which is depicted in Fig.5 for the paraffin oildroplet C ofFig.4.With increasing threshold the area of the recognized particle was decreased.A threshold of122.5,which is halfof the maximum gray value,even led to the identification of two separated fragments.Concluding from a lot ofmanualinspections the threshold was set to be 30 leading to the best results.
Air bubbles and random noise could lead to the unwanted misleading recognition of particles with this procedure.Therefore,alllabeled objects smaller than a certain area were erased from the black and white images.For the standard set-up with a resolution of10 Px/mm,fragments with an area of 8 Px were erased.This corresponds to an equivalent diameter of dequ=319μm and 3.3%of the volume of a 1 mm droplet.Depending on the experimental parameters and due to multiple breakages,smaller particles could result from the fragmentation process.Consequently,after the first breakage event only particles with an area smaller than 4 Px were erased(dequ=226μm which corresponds to 1.1%of the volume of a 1 mm droplet).
The laststep was the analysis of the image data with regard to incorrect sequences.As incorrect sequences would have requested timeconsuming manual evaluation of the image data,these sequences were not considered for the further analysis.
For the detection of incorrect sequences and further analysis of the breakage events as well,the positions of the stirrer blade and disc were determined for each sequence.This was done by a simple black–white conversion of the background image and analysis of black–white value distribution.The beginning of a sequence was set to be the pointwhen a mother dropletcrosses the stirrer blade.Following aspects were regarded concerning the occurrence of incorrect sequences.
2.2.1.Particle size
The volume of allinvestigated drops was checked again when entering the investigated area.Sequences including droplets with a volume deviation greater than 25%were neglected.
2.2.2.Breakage in front of the stirrer disc
As image processing steps could be incorrect when parts of a breaking drop are in front of the disc,sequences where breakage processes occurred in that region were rejected.
2.2.3.Erroneous particles
Particles entering the investigated area besides the main mother droplet also led to the rejection of a sequence.For example drop breakages during rising up would have caused this kind ofmistake.In order to identify erroneous particles entering the area of interest before the investigated drop breaks,a breakage area was defined.As particle fragments resulting from breakage were assumed to show spatialvicinity,they had to be located in a certain region around the largest daughter drop.Particles further away from the largest particle and droplets crossing the stirrer blade after breakup were defined to be misleading particles.

Fig.5.In fluence of the threshold(TS)on the conversion process and droplet recognition,respectively.
2.2.4.Incomplete sequences
Sequences,where particles were detected for the first time 2.5 mm or further behind the stirrer blade were assumed to be incomplete and therefore rejected.
Correct sequences were evaluated automatically and the drops'behavior was investigated in detail.In this work the deformation of drops crossing the investigated area is analyzed,which allows the description of the breakage dynamics.
3.Results
3.1.Description of single drops'behavior in turbulent flow
Three sequences of the viscous paraffin oildroplets(ηd=127 mPa·s)crossing the investigated area are depicted in Fig.6.It becomes evident that the drops'behavior differed significantly although all process parameters remained constant.However,all the drops showed a macroscopic deformation while crossing the turbulent vicinity of the stirrer blade.
Droplet A breaks binary in two unequally sized droplets out of a dumbbell-shaped geometry.The droplet thereby gets more and more elongated and builds spherical ends which are connected through a thin filament.The breakage-induced building of one or more satellites out of the thread[32,60,61]was also observed sporadically but in most cases they were(maybe also due to the resolution of10 Px/mm)notvisible.This behavior corresponds to results ofliterature studies,different authors described dumbbell-shaped particles especially to occur with increasing viscosity[23,32,62].The sphericalparticle ends were explained by capillary effects[23].
Droplet B shows an even more deformed geometry prior to breakage.This irregular macroscopic deformation results in the fragmentation into several daughter particles.In literature[24]this drop behavior was also described as some kind of winding around turbulent eddies.It was also observed with increasing dropletviscosity[23,24,32],stability due to an increased interfacialtension[61],but also in flow regions,where gradients of the mean flow mainly deform the particle[39,44]and under turbulent conditions with low intensity[18,19,44].Although droplet C also shows a significant deformation comparable to droplet A it doesn't finally break up,which was also observed in literature studies[24,39].
The interfacialtension mainly in fluenced the drops'deformation.The addition of SDS led to even greater macroscopic deformations of the particles.Due to the lower interfacial tension and accordingly droplet stability,even longer and thinner filaments were built prior to breakage.The described building of sphericalends was considerably less pronounced or even not observed at all.Fragmentation usually led to a high amount ofdaughter drops(see Fig.7 as example).
The same in fluence of the interfacialtension was found for the low viscosity petroleum droplets(ηd=1.7 mPa·s),which is depicted in Fig.8.As interfacial tension decreased,deformations were more pronounced and,accordingly,thinner filaments were built.The fragmentation process of the less stable petroleum/water system with added SDS could be speci fied as some kind ofbursting,which was also described in literature to occur with decreasing droplet stability[61]and viscosity[18,19,32]or increasing energy input[18,19,61].Petroleumdroplets withoutadded SDS showed less pronounced macroscopic deformations resulting in fewer daughter drops.
The inter facial tension mainly in fluenced the breakage behavior of both systems.Sphericalends and,accordingly,dumbbell-shaped particles were only significantly built for the higher viscosity paraffin oil droplets.The turbulence-induced bulgy type deformations,which have been described by Hinze[8]were not observed in this work.Irregularities of the particles'surface were always superimposed by macroscopic deformations of the whole particle or led to a bursting of the deformed droplet.Irregular protuberances on the surface of bubbles[22,41]and drops[21]were also observed in literature studies.However,breakage in most cases results from significant macro-scale deformed particles,which again corresponds to the results of this work.
A reliable evaluation of the deformation state is notpossible manually.As all the systems behave differently,a valid description of the deformation state is only possible with the help of an objective analysis based on a multitude ofsequences.
3.2.Determination of the deformation dynamics
According to Clift etal.[63]the characterization of irregular particles is possible by their volume or surface.In the case of two-dimensional analysis,accordingly,the projected area and perimeter can be applied.Besides,one or both main axes of the particles were used for the description of the deformation state.This was mostly done for investigations of more regular particles in laminar flow[2,5,6],but was also used for turbulent applications(for example in[24,39]).
In this work,the drops'deformation was determined with the help of the function regionprops in Matlab®,which provides different parameters describing the particle properties.The development of the projected area over time(like in[22,29]),was not suitable in this work.As described above(see Section 3.1),especially under the addition of SDS,highly deformed particles occurred.Parts of thin filaments thereby left the projection plane.This led to a decreased projected area,while the deformation itself was increased.According to the authors'opinion a more suitable description of the deformation state is gained by analyzing the shape of the particles.
Possible deformation parameters are depicted in Fig.9 forone exemplary particle.Besides the bounding box,which is the smallest rectangle that contains the region(in x-and y-direction),the perimeter of the object was considered.In Matlab®,the perimeter is defined to be the pixel length around the boundary of the particle region.It was computed by calculating the distance between each adjoining pair of pixels around the border.Finally,the major and minor axis lengths of an ellipse with the same normalized second central moments as the region of the corresponding particle were regarded.For sensitivity analysis,ideal shaped model particles with different deformation states were analyzed.According to the observed deformation states of drops(see Section 3.1),elongated,dumbbell-shaped and highly deformed irregular particles were evaluated,which are depicted in Fig.10.
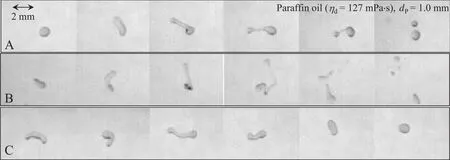
Fig.6.Images of1 mm paraffin oildroplets(ηd=127 mPa·s)crossing the investigated area,(A)binary breakage after a significant dumbbell-shaped deformation,(B)multiple breakage resulting from a macroscopic irregular deformation,(C)droplet crosses the investigated area without breaking.

Fig.7.Deformation and breakage of a 1 mm paraffin oildroplet,SDS is added to the continuous phase and accordingly the inter facial tension is decreased.

Fig.8.Petroleum droplets(d p=1.0 mm)crossing the investigated turbulence field with(lower part)and without(upper part)the addition of SDS to the continuous phase.

Fig.9.Evaluated parameters for the characterization of the drops'deformation state:bounding box,perimeter and ellipse with the same second moments as the particle and their main axes.
The bounding box can differ for one and the same particle,as it mainly depends on the particles'orientation(see Fig.9).Therefore,according to the authors'opinion,it is not applicable for the characterization of the deformation state and it was not further evaluated in detail.
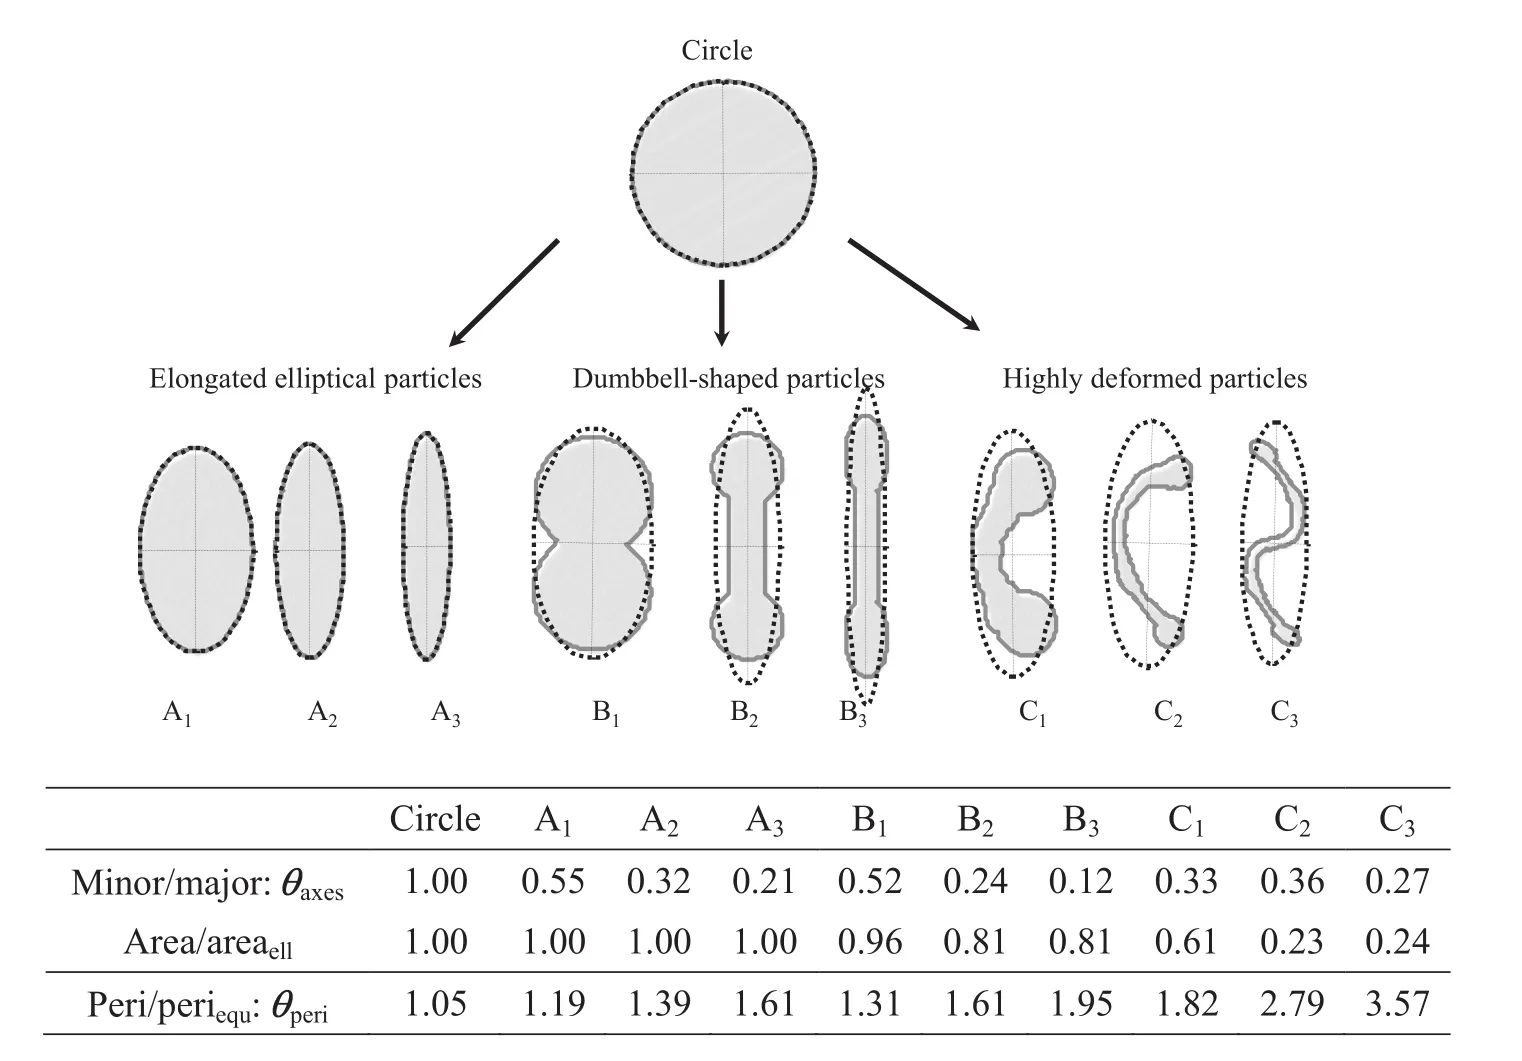
Fig.10.Modelparticles that were used for sensitivity analysis of different deformation values;the perimeters of the particles are depicted in dark gray,the ellipses as well as their main axes are depicted as black dotted lines.
Clift et al.[63]assumed that the shape of a lot of deformed fluid particles corresponds to an ellipse,and also Hinze[8]described this deformation state in his work.Regarding Fig.10,it becomes evident that the description of an elongated particle(see particles A1–A3)by an ellipse with the same normalized second moments was valid.The same was concluded for little deformations which typically occur at the beginning of the deformation process.For slightly dumbbell-shaped particles(see particle B1in Fig.10)the area of the particle still corres ponds to 95%of the area of the ellipse.Instead,highly deformed irregular particles(compare for example particles C2and C3)could not be approximated adequately by such an ellipse.The area of these particles corresponds to less than 25%of the area of their associated ellipse.
Therefore,in this work,the approximation of the particles through an ellipse with the same normalized second moments was used for the analysis of smallde formations and deviations from the sphericalshape,respectively.In order to quantify this kind of deformation,the relation between the minor and major axes of this ellipse(θaxes=minor/major)was applied.
Regarding the resulting values for deformationθaxesagain,it becomes evident that this approach was not applicable to all de formation grades.The highly deformed particles(C1–C3)showed higher deformation values than the dumbbell-shaped particle B2.Therefore,this particle(B2)would have been determined to be more deformed than all the tested highly deformed particles C1–C3,which,according to the authors'opinion,doesn't depictthe righttendency.The same was concluded for parameters,which are based on the ellipses'parameterslike the relation between the major axis length and the initialor equivalent diameter,which would describe some kind of linear expansion and was also used in literature studies[24,39].
Consequently,another parameter must be used to describe highly deformed particles.In this work,the relation between the perimeter and the perimeter of a corresponding area equivalent circle(θperi=peri/periequ)was used.This parameter was not sensitive to small deviations from the spherical shape,which becomes evident regarding again the particles in Fig.10 and the corresponding deformation values.Comparing the circular particle to particle A1,which shows a significant elongation,this parameter only increases 13%,while the ratio of both main axesθaxesincreases 45%.Therefore,it was concluded that for a detailed analysis of drop deformations and dynamics,two parameters need to be considered,which was done in this work.
3.3.Drop deformation dynamics
3.3.1.Breakage times
Due to their restricted possibility in describing drop characteristics,in previous works Maaßand Kraume[4]defined the breakage time to be the interval between the time when the drop passes the stirrer blade and the time when breakage occurs.Breakage time was determined by dividing the number of frames between the two events by the frame rate.This calculation was done in this work as well,butin accordance with literature(for example[21,49])a more physical definition of the breakage time was used.It was defined as the time it took an initially sphericaldrop to be deformed and finally break.As described above,small deviations from the circular geometry were detected with the help of the relation between the minor and major axesθaxesof a corresponding ellipse with the same normalized second moments.The in fluences of the criticalvalueθcrit,axes,de fining drops to be spherical(θaxes> θcrit,axes)or deformed(θaxes< θcrit,axes),are shown in Fig.11 for a 1 mm paraffin oildroplet.Itbecomes evident that droplets undergo different kinds of deformation grades before finally breaking.Allthe tested critical values were sometimes exceeded,which would mean that the droplets are more or less spherical.Also values below the criticalone were observed,which corresponds to deformed droplets.The smaller the criticalvalue was defined,the more drops were recognized as spherical.
As the drops'shapes changed between the spherical and the deformed,drop oscillations prior to breakage played a major role.In order to describe the drops'behavior properly,two characteristic times were considered:
(1)The oscillation time toscillwas defined to be the time interval between the occurrence of the first deformed droplet(θaxes<θcrit,axes)aftercrossing the stirrerblade and drop breakage.
(2)The deformation time tdefwas defined to be the time a spherical droplet needs to deform and finally break up.It was described through the interval between the occurrence of the lastspherical drop(θaxes> θcrit,axes)prior to breakage and breakage itself(see Fig.11).
A criticalvalue ofθaxes=1 was never exceeded.Therefore,alldrops were considered to be deformed while crossing the investigated area.In that case,the deformation time corresponds to the oscillation time and the definition of the breakage time of Maaßand Kraume[4].
According to Cliftetal.[63]droplets were assumed to be spherical,if the ratio between both main particle axes deviated less than 10%from unity,which would mean θaxes> 0.9.As for a lot of different kinds of drops,the reliability of this criticalvalue was furthermore proved manually,it was used for the analysis of the breakage times in this work.Fig.12 shows the resulting distributions of the measured oscillation as well as deformation times of the investigated 1 mm paraffin oildroplet.Both distributions show the same tendency.Most of the measured times were below 25 ms.Only few droplets showed deformation times higher than 50 ms,but many drops showed very high oscillation times,some drops even oscillated up to 299.3 ms.Droplets with bigger deformation and oscillation times caused a significant increase in the corresponding arithmetic mean times(see Fig.12).This results in very high standard deviations,which would correspond to 130%of the mean oscillation and 79%of the mean deformation times.Consequently,the arithmetic mean value did not represent the wide spreading data properly and cannot be used as characteristic time scale.A similar behavior was observed by Maaßand Kraume[4]for the time between crossing the stirrer blade and drop breakage,which was especially pronounced for their investigated small and,therefore,more stable low viscosity droplets.As they could describe all their breakage time distributions reasonably through a beta-distribution,they used the maximum value thereof as characteristic breakage time.This maximum value corresponds more or less to the modalvalue of the distribution and neglects droplets with higher breakage times.However,not all the measured oscillation and deformation times of this work followed such a distribution,as they differed significantly depending on the physical properties of the investigated system.For example,the oscillation time distribution of the stable paraffin oil droplets could not be described successfully by a beta-distribution applying the generally used maximum likelihood method.Further distributions,like for example the lognormal,generalized extreme value and gamma distribution were evaluated,but none was found which could describe all the measured oscillation and breakage time distributions properly.Regarding the oscillation times of the paraffin oildro pletde picted in Fig.12,itbecomes evident that the description of the widespread data through some kind of modal value would also be a critical point;only 26%of the droplets were smaller than or correspond to the modalvalue of the distribution.
Therefore,according to the authors'opinion,the use of a Box–Whisker-Plot is the bestway to describe the widespread experimental data without assuming an underlying distribution.Fig.13 shows the Box–Whisker-Plots of the oscillation times.Each box represents the time range,which includes 50%of the experimental data.The band inside the box represents the median value,and the bottom and top of the box describe the first and third quartiles.This corresponds to the time values below which 25%(first quartile)and 75%(third quartile)of the measured data lie.The whiskers describe the maximum and minimum measured values,the mean value is marked with an asterisk.The in fluence of the droplet stability on drop oscillation times is depicted in Fig.13.Drop oscillations prior to breakage played a major role for the more stable systems.They were especially pronounced notonly for the viscous paraffin oildroplets,butalso for the low viscosity petroleum droplets when no SDS was added to the continuous phase.
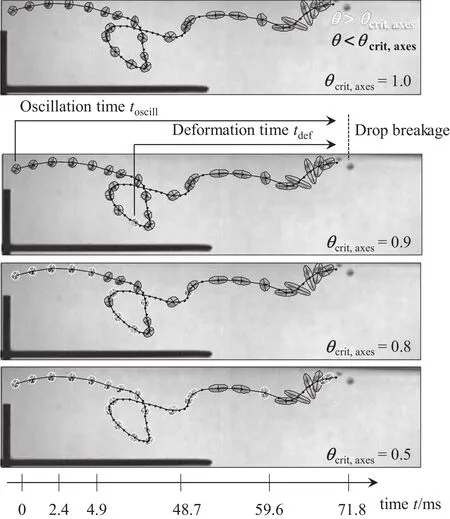
Fig.11.In fluence of the criticalde formation factorθcrit,axes on the recognition ofdeformed(θaxes< θcrit,axes,depicted in black)and spherical(θaxes> θcrit,axes,depicted in white)paraffin oil droplets(d p=1.0 mm,not alldroplets of the sequence are shown).

Fig.12.Distribution ofoscillation times(black circles and corresponding black dotted line)and deformation times(gray rectangles and corresponding gray dotted line)of364 breaking paraffin oil100 droplets.
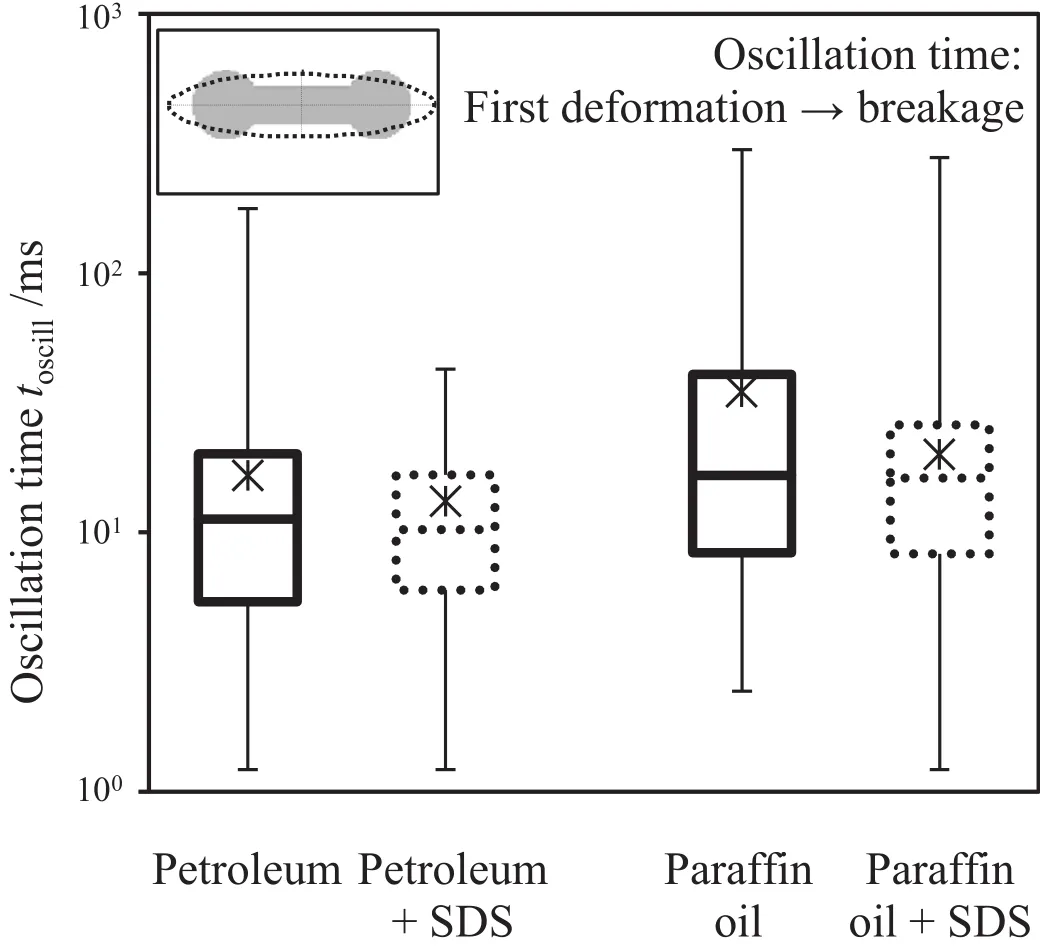
Fig.13.Box–Whisker-Plotof the experimentally determined oscillation times t oscill;the arithmetic mean value is marked with an asterisk.
When turbulent structures are assumed to be responsible for drop breakage,eddies containing less energy only deform the more stable droplets,ratherthan breaking them.One high-energy eddy might be responsible for the final breakup or more low-energy eddies in succession can lead to breakage(see Section 1.1).For less stable droplets,the probability to meet one eddy with enough energy,or the right combination of eddies breaking them up is higher than for very stable droplets.Therefore,less stable droplets rather break instead of starting to oscillate,when they are subjected to the same deforming turbulent stress field.
A decreased inter facialtension,resulting from the addition of SDS,led for both droplet phases to a narrower distribution of the oscillation time.This goes along with corresponding smaller maximum observed values and narrower time ranges,containing 50%of the measured data,while the location of the box remained constant.As stated above,the mean value was mainly in fluenced by drops with higher oscillation times.Systems with SDS therefore showed a smaller mean value,while the median remained nearly constant.Generally,the viscous paraffin oil droplets showed longer oscillation times than the low viscosity petroleum droplets.
The droplets'deformation times(see Fig.14)were not only smaller than their corresponding oscillation times,but the resulting distributions were also narrower.The height of the boxes containing 50%of the experimental data remained nearly constant for all the investigated systems.A decreased inter facial tension again led to smaller observed maximum values for both droplet phases.In contrast,the median and the arithmetic mean value thereby increased.The increasing deformation times might be explained due to capillary effects,which are less pronounced for systems with low inter facial tension.Capillary effects promote the spherical shape of particles.Consequently,they can for example promote the separation of spherical ends of a dumbbell-shaped particle and,therefore,the fragmentation process(e.g.[37]).Furthermore,the deformation time increased with increasing dispersed phase viscosity,as the dispersed phase viscosity counteracts the deformation process.Therefore,the deformation time could be scaled with the Ohnesorge numberor the capillary time ηddp/γ,which was also found by Eastwood etal.[23].They investigated fourdispersed phases with viscosities up to ηd=50.9 mPa·s in a turbulent water jet.
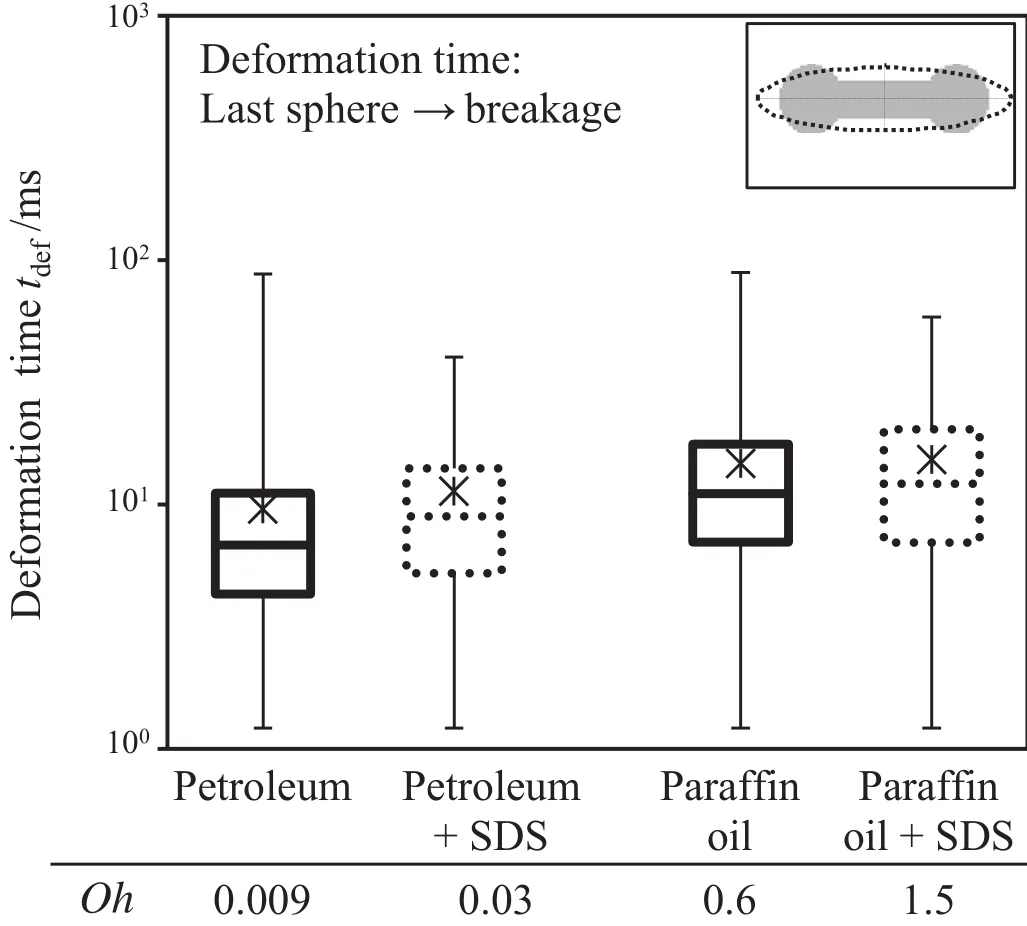
Fig.14.Box–Whisker-Plot of the experimentally determined deformation times t def;the arithmetic mean value is marked with an asterisk.
3.3.2.Drop deformations
As the arithmetic mean gave a good description of the experimental deformation valuesθperiprior to breakage(see Fig.15),it was used for the comparison of the macroscopic deformation behavior of the investigated systems.

Fig.15.Distribution of the deformation valuesθperi of the 1 mm petroleum droplets prior to breakage.
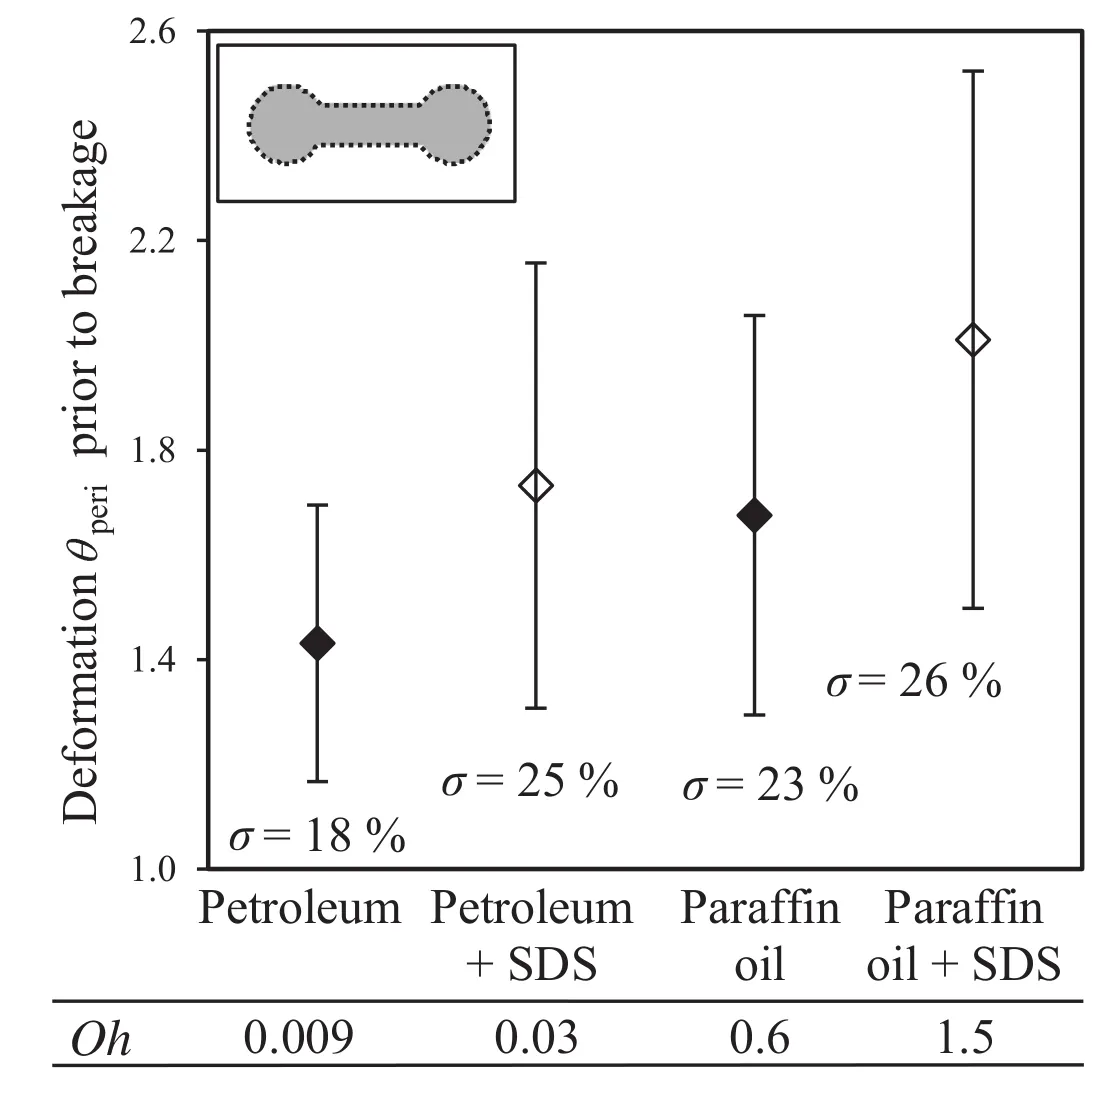
Fig.16.Mean deformation valuesθperi and corresponding standard deviations prior to breakage.
The mean values and corresponding standard deviations are depicted in Fig.16.Furthermore,the percentalvalues of the standard deviations are given.Allthe investigated systems showed significantly different deformation values prior to breakage.Consequently,their deformation behavior was mainly in fluenced by the physical properties of the drops.The addition of SDS and corresponding decrease of the inter facial tension led to higher deformation states for both systems.This has been expected as their stability was lowered.Therefore,these droplets might be stronger deformed when they are subjected to the same turbulent forces.This behavior also corresponds to higher deformation times.However,the in fluence ofSDSon the distribution of the deformation values was contradictory to the in fluence on the deformation time distribution.The standard deviation of the deformation values increased,while the deformation time distribution gotnarrower.A variety of different deformation states could therefore be reached prior to breakage in more or less the same time scale.
Generally,the standard deviations increased with increasing mean deformation value.Consequently,the higher the deformation values prior to breakage,the greater was the variety of the particle shapes prior to fragmentation.Thus,the assumption of a criticalmacroscopic deformation value like a critical area[29]that must be present for droplets to break seems rather unrealistic.However,the assumption of a critical filament thickness which must be reached for breakage to occur(forexample Maaßand Kraume[4]assume a critical thread thickness)cannot be excluded.This approach instead would explain the variety of deformation states thatcould lead to breakage.Highly deformed particles might build some regions with very thin filaments,although other parts of the particle are more or less deformed.
With or without SDS,the higher viscosity paraffin oil droplets showed greater deformation values than the corresponding petroleum droplets.Therefore,an increased viscosity led to stronger deformed droplets,which was commonly found in literature studies[23,24,32,60]and also corresponds to higher deformation times.However,the low viscosity petroleum dropletshowed greater deformations when SDS has been added than the paraffin oildroplet without SDS.The in fluence of SDS seems to be more significant than the in fluence of the dispersed phase viscosity,which is almost a factor of100 higher.Although the viscosity mainly in fluences the deformation behavior,it clearly becomes evident that the neglecting of the inter facial tension(like in[24])is not valid for the description of the deformation behavior.
Some authors described[32,61]a transition from bursting to a significant elongation with increasing breakage resistance.The results of this study show that such bursting can also result from a highly deformed state,as bursting is observed for the petroleum droplets when SDS isadded.The comparison of the deformation values to the deformation times showed that the deformation velocity of the paraffin oil might be lower than that of the petroleum droplet.The SDS containing petroleum/water system showed greater deformation values butsmaller deformation times than the paraffin oil/water system without SDS.This was expected when considering the internal viscosity induced flow,which counteracts the deformation.
Non-breaking drops showed a significantly lower maximum deformation value,while crossing the turbulence field in comparison to breaking drops,which is depicted in Fig.17.Generally,they showed the same deformation behavioras breaking drops,which was described above.In some cases the same maximum deformation value led to a breakup of drops while other drops did not break,which was already observed when describing the drop breakage behavior in Section 3.1.For such cases it must be concluded,that the time resolution of 822 frames per second was too low for a more detailed analysis of the drops'behavior.It is expected that in the case of a breaking droplet,further deformations occur prior to breakup.This would also explain the bigger overlaps between breaking and non-breaking drops in the case of the low viscosity petroleum which showed higher deformation velocities.Another restriction was given by the resolution of 10 Px·mm-1.Irregularities on the surface of a drop were probably notresolved and thus were notconsidered for the description of the deformation state.Eddies which deform only small parts of the surface without deforming the whole particle would be one explanation.According to Tcholakova etal.[60]“biting of smallportions”of the mother drop by small turbul enteddies is mainly relevantfor less viscous droplets.This corresponds again to the higher overlaps of breaking and nonbreaking petroleum drops.
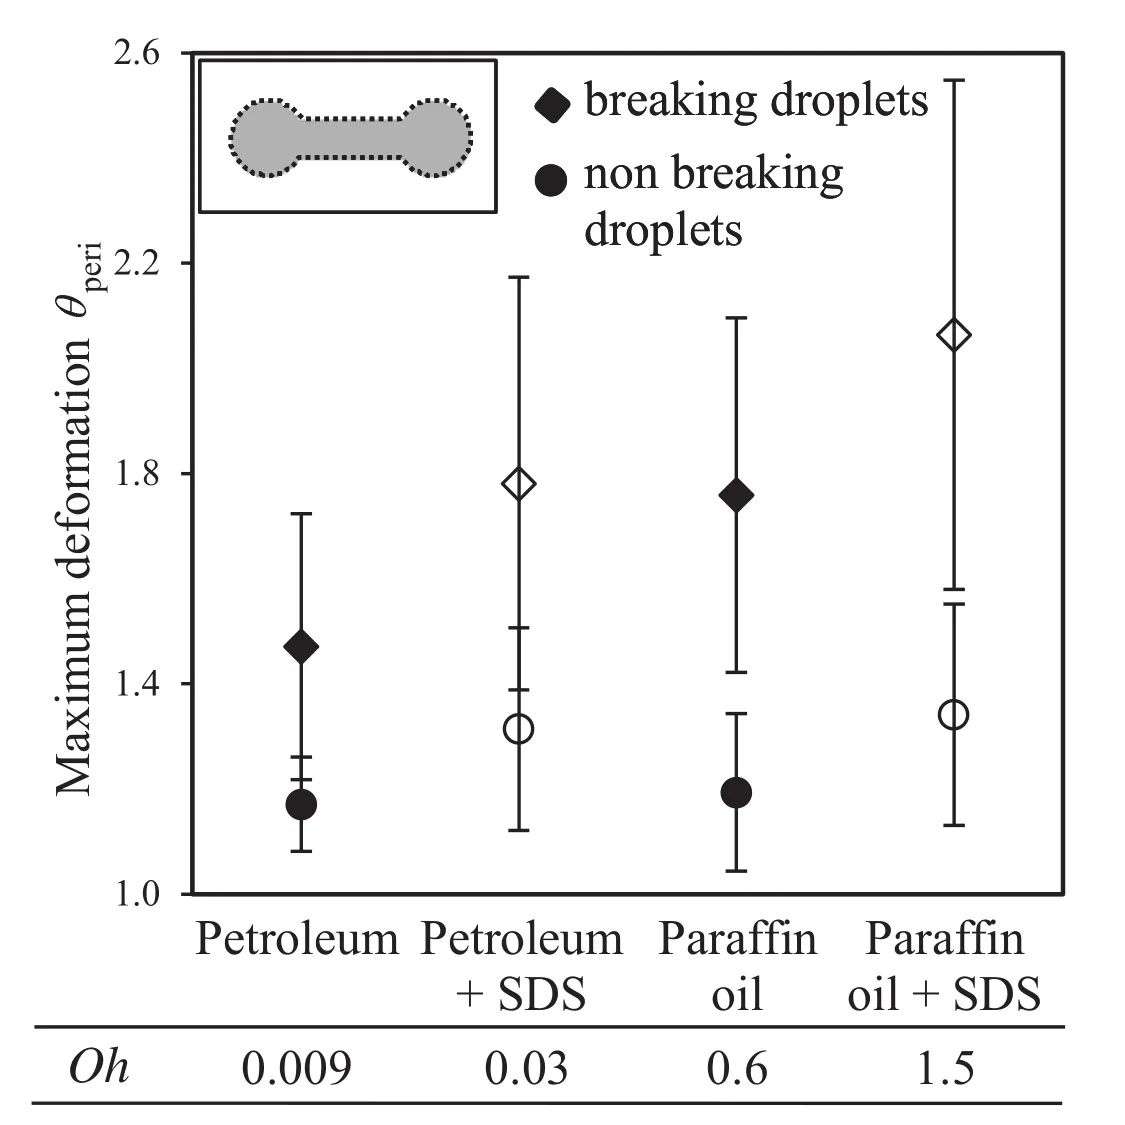
Fig.17.Maximum deformation of breaking and non-breaking droplets,the arithmetic mean values and the standard deviations are depicted.
4.Conclusions
In this work,turbulent drop breakage which is part of many dispersion processes was analyzed.In order to reduce the in fluencing factors of the whole process,single drops were investigated where coalescence processes can be neglected.Drops passing the turbulent vicinity of a single stirrer blade were examined by high-speed imaging.In order to gain a statistically relevant amount of drops passing the area of interest and corresponding breakage events,atleast1600 droplets were investigated for each parameter set.A specially developed fully automatic image analysis based on Matlab®allowed the objective description of the drops'behavior.This work focused on the dynamics of the deformation.Although this was found not to be negligible(for example[2,3])and especially the breakage time stillis discussed controversially[4],only few literature references describe the dynamics in more detail.
Smalldeviations from the circular geometry were detected with the help of the relation between the minor and major axes(θaxes=minor/major)of a corresponding ellipse with the same normalized second moments.According to Clift et al.[63],droplets were assumed to be spherical,if the ratio of both main axes of the particle deviated less than 10%from unity(θaxes> 0.9).As droplets were subjected to a variety of deformation and relaxation processes while crossing the investigated area,two characteristic time scales were analyzed.The oscillation time toscillwas defined to be the interval bet ween the firstde formed droplet and the breakage process,while the deformation time tdefwas defined to be the intervalbet ween the last sphericaldroplet and the consecutive drop breakage.The highly deformed particle state was described through the relation between the perimeter of the particle and the perimeter of an area equivalent circle(θperi=peri/periequ).
Observations of some exemplary drops correspond to literature descriptions.However,the detailed automatic analysis of different deformation parameters allowed a deeper insight into the complex process of droplet dynamics.Results of four systems show wide spreading of the experimental data especially for the oscillation times.A decreased interfacial tension led to narrower oscillation time distributions for low viscosity as well as higher viscosity droplets while the mean value remained constant.Higher viscosity droplets generally showed longer oscillation times.
The deformation times could be scaled with the Ohnesorge number or the capillary time,which set the dispersed phase viscosity into relation to the inter facial tension.A comparison of the measured breakage times to literature values is difficult,as in mostliterature studies no differentiation between the oscillation and deformation time is conducted or a definition of the breakage time is totally missing.
Drop macro-scale deformations were also in fluenced by the physical properties of the droplet.Not only the droplet viscosity,butalso the inter facial tension mainly in fluenced the deformation state priorto breakage.For each investigated system,droplets with higher deformation states were more likely to break than less deformed droplets.
Especially with increasing deformation values,a variety of drop geometries can lead to the fragmentation process for each investigated system.Therefore,it is assumed that thin filaments of the particle are responsible for particle breakup.A criticalde formation state of the whole particle which must be reached for droplets to break seems rather unrealistic.
Nomenclature

Subscripts

Acknowledgments
The authors gratefully acknowledge the student workers Nando Preugschat,Oliver Wätzig and the DAAD student Andrew Milne for their greatsupportin the experimental works,as well as Melanie Zillmer for the automation of the image analysis.
This work was financially supported by the German Research Foundation(DFG)within the project“Modelling,Simulation,and Control of Drop Size Distributions in Stirred Liquid/liquid Systems— KR1639/15-1”,and by the “Max-Buchner-Forschungsstiftung”.
[1]S.Galinat,L.Garrido Torres,O.Masbernat,P.Guiraud,F.Risso,C.Dalmazzone,C.Noik,Breakup of a drop in a liquid–liquid pipe flow through an orifice,AICHE J.53(1)(2007)56–68.
[2]F.Risso,The mechanisms ofdeformation and breakup of drops and bubbles,Multiph.Sci.Technol.12(1)(2000)1–50.
[3]R.Andersson,B.Andersson,Modeling the breakup of fluid particles in turbulent flows,AICHE J.52(6)(2006)2031–2038.
[4]S.Maaß,M.Kraume,Determination of breakage rates using single drop experiments,Chem.Eng.Sci.70(2012)146–164.
[5]H.A.Stone,Dynamics of drop deformation and breakup in viscous fluids,Annu.Rev.Fluid Mech.26(1994)65–102.
[6]B.J.Briscoe,C.J.Lawrence,W.G.P.Mietus,A review of immiscible fluid mixing,Adv.Colloid Interf.Sci.81(1)(1999)1–17.
[7]A.N.Kolmogorov,Über die Zerstäubung von Tropfen in einer turbulenten Strömung,Statistische Theorie der Turbulenz,Akademie Verlag,Berlin,1958.
[8]J.O.Hinze,Fundamentals of the hydrodynamic mechanism ofsplitting in dispersion processes,AIChE J.1(3)(1955)289–295.
[9]A.N.Kolmogorov,Die lokale Struktur der Turbulenz in einer inkompressiblen zähen Flüssigkeit beisehr hohen Reynoldschen Zahlen,Statistische Theorie der Turbulenz,Akademie Verlag,Berlin,1958.
[10]A.N.Kolmogorov,Die Energiedissipation für lokalisotrope Turbulenz,Statistische Theorie der Turbulenz,Akademie Verlag,Berlin,1958.
[11]G.W.Zhou,S.M.Kresta,Correlation ofmean drop size and minimum drop size with the turbulence energy dissipation and the flow in an agitated tank,Chem.Eng.Sci.53(11)(1998)2063–2079.
[12]E.L.Paul,V.Atiemo-Obeng,S.M.Kresta,Handbook of Industrial Mixing:Science and Practice,Wiley,2004.
[13]S.Kumar,V.Ganvir,C.Satyanand,R.Kumar,K.S.Gandhi,Alternative mechanisms of drop breakup in stirred vessels,Chem.Eng.Sci.53(18)(1998)3269–3280.
[14]S.Kumar,R.Kumar,K.S.Gandhi,Alternative mechanisms of drop breakage in stirred vessels,Chem.Eng.Sci.46(10)(1991)2483–2489.
[15]K.Wichterle,Drop breakup by impellers,Chem.Eng.Sci.50(22)(1995)6.
[16]G.Langer,A.Deppe,On the hydrodynamic stress of particles in turbulent impeller flows,Chem.Ing.Tech.72(1-2)(2000)31–41.
[17]M.Wille,G.Langer,U.Werner,PDAmeasurement of drop-size distribution on fluid/fluid dispersion in an agitated vessel,Chem.Ing.Tech.72(8)(2000)858–862.
[18]A.M.Ali,H.H.S.Yuan,D.S.Dickey,G.B.Tatterson,Liquid dispersion mechanisms in agitated tanks:part I.Pitched blade turbine,Chem.Eng.Commun.10(4-5)(1981)205–213.
[19]T.P.K.Chang,Y.H.E.Sheu,G.B.Tatterson,D.S.Dickey,Liquid dispersion mechanisms in agitated tanks:part II.Straight blade and disc style turbines,Chem.Eng.Commun.10(4-5)(1981)215–222.
[20]D.K.R.Nambiar,R.Kumar,T.R.Das,K.S.Gandhi,Anew model for the breakage frequency of drops in turbulent stirred dispersions,Chem.Eng.Sci.47(12)(1992)2989–3002.
[21]R.P.Hesketh,A.W.Etchells,T.W.F.Russell,Experimental-observations of bubble breakage in turbulent-flow,Ind.Eng.Chem.Res.30(5)(1991)835–841.
[22]F.Risso,J.Fabre,Oscillations and breakup of a bubble immersed in a turbulent field,J.Fluid Mech.372(1998)323–355.
[23]C.D.Eastwood,L.Armi,J.C.Lasheras,The breakup of immiscible fluids in turbulent flow,J.Fluid Mech.502(2004)309–333.
[24]R.Andersson,B.Andersson,On the breakup of fluid particles in turbulent flows,AICHE J.52(6)(2006)2020–2030.
[25]F.B.Sprow,Distribution of drop sizes produced in turbulentliquid–liquid dispersion,Chem.Eng.Sci.22(3)(1967)435–442.
[26]S.Tcholakova,I.Lesov,K.Golemanov,N.D.Denkov,S.Judat,R.Engel,T.Danner,Efficient emulsi fication of viscous oils at high drop volume fraction,Langmuir 27(24)(2011)14783–14796.
[27]R.Shinnar,On the behaviour of liquid dispersions in mixing vessels,J.Fluid Mech.10(2)(1961)259–275.
[28]H.J.Henzler,A.Biedermann,Modelstudies on particle stress in reactors,Chem.Ing.Tech.68(12)(1996)1546–1561.
[29]S.Galinat,F.Risso,O.Masbernat,P.Guiraud,Dynamics of drop breakup in inhomogeneous turbulence at various volume fractions,J.Fluid Mech.578(2007)85–94.
[30]S.Kumar,R.Kumar,K.S.Gandhi,A multistage model for drop breakage in stirred vessels,Chem.Eng.Sci.47(5)(1992)971–980.
[31]P.Walstra,Principles of emulsion formation,Chem.Eng.Sci.48(2)(1993)333–349.
[32]R.V.Calabrese,T.P.K.Chang,P.T.Dang,Drop breakup in turbulent stirred-tank contactors.Part I:effect of dispersed-phase viscosity,AICHE J.32(4)(1986)657–666.
[33]G.A.Hughmark,Drop breakup in turbulent flow,AICHE J.17(4)(1971)1000.
[34]J.T.Davies,Drop size of emulsions related to turbulent energy-dissipation rates,Chem.Eng.Sci.40(5)(1985)839–842.
[35]K.Arai,M.Konno,Y.Matunaga,S.Saito,Effect ofdispersed-phase viscosity on maximum stable drop size for breakup in turbulent-flow,J.Chem.Eng.Jpn 10(4)(1977)325–330.
[36]P.K.Das,Prediction of maximum stable diameter of viscous drops in a turbulent dispersion,Chem.Eng.Technol.19(1)(1996)39–42.
[37]J.S.Lagisetty,P.K.Das,R.Kumar,K.S.Gandhi,Breakage of viscous and non-Newtonian drops in stirred dispersions,Chem.Eng.Sci.41(1)(1986)65–72.
[38]P.K.Das,A stochastic model for breakage frequency of viscous drops in turbulent dispersions,Chem.Eng.Sci.61(11)(2006)3705–3713.
[39]C.A.Sleicher,Maximum stable drop size in turbulent flow,AICHE J.8(4)(1962)471–477.
[40]J.E.Swartz,D.P.Kessler,Single drop breakup in developing turbulent pipe flow,AICHE J.16(2)(1970)254–260.
[41]J.F.Walter,H.W.Blanch,Bubble break-up in gas–liquid bioreactors— break-up in turbulent flows,Chem.Eng.J.32(1)(1986)B7–B17.
[42]J.S.Percy,C.A.Sleicher,Drop breakup in the flow of immiscible liquids through an orifice in a pipe,AICHE J.29(1)(1983)161–164.
[43]M.Konno,M.Aoki,S.Saito,Scale effect on breakup process in liquid–liquid agitated tanks,J.Chem.Eng.Jpn 16(4)(1983)312–319.
[44]S.Galinat,O.Masbernat,P.Guiraud,C.Dalmazzone,C.Noïk,Drop break-up in turbulent pipe flow downstream of a restriction,Chem.Eng.Sci.60(23)(2005)6511–6528.
[45]S.Maaß,A.Gaebler,A.Zaccone,A.R.Paschedag,M.Kraume,Experimental investigations and modelling of breakage phenomena in stirred liquid/liquid systems,Chem.Eng.Res.Des.85(A5)(2007)703–709.
[46]A.Zaccone,A.Gaebler,S.Maaß,D.Marchisio,M.Kraume,Drop breakage in liquid–liquid stirred dispersions:modelling of single drop breakage,Chem.Eng.Sci.62(22)(2007)6297–6307.
[47]S.Maaß,S.Wollny,R.Sperling,M.Kraume,Numerical and experimental analysis of particle strain and breakage in turbulent dispersions,Chem.Eng.Res.Des.87(4)(2009)565–572.
[48]S.Maaß,S.Buscher,S.Hermann,M.Kraume,Analysis of particle strain in stirred bioreactors by drop breakage investigations,Biotechnol.J.6(8)(2011)979–992.
[49]G.Kolb,G.Wagner,J.Ulrich,Studies on the break-up of single drops in dispersion units for the production of emulsions,Chem.Ing.Tech.73(1-2)(2001)80–83.
[50]N.B.Raikar,S.R.Bhatia,M.F.Malone,M.A.Henson,Experimental studies and population balance equation models for breakage prediction of emulsion drop size distributions,Chem.Eng.Sci.64(10)(2009)2433–2447.
[51]M.J.Prince,H.W.Blanch,Bubble coalescence and break-up in air-sparged bubblecolumns,AICHE J.36(10)(1990)1485–1499.
[52]A.Pfennig,A.Schwerin,In fluence of electrolytes on liquid–liquid extraction,Ind.Eng.Chem.Res.37(8)(1998)3180–3188.
[53]J.Villwock,F.Gebauer,J.Kamp,H.J.Bart,M.Kraume,Systematic analysis of single droplet coalescence,Chem.Eng.Technol.37(7)(2014)1103–1111.
[54]J.Saien,S.Akbari,Variations of inter facialtension of the n-butylacetate plus water system with sodium dodecyl sulfate from(15 to 22)degrees C and pH between 6 and 9,J.Chem.Eng.Data 53(2)(2008)525–530.
[55]G.Brezesinski,H.J.Mögel,Grenz flächen und Kolloide:Physikalisch-chemische Grundlagen,Spektrum Akademischer Verlag,1993.
[56]L.Kempa,H.P.Schuchmann,H.Schubert,Drip-reducing and drip coalescence in mechanical emulsifying with high pressure homogenisers,Chem.Ing.Tech.78(6)(2006)765–768.
[57]S.Tesch,B.Freudig,H.Schubert,Herstellen von Emulsionen in Hochdruckhomogenisatoren-Teil1:Zerkleinern und Stabilisieren von Tropfen,Chem.Ing.Tech.74(6)(2002)875–880.
[58]S.Hall,M.Cooke,A.El-Hamouz,A.J.Kowalski,Droplet break-up by in-line Silverson rotor–stator mixer,Chem.Eng.Sci.66(10)(2011)2068–2079.
[59]H.T.Chen,S.Middleman,Drop size distribution in agitated liquid–liquid systems,AICHE J.13(5)(1967)989–995.
[60]S.Tcholakova,N.Vankova,N.D.Denkov,T.Danner,Emulsi fication in turbulent flow:3.Daughter drop-size distribution,J.Colloid Interface Sci.310(2)(2007)570–589.
[61]C.Y.Wang,R.V.Calabrese,Drop breakup in turbulent stirred-tank contactors.Part II.Relative in fluence of viscosity and interfacial tension,AICHE J.32(4)(1986)667–676.
[62]S.B.Collins,J.G.Knudsen,Drop-size distributions produced by turbulentpipe flow of immiscible liquids,AIChE J.16(6)(1970)1072–1080.
[63]R.Clift,J.R.Grace,M.E.Weber,Bubbles,Drops,and Particles,Academic Press,1978.
 Chinese Journal of Chemical Engineering2016年2期
- Chinese Journal of Chemical Engineering的其它文章
- Experimental evaluation and modeling of liquid jet penetration to estimate droplet size in a three-phase riser reactor
- CFD based extraction column design—Chances and challenges
- Review on current advances,future challenges and consideration issues for post-combustion CO2 capture using amine-based absorbents☆
- Photorheologically reversible micelle composed ofpolymerizable cationic surfactant and 4-phenylazo benzoic acid☆
- Experimental study on the effects of big particles physical characteristics on the hydraulic transport inside a horizontal pipe
- Relationship between breakthrough curve and adsorption isotherm of Ca(II)imprinted chitosan microspheres for metaladsorption☆
