生物炭对黄绵土水分入渗和持水性能的影响
解 倩,王丽梅,齐瑞鹏,王彤彤,郑纪勇,
(1.西北农林科技大学 资源环境学院,杨凌 712100;2.黑龙江倍丰农资集团,哈尔滨 150000;3.中国科学院水利部水土保持研究所 黄土高原土壤侵蚀与旱地农业国家重点实验室,杨凌 712100)
生物炭对黄绵土水分入渗和持水性能的影响
解 倩1,王丽梅1,齐瑞鹏2,王彤彤1,郑纪勇1,3
(1.西北农林科技大学 资源环境学院,杨凌 712100;2.黑龙江倍丰农资集团,哈尔滨 150000;3.中国科学院水利部水土保持研究所 黄土高原土壤侵蚀与旱地农业国家重点实验室,杨凌 712100)
基于室内一维土柱入渗试验,定容重条件下研究了生物炭粒径(1— 2 mm和≤0.25 mm)和添加量(10 g·kg-1、50 g·kg-1、100 g·kg-1和150 g·kg-1)对扰动黄绵土的水分入渗过程及持水能力的影响。结果表明:生物炭明显降低了黄绵土的入渗能力,黄绵土的湿润锋深度与累积入渗量随着生物炭添加量的增加而降低,且小粒径生物炭对黄绵土入渗能力的降低作用强于大粒径;生物炭明显增加了黄绵土的持水能力,且随添加量增大而增大,小粒径生物炭的促进作用优于大粒径;添加生物炭后黄绵土湿润锋深度与时间关系可用幂函数描述;Kostiakov、Philip、Horton入渗模型均能较好模拟生物炭添加后黄绵土累积入渗量随时间变化,其中,Kostiakov模型拟合精度更高;van Genuchten公式可以用来描述添加生物炭后黄绵土持水特征。该研究结果为添加生物炭后的黄绵土适宜性评价提供了土壤水分方面的参考依据。
黄绵土;生物炭;累积入渗量;湿润锋;持水能力
生物炭又称生物质炭(刘玉学等,2009;张文玲等,2009)或生物焦(罗凯等,2007),是指生物质(如:木材、作物秸秆或其他农作物废物)在厌氧或者无氧的条件下进行热解,生成的含有丰富空隙、含碳量高以及具有高热值而无污染的固体生物燃料(Lehmann and Joseph,2009)。生物炭以其良好的孔隙结构和理化性质,广泛的材料来源和广阔的产业化发展前景,成为当今农业、能源与环境等领域的研究热点(陈温福等,2013)。对生物炭研究的重视源于对巴西亚马逊河流域中部黑土的认识,研究发现,富含木炭的土壤比临近的无木炭土壤具有更高的肥力和良好的物理特性(Chan et al,2007),且其在土壤中保存已有数百年甚至上千年的历史。有研究表明,生物炭可以提高土壤保水保肥能力、改善土壤理化性质、净化与吸收土壤污染物、减少温室气体排放、提高作物产量等(Lehmann et al,2003;Whitman et al,2009)。土壤累积入渗量、土壤水分特征曲线等参数是表征土壤水动力学特征的重要指标,可反映土壤孔隙大小、导水性能和土壤水入渗性能等(雷志栋等,1988)。土壤水动力学的研究不仅有助于促进土壤非饱和带水分迁移过程理论发展,而且可为综合评价地表、地下水资源,合理确定农田灌溉技术参数提供科学依据(李雪转和樊贵盛,2006)。Glaser et al(2002)在田间条件下研究认为,加入生物炭土壤的持水性能比周围未加生物炭土壤的持水性能增加了至少18%。但也有学者认为加入土壤的生物炭如果过细,也有可能因为细小生物炭颗粒堵塞土壤孔隙而导致土壤入渗性能下降(Doerr et al,2000)。还有研究表明,随生物炭添加量增加,土壤含水量逐渐提高,但在生物炭添加量继续增多时,含水量又会呈现下降趋势。Dugan et al(2011)发现土壤添加5 t·hm-2、10 t·hm-2的玉米秸秆生物炭时,田间持水量均有显著增加,而15 t·hm-2添加量下的田间持水量增加幅度却有明显下降,原因可能是生物炭表面普遍具有斥水性,当其添加量增加时,这种水分排斥效应就更易表现出来。目前,生物炭对土壤水分或土壤水文过程的影响还仅停留在田间持水量方面,而对土壤水分入渗过程、持水能力及动态变化方面的研究相对缺乏。
黄土高原陕北地区大部分土壤质地疏松,保水保肥性较差,使得该区域水土流失极为严重,土壤的干旱与贫瘠是限制该地区农业生产的主要因素(山仑,2012),若将吸水保肥性极强的生物炭加入该质地土壤,势必对该区域土壤持水保肥性有显著影响。且近年来,将生物炭农用作为土壤改良剂、肥料缓释载体以及碳封存剂备受关注(Lehmann et al,2006;Steiner et al,2008;Kimetu et al,2010),生物炭的出现为解决上述问题提供了一种新途径和新方法。因此,本文通过室内模拟方法,系统研究了生物炭不同粒径和添加量对半干旱地区典型土壤黄绵土水分入渗过程和持水能力的影响,并进行了模型模拟,拟为生物炭在改善黄绵土理化性质、提高土壤保水保肥性能及减轻黄土高原水土流失等方面提供参考依据。
1 材料与方法
1.1 供试土壤
黄绵土采自陕西安塞生态试验站试验田,采用S型采样方法,利用小土铲取5个土样,土壤采样深度均为0—20 cm。样品采集后将土壤杂物去除,避光条件下自然风干,过2 mm筛备用,并在取土点附近利用环刀法测定土壤容重,每个采样点重复3次。土壤风干后过1 mm筛,利用英国马尔文公司生产的MS-2000激光粒度分析仪,测定土壤机械组成(黄土高原土壤侵蚀与旱地农业国家重点实验室)。土壤基本物理性质见表1。

表1 供试土壤的基本物理性质Tab.1 Physical property of experimental soil
1.2 供试生物炭
试验用生物炭为杂木黑炭(杨树、枣树、槐树等),碳质量分数为85%,由陕西亿鑫生物能源科技开发有限公司提供。将生物炭粉碎过筛,制备1—2 mm和≤0.25 mm 2种粒径备用,生物炭的电镜结构如图1。
1.3 试验设置和方法
1.3.1 试验设置
将1—2 mm和≤0.25 mm 两种粒径生物炭,按照0 g·kg-1、10 g·kg-1、50 g·kg-1、100 g·kg-1、150 g·kg-1的添加剂量,与土壤混合均匀,其中0为不添加生物炭的对照处理(CK)。
1.3.2 土壤入渗的测定方法
装柱容器为内径5 cm、高35 cm的透明聚氯乙烯(polyvinyl chloride resin,PVC)圆柱。装土前底部用几层细纱布封口,防止土样颗粒流失,管壁均匀涂抹一薄层凡士林,以减少管壁对入渗产生影响。为使室内模拟条件下试验结果具有更高的参考价值,将各处理分别按田间实际容重设定容重,分层均匀装入土柱(总高度控制在30 cm),每次填土必须保证土壤表面打毛,再进行填装,以保证土层之间接触紧密,每个处理重复3次。将土柱容器垂直固定在铁架台上,调整马氏瓶发泡点高度,使橡皮管口与土柱表面在同一水平面上,水头高度均控制为3 cm。打开阀门,待湿润锋通过土壤表面时开始计时,连续记录时间,相应的湿润锋运动深度和入渗量,当湿润锋超过土柱3/4后停止供水。

图1 杂木生物炭的电镜扫描图Fig.1 Microstructure of biochar by SEM
1.3.3 土壤水分特征曲线的测定方法
按照设定容重分层均匀装入体积为100 cm3的环刀中,浸水饱和12 h。然后放入高速冷冻离心机中(CR-21G,日本HITACHI公司),根据设计压力设定离心机转速,加压范围为10 —1000 kPa,分别为10 kPa、20 kPa、40 kPa、60 kPa、80 kPa、100 kPa、200 kPa、400 kPa、600 kPa、800 kPa、1000 kPa。每个压力下土样达到平衡后,取出称质量。全部离心结束,取土在105℃下烘干,计算不同吸力下的土壤体积含水率。
1.3.4 湿润锋深度与入渗时间的拟合方法
为充分了解生物炭添加量和粒径对黄绵土湿润锋动态变化规律,根据曲线变化趋势,用幂函数对湿润锋深度随时间的变化过程进行拟合,公式为:

式中:A和B为经验常数,无实际物理意义。其中A在数值上等于时间为1 h湿润锋推进距离,B可表征湿润锋推进速度的衰减程度。
1.3.5 入渗模型
Kostiakov入渗公式:

式中:K和n取决于土壤及入渗初始条件的经验常数,无实际物理意义。
Philip方程:

式中:I(t)为累积入渗量(cm);S为吸渗率(cm·min-0.5);A为稳渗率(cm·min-1)。
霍顿(Horton)公式:

式中:a是稳定入渗率;b是初始入渗率;t是时间;c是经验参数。
1.3.6 土壤水分特征曲线的拟合方法
采用van Genuchten方程作为土壤水分特征曲线的表达式,利用美国国家盐改中心(US Salinity Laboratory)提供的RETC软件对方程中的5 个参数,即θs、θr、m、n、α进行分析求解。其表达式如下:

式中:θs为饱和土壤含水率,%;θr为滞留土壤含水率,%;h为土壤水吸力,cm;α为进气吸力的倒数,m、n是土壤孔隙尺寸分布参数,且m= 1-1/n,α、m、n均是影响土壤水分特征曲线形态的经验参数。
1.4 数据处理
采用 RETC 软件进行土壤水分特征曲线拟合,Sigmaplot 12.5和Origin 8.5软件作图,SPSS 17.0软件进行统计分析。
2 结果与分析
2.1 生物炭对黄绵土湿润锋的影响
2.1.1 生物炭粒径对黄绵土湿润锋运动过程的影响
土壤积水入渗后,剖面可分为4 个区:饱和区、过渡区、传导区以及含水量瞬时减少到初始值的湿润区。湿润区的前端为湿润锋,可表征水分在土壤基质吸力和重力作用下的运动特征。随着入渗时间延长,湿润锋深度不断增加,在入渗初始阶段,湿润锋曲线较陡,随着时间的推移,湿润锋曲线越来越平缓(图2)。
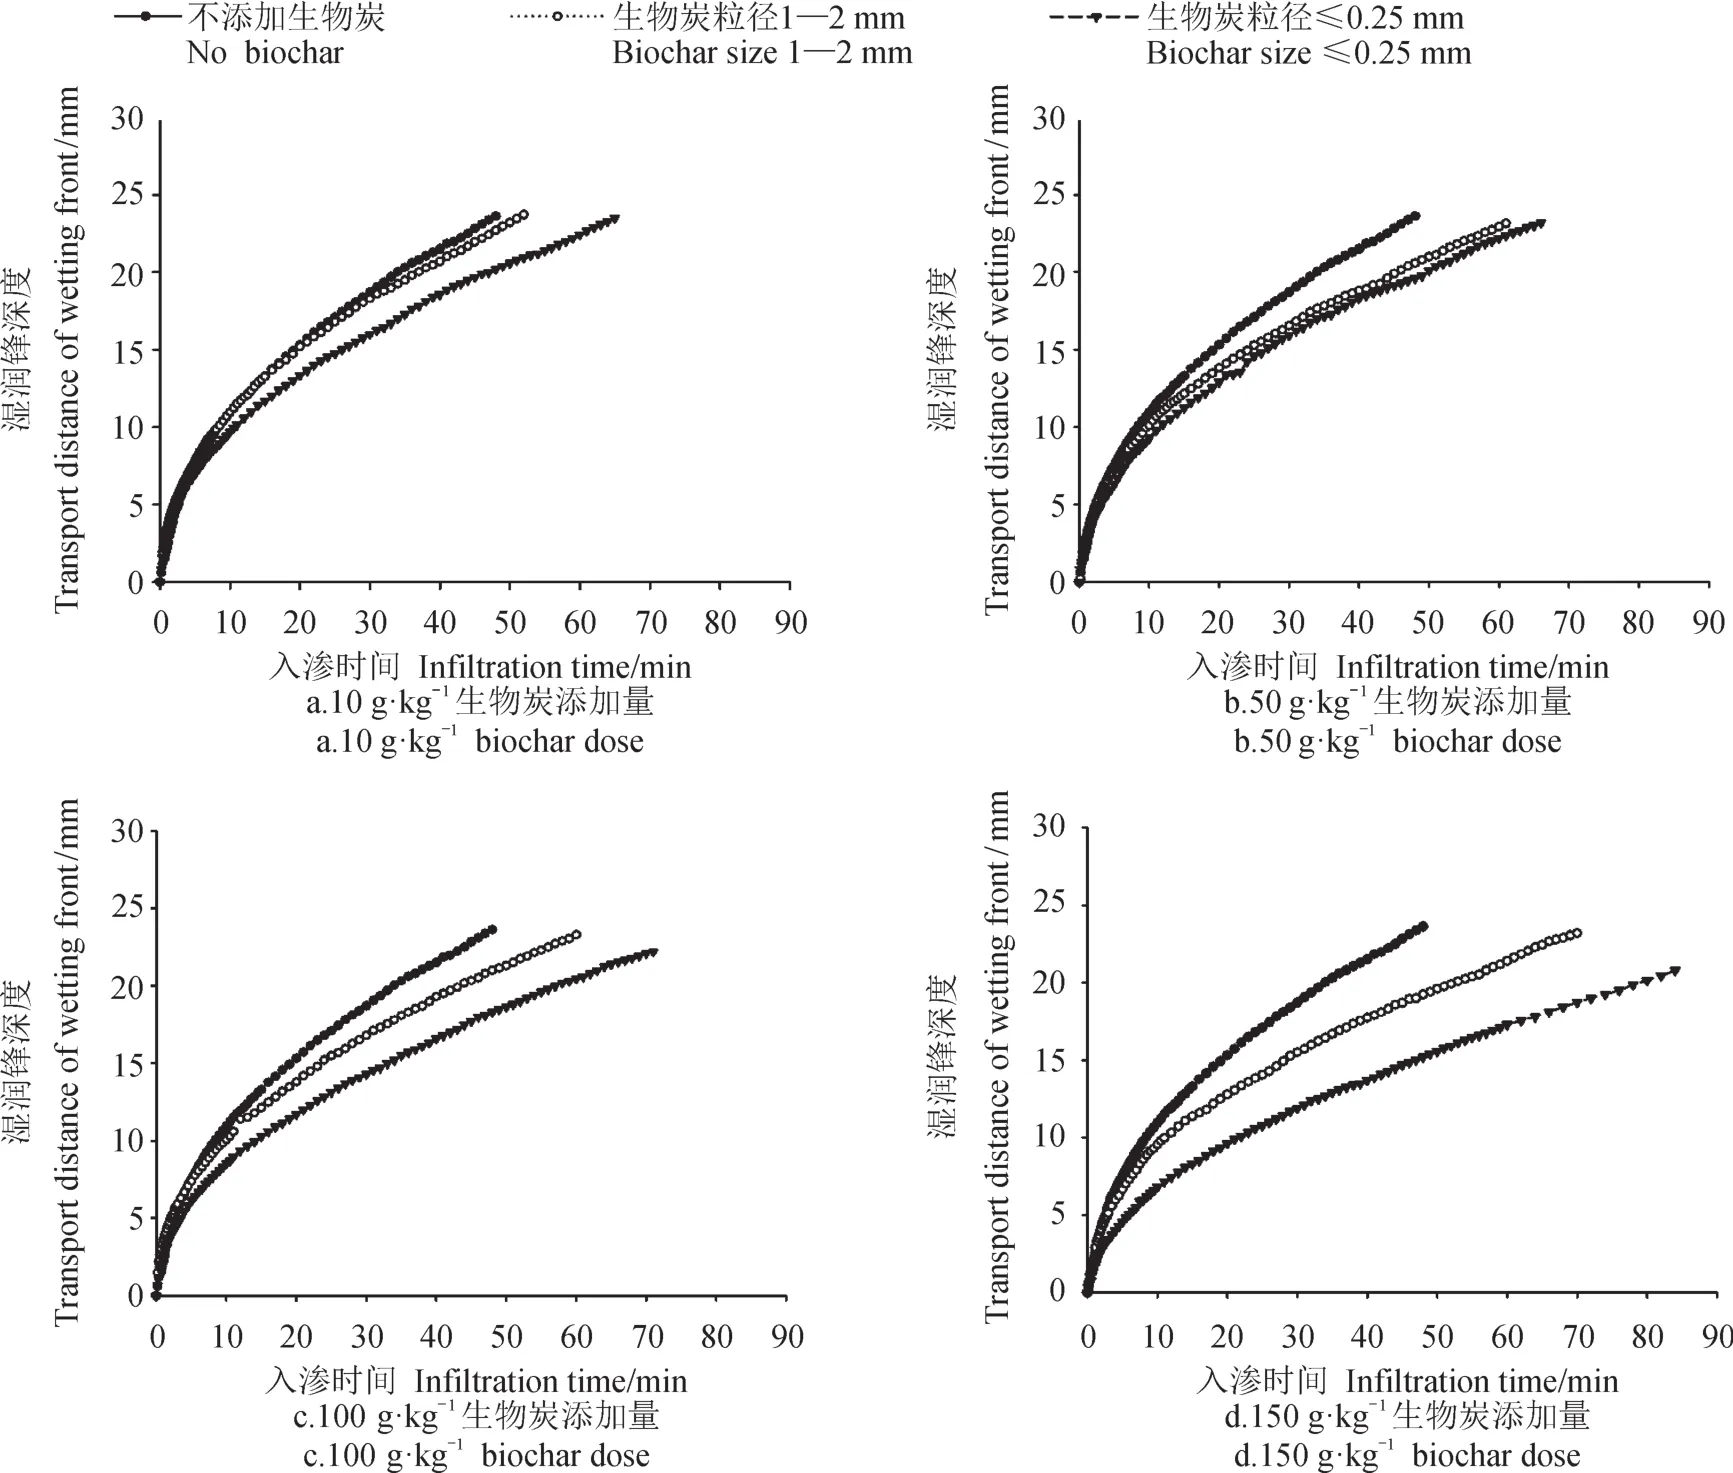
图2 生物炭粒径对黄绵土湿润锋的影响Fig.2 Effects of biochar particle size on loessial soil wetting front
由图2可以看出,添加生物炭对黄绵土入渗有显著影响,当生物炭添加量相同时,湿润锋一维垂直运动深度基本表现为不添加生物炭处理大于添加生物炭处理,1—2 mm生物炭粒径处理大于≤0.25 mm生物炭粒径处理。在40 min时,各添加量下1—2 mm和≤0.25 mm粒径处理湿润锋深度分别低于对照3.67%和13.49%(10 g·kg-1生物炭添加量)、12.47%和14.79%(50 g·kg-1生物炭添加量)、10.23%和22.79%(100 g·kg-1生物炭添加量)和17.49%和36.28%(150 g·kg-1生物炭添加量),表明生物炭对黄绵土湿润锋运动起到了抑制作用,且小粒径生物炭的抑制作用大于大粒径。
2.1.2 生物炭添加量对黄绵土湿润锋运动过程的影响
相同粒径条件下生物炭添加量对黄绵土湿润锋运动深度的影响大致相同,与生物炭添加量呈反比,即CK > 10 g·kg-1> 50 g·kg-1> 100 g·kg-1> 150 g·kg-1(图3)。40 min时,1—2 mm粒径处理中,10 g·kg-1,50 g·kg-1,100 g·kg-1和150 g·kg-1添加量处理的湿润锋运动深度分别为20.27 mm,18.82 mm, 19.30 mm和17.74 mm,分别比对照处理低5.72%、12.47%、10.23%和17.49%;≤0.25 mm粒径处理中,分别比对照处理低13.49%、14.79%、22.79%和36.28%。数据表明,生物炭添加量越大对黄绵土湿润锋一维垂直运动深度的抑制效果越明显。
2.1.3 湿润锋深度与入渗时间的拟合
用公式(1)对湿润锋深度随时间的变化过程进行拟合的结果显示(表2),决定系数R2在0.997—0.999,表明生物炭不同添加量和粒径影响下的湿润锋深度与时间均有较好幂函数关系。
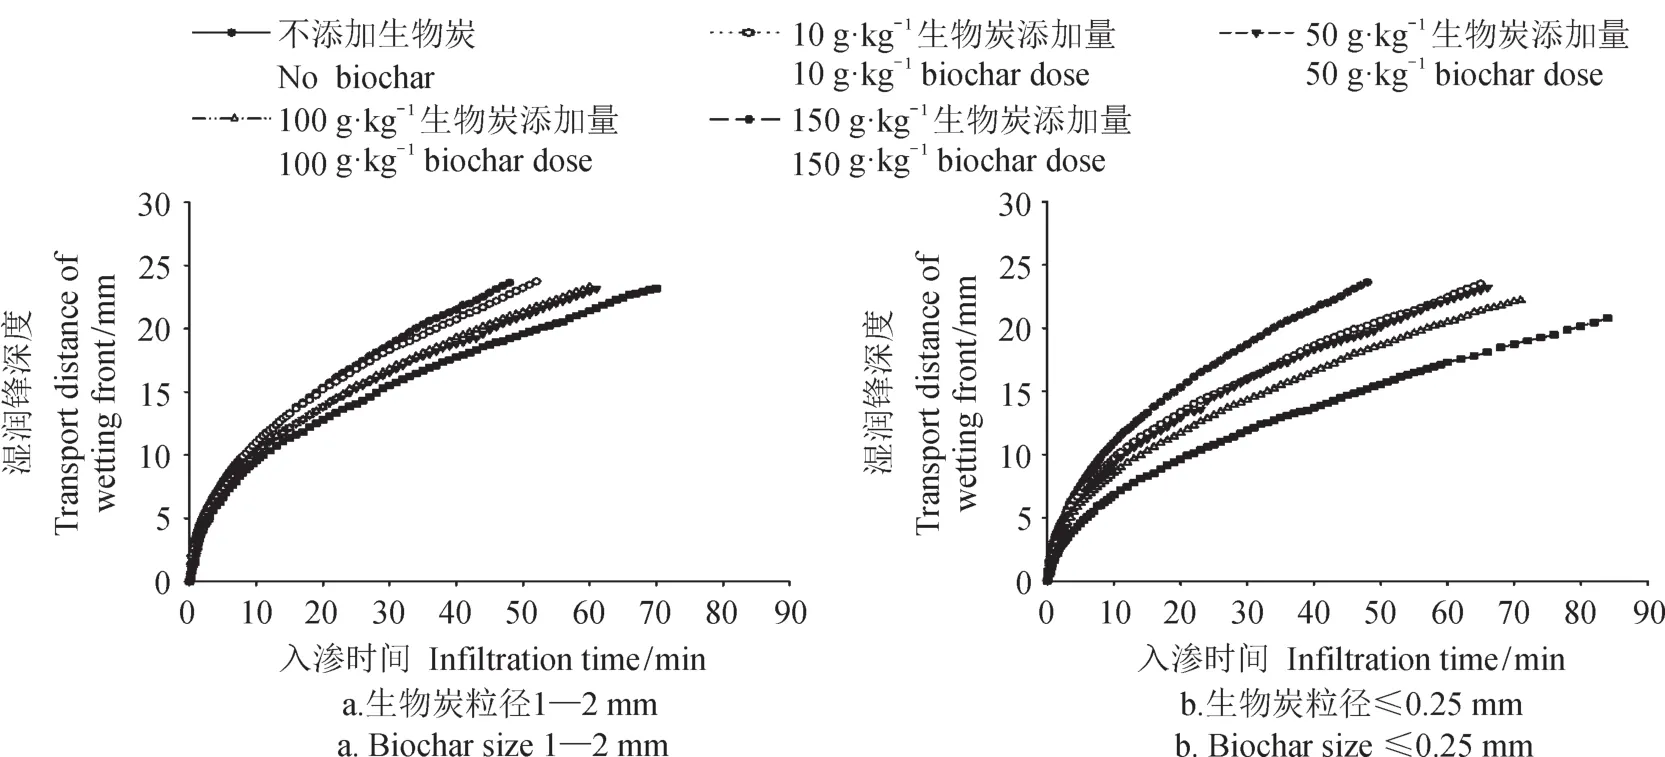
图3 生物炭添加量对黄绵土湿润锋的影响Fig.3 Effects of biochar addition amount on loessial soil wetting front
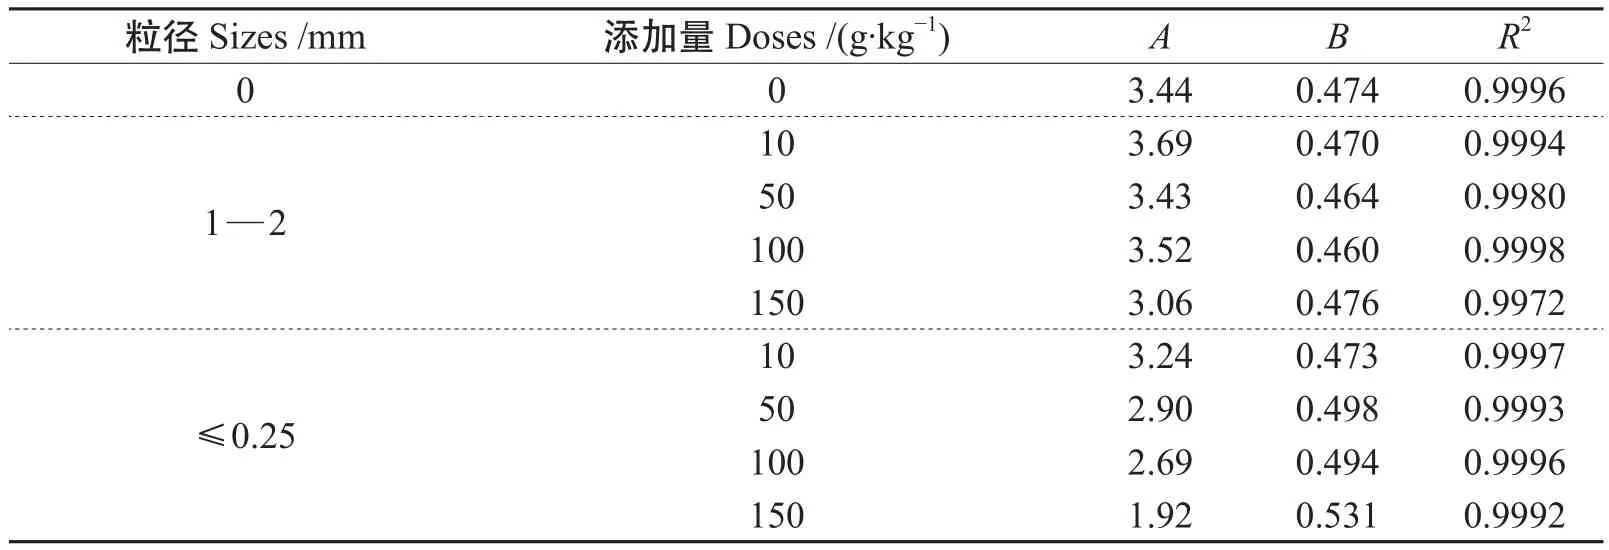
表2 湿润锋深度与入渗时间的拟合结果Tab.2 Fitting results of wetting depth and in fi ltration time
2.2 生物炭对黄绵土累积入渗量的影响
2.2.1 生物炭粒径对黄绵土累积入渗量的影响
水分入渗过程达到稳定后可用稳定入渗率表征入渗能力,但在达到稳定入渗之前,常用累积入渗量表征入渗能力(李卓等,2009)。各处理土壤入渗累积过程如图4所示,结果表明:除了50 g·kg-1添加量下,1—2 mm和≤0.25 mm粒径处理累积入渗曲线重合外,黄绵土累积入渗量均表现为不添加生物炭处理最大,1—2 mm生物炭粒径处理大于≤0.25 mm生物炭粒径处理的规律。40 min时各处理之间土壤的入渗速率基本稳定,故以该时刻的累积入渗量来衡量土壤稳渗前入渗能力。10 g·kg-1添加量下,40 min时1—2 mm和≤0.25 mm粒径处理累积入渗量分别为128.8 mm和109 mm,比对照低11.17%和24.83%。其他3种添加量对土壤累积入渗量的影响趋势基本与10 g·kg-1添加量相同,但是抑制程度有所不同。结果表明,小粒径生物炭对黄绵土累积入渗量的抑制程度更强。
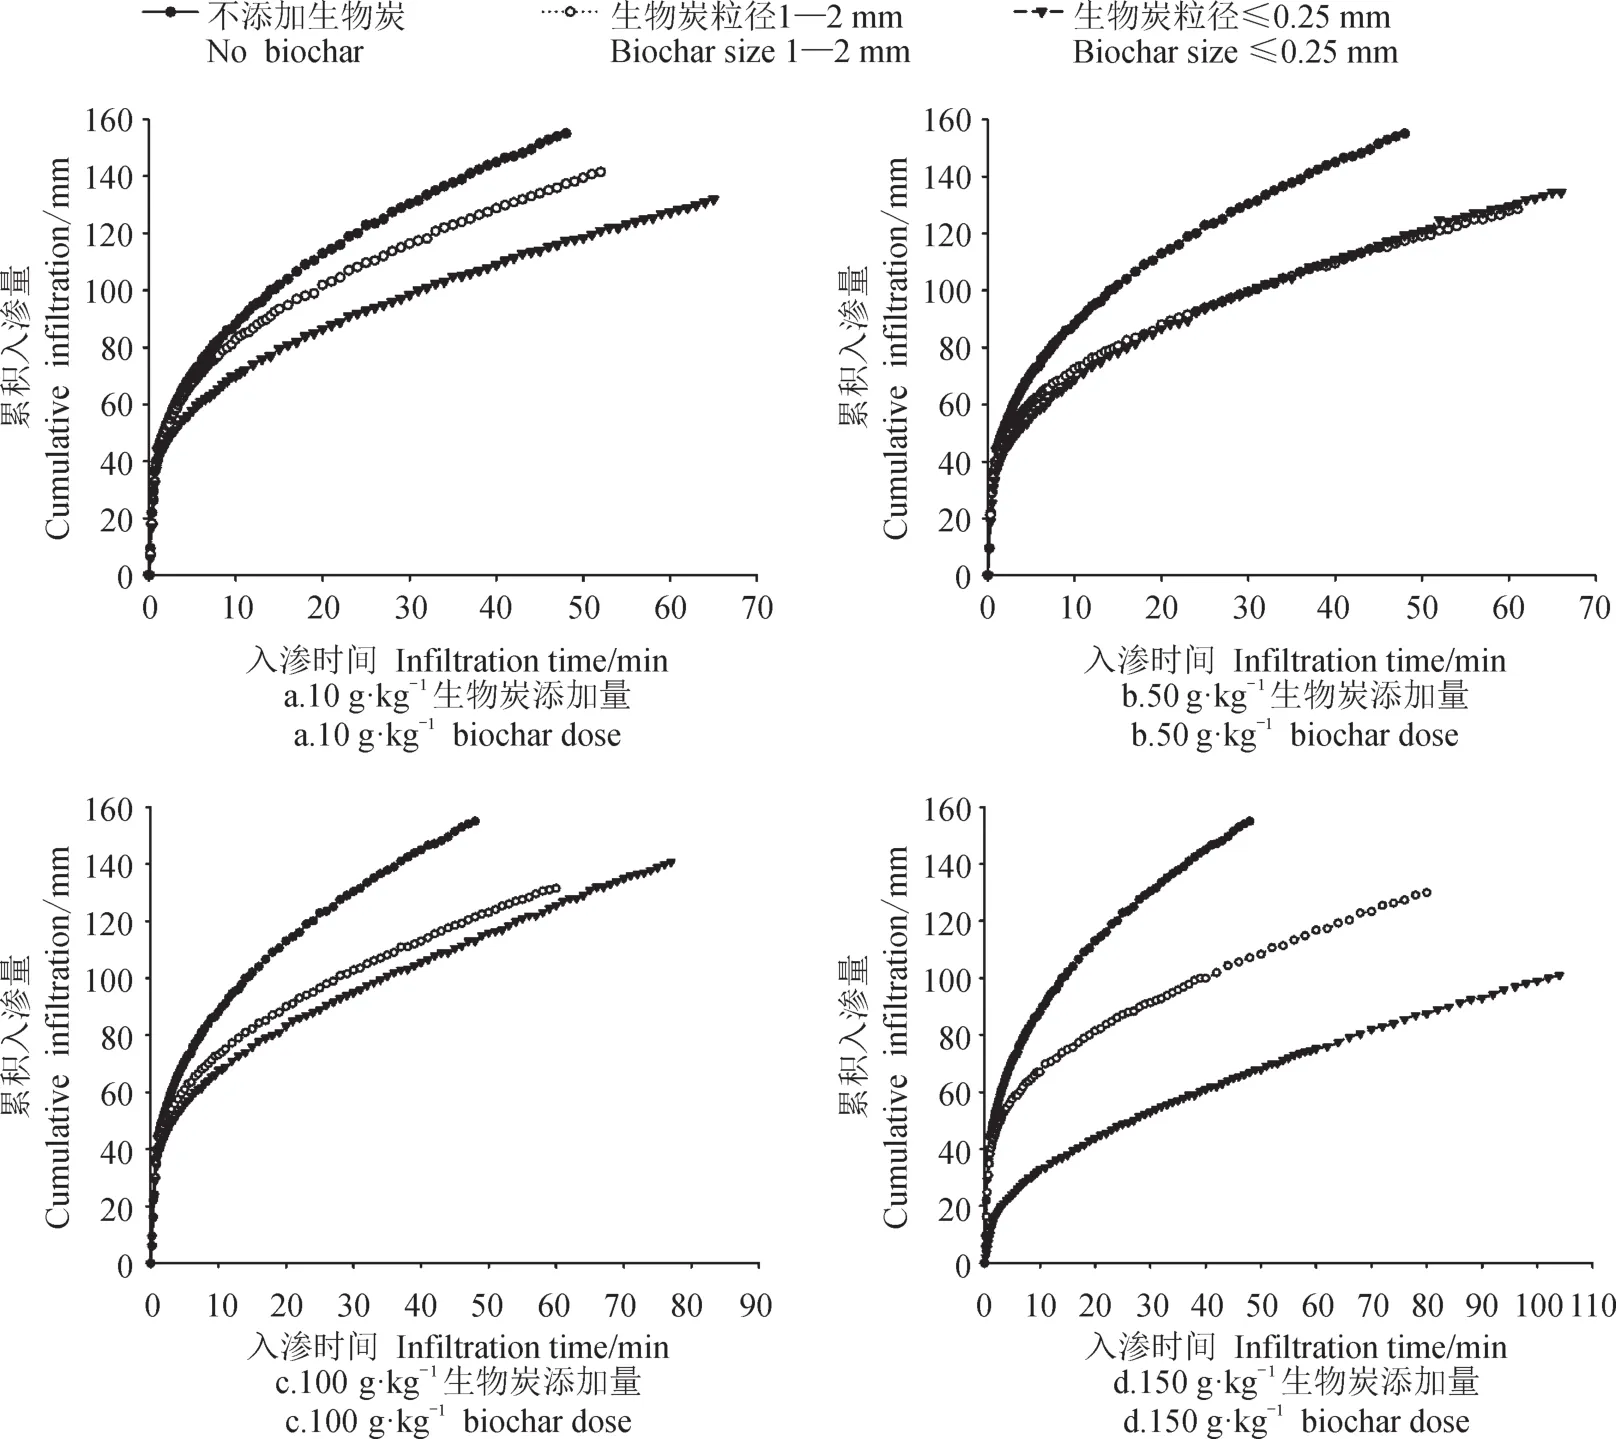
图4 生物炭粒径对黄绵土累积入渗量的影响Fig.4 Effects of biochar particle size on loessial soil cumulative in fi ltration
2.2.2 生物炭添加量对黄绵土累积入渗量的影响
图5可知,1—2 mm粒径条件下,黄绵土累积入渗量随着生物添加量的增加而降低。40 min时,10 g·kg-1,50 g·kg-1,100 g·kg-1和150 g·kg-1添加量处理土壤累积入渗量分别为128.8 mm,109.5 mm,113.0 mm和99.9 mm,与对照处理的145 mm相比,分别降低了11.17%、24.48%、22.07%和31.10%;≤0.25 mm粒径处理中,10 g·kg-1,50 g·kg-1和 100 g·kg-1粒径处理均降低了黄绵土累积入渗量,但三者的累积入渗曲线基本重合,而150 g·kg-1粒径处理显著降低了黄绵土的累积入渗量,40 min时的累积入渗量为61 mm,与对照相比降低幅度为57.93%。
2.2.3 各处理对黄绵土入渗模型参数的拟合
本文采用Kostiakov,Philip,Horton三种入渗模型(Ghorbani et al,2009)对各处理的入渗过程进行拟合。表3所示,各入渗模型处理的决定系数(R2)分别在0.989—0.998(Kostiakov),0.936—0.998(Philip),0.985—0.995(Horton)。可以看出Kostiakov入渗模型拟合效果较好,表明Kostiakov入渗模型适合添加生物炭的土壤入渗状况模拟。相同生物炭粒径添加时,Kostiakov入渗模型中的经验常数K随着生物炭添加量的增加而减小。相同添加量条件下,生物炭粒径对黄绵土的K值有相同的影响规律,即不添加生物炭处理大于添加生物炭处理,1—2 mm粒径大于≤0.25 mm粒径生物炭处理。生物炭对累积入渗量的衰减程度n值的影响没有明显变化规律。
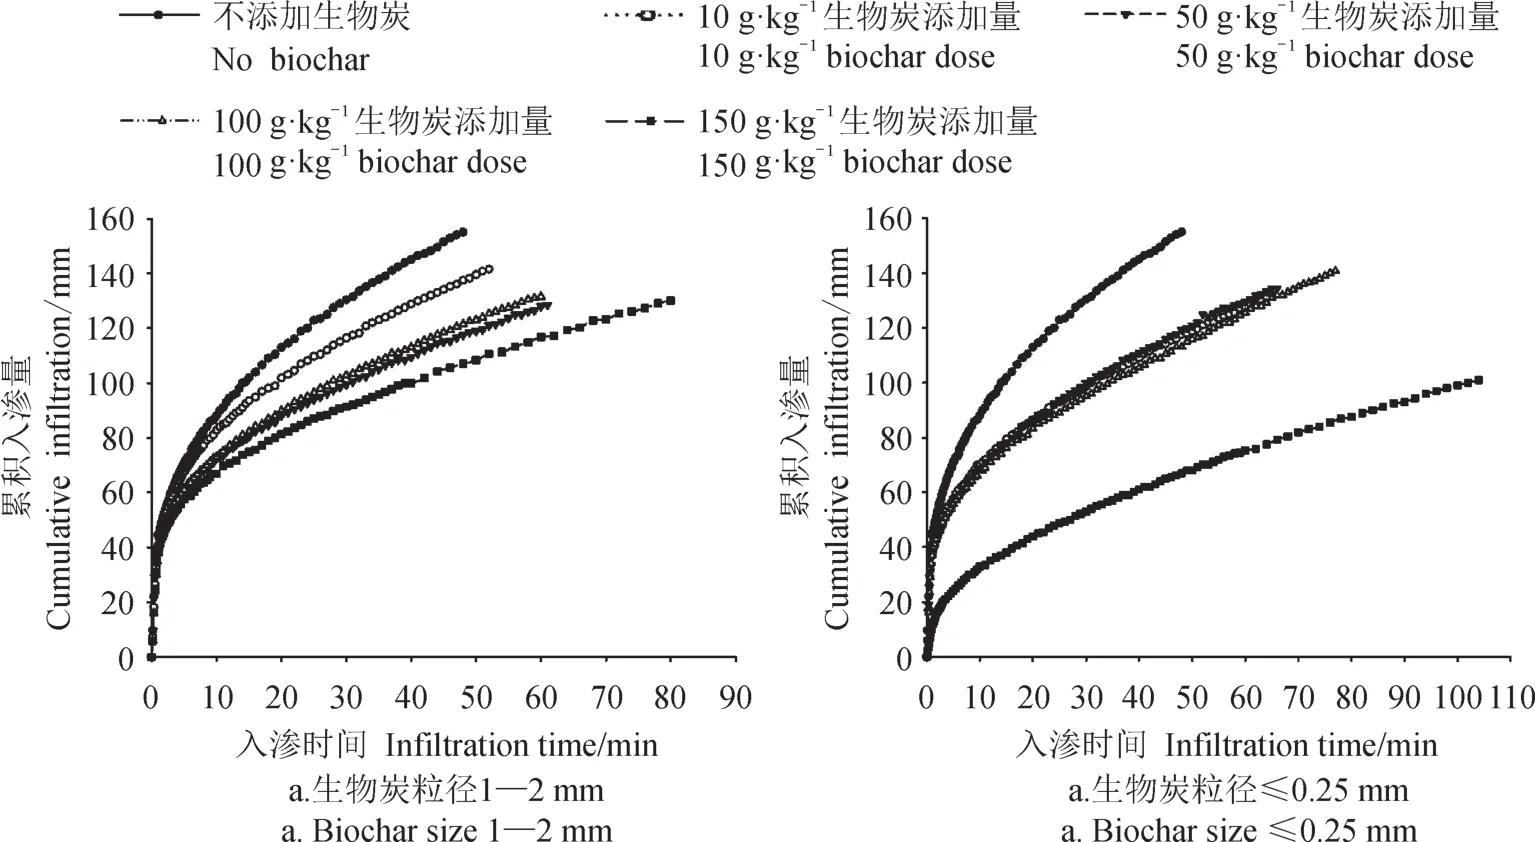
图5 生物炭添加量对黄绵土累积入渗量的影响Fig.5 Effects of biochar addition amount on loessial soil cumulative infiltration
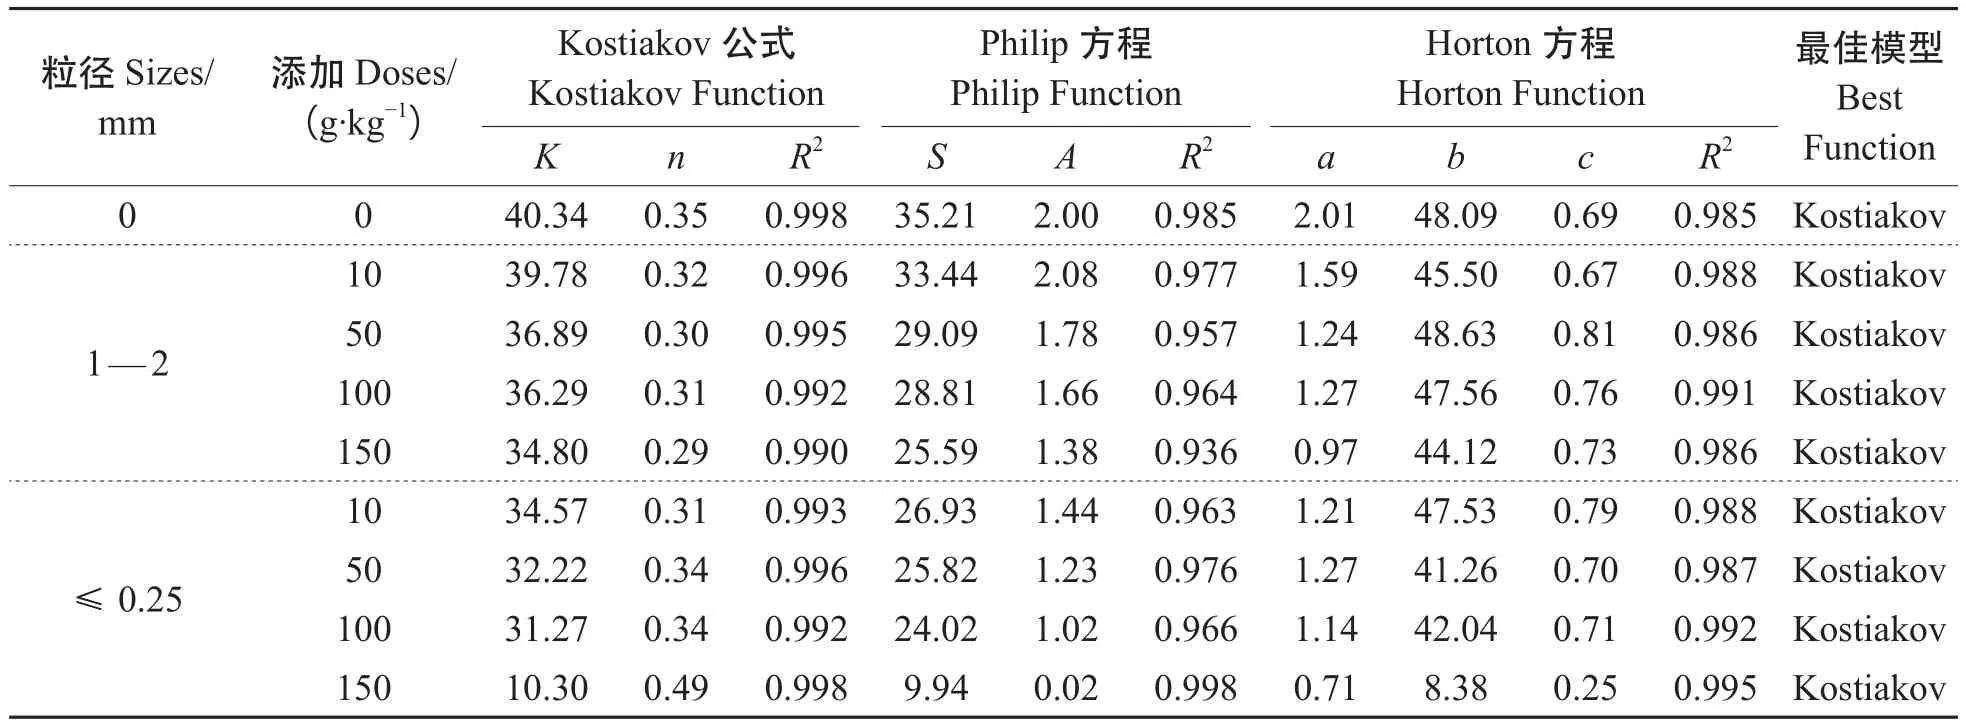
表3 各处理土壤水分入渗模型拟合结果Tab.3 Outcomes of model fi tting for water in fi ltration in different soil treatments
2.3 生物炭对黄绵土水分特征曲线的影响
2.3.1 生物炭粒径对黄绵土水分特征曲线的影响
水分特征曲线是反映土壤水势与土壤含水率之间关系的基本土壤水力参数,是研究土壤水分入渗、蒸发、土壤侵蚀及溶质运移过程的关键(邵明安等,2006;程冬兵和蔡崇法,2008)。
生物炭粒径对土壤水分特征曲线的影响因生物炭添加量的不同而不同(图6)。当生物炭添加量为10 g·kg-1时,1—2 mm和≤0.25 mm粒径处理的水分特征曲线基本和不添加生物炭处理的重合,说明低添加量下,生物炭粒径对黄绵土的持水能力影响不明显;50 g·kg-1添加量时,1—2 mm和≤0.25 mm粒径处理均增加了黄绵土的持水能力,但两种粒径的水分特征曲线基本重合;100 g·kg-1和150 g·kg-1添加量时,同一水吸力下黄绵土的体积含水量表现为不添加生物炭处理<大粒径(1— 2 mm)<小粒径(≤0.25 mm)生物炭处理,且150 g·kg-1添加量时黄绵土的持水能力更强,说明生物炭在粒径越小,添加量越高时,才能充分发挥其持水能力。
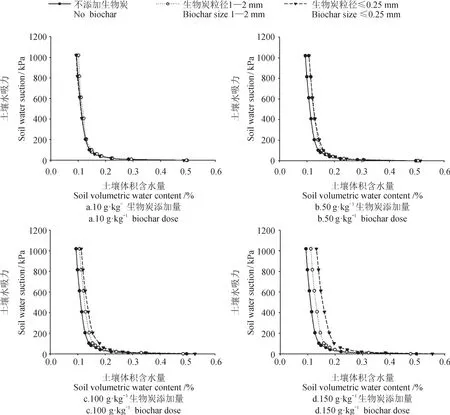
图6 生物炭粒径对黄绵土水分特征曲线的影响Fig.6 Effects of biochar particle size on loessial soil water retention curve
2.3.2 生物炭添加量对黄绵土水分特征曲线的影响
由图7看出,生物炭添加量对黄绵土水分特征曲线产生明显影响。当生物炭粒径相同,一定土壤水吸力内,黄绵土体积含水量随着生物炭添加量的增加而增加。当土壤水吸力在400 kPa时,≤0.25 mm粒径生物炭,10 g·kg-1,50 g·kg-1,100 g·kg-1和150 g·kg-1添加量处理的土壤体积含水量分别比对照处理高4.93%、11.41%、12.10%和17.29%;1—2 mm粒径生物炭,10 g·kg-1添加量的土壤水分特征曲线基本和不添加生物炭处理重合,50 g·kg-1,100 g·kg-1和150 g·kg-1添加量处理的土壤体积含水量分别比对照处理高12.77%、21.15%和40.94%。结果表明:一定土壤水吸力内,在添加小粒径生物炭且添加量大时,黄绵土体积含水量较大,即小粒径大添加量生物炭对促进黄绵土的持水能力效果更佳。
2.3.3 水分特征曲线模型参数分析
从表4看出,使用RETC软件得到的van Genuchten模型决定系数R2在0.995—0.999,拟合效果好,说明van Genuchten模型适合添加生物炭的土壤水分特征曲线的拟合。添加生物炭处理的土壤滞留含水率(θr)和土壤饱和含水率(θs)均高于CK处理。α值一般认为是进气吸力的倒数,即水分特征曲线接近饱和时拐点的吸力值的倒数。对于同种土壤来说,进气吸力越小,α值越大,土壤持水能力越差,排水越容易,添加生物炭处理使得黄绵土进气吸力的倒数均降低,由此可知,添加生物炭能够使得黄绵土持水能力有所增加。各土壤处理之间的n值变化不大,且没有明显的变化规律。
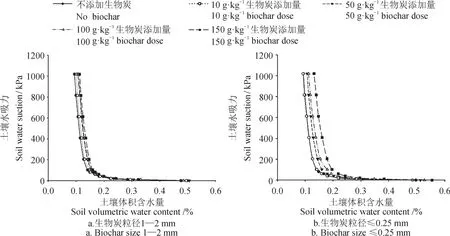
图7 生物炭添加量对黄绵土水分特征曲线的影响Fig.7 Effects of biochar addition amount on loessial soil water retention curve

表4 土壤水分特征曲线拟合参数Tab.4 Soil water retention curve fi tting parameters
3 讨论
3.1 生物炭对黄绵土入渗特征的影响
土壤入渗特征受土壤质地、容重、含水率、地表结皮状况、水稳性团粒含量等多种因素的共同影响(闵雷雷等,2010)。生物炭处理均明显抑制了黄绵土的入渗能力。在入渗初期,不同粒径和添加量的生物炭对黄绵土累积入渗量和湿润锋推进速率的影响均较小,其曲线重合度较大。这主要是由于在入渗初始阶段,水势梯度较大,基质势为影响累积入渗量和湿润锋推进速率的主要因素(谭帅等,2014),因此在最初几分钟内,累积入渗量和湿润锋推进速率均随生物炭添加量和粒径变化较小;随着入渗的进行,黄绵土累积入渗量和湿润锋推进速率逐渐趋于稳定,同时,不同生物炭添加量和粒径对黄绵土累积入渗量和湿润锋推进速率的抑制影响差异逐渐明显。这可能是因为生物炭的加入填充了土壤中孔隙,有效孔隙及水分通道成为影响累积入渗量和湿润锋推进速率的主要因素。向黄绵土中添加生物炭后,无论生物炭粒径大小,其持水能力都会好于对照的黄绵土自身颗粒,因为向黄绵土中添加生物炭,相当于提高了土壤黏粒含量,大大增加了土壤的持水能力,即生物炭处理均明显抑制了黄绵土的入渗能力,这与高海英等(2011)生物炭能够降低质地较轻土壤入渗性能的研究结果相一致。
生物炭添加量相同,一定入渗历时内,黄绵土累积入渗量和湿润锋推进速率均在小粒径生物炭(≤0.25 mm)添加时表现为最小;生物炭粒径相同,一定入渗历时内,除了≤0.25 mm粒径处理,10 g·kg-1,50 g·kg-1和100 g·kg-1添加量时累积入渗曲线重合外,其他处理黄绵土累积入渗量和湿润锋推进速率均随着生物炭添加量的增加而降低。这主要是由于生物炭具有极大比表面积,加入生物炭后,虽然小孔隙增多,但可供水分流动和互相连通的孔隙减少,水流弯曲度增加,使得导水率降低,从而使黄绵土累积入渗量和湿润锋推进速率受阻。而小粒径生物炭(≤0.25 mm)比大粒径生物炭具有更大的比表面积,从而能够更有效减少黄绵土透水大孔隙数量,堵塞土壤孔隙运动通道而导致土壤入渗性能力下降,且生物炭添加量越大这种阻碍作用就越强,这与Doerr et al(2000)的研究结果相一致,所以黄绵土的入渗能力随着生物炭添加量的增加而降低,且小粒径生物炭对黄绵土入渗的抑制作用更明显。≤0.25 mm粒径生物炭处理中,10 g·kg-1,50 g·kg-1和100 g·kg-1添加量累积入渗曲线重合,这可能是因为影响这一粒径土壤入渗的主要因素是生物炭颗粒大小,而不是生物炭添加量,具体原因需要进一步研究。
3.2 生物炭对黄绵土水分特征曲线的影响
土壤水分特征曲线依赖于土壤性状,在不同阶段影响因素也不同,在低吸力段,主要是大孔隙毛管力起作用。中高吸力段主要取决于土壤颗粒的表面吸附作用(余新晓等,2003)。所以在低吸力范围内土壤水分特征曲线都有个急速下降阶段,之后随吸力增加出现一个较长的平缓区。
生物炭明显增加了黄绵土的持水能力,且小粒径大添加量生物炭对促进黄绵土的持水能力效果更佳,与Ibrahim et al(2013)研究结果一致。这主要是因为生物炭属多孔性材料,具有一定的吸水倍率,可增加土壤吸水量;其次,生物炭具有巨大的比表面积,与土壤混合改变了原土样的孔隙状况,增加了土壤孔隙度。而小粒径(≤0.25 mm)比大粒径生物炭可能具有更大的比表面积,吸水能力及对黄绵土孔隙度的增加能力更优,所以黄绵土持水能力随着生物炭粒径的减小而增加,且在生物炭粒径一定时,生物炭添加量越大,对原土样孔隙状况的影响愈强烈,对土壤持水量增加作用就越大(Nimmo,1997;Chan et al,2007;Atkinson et al,2010)。低添加量(10 g·kg-1)条件下,生物炭粒径对黄绵土持水能力的影响并不明显,可能原因是生物炭在低含量的条件下,对土壤水分的固持能力是有限的,在强大的外力干扰下,这种固持能力无法体现出来,但具体原因需要深入的研究。
4 结论
本试验采用定水头法分析了生物炭粒径和添加量对扰动黄绵土入渗过程及持水能力的影响,得到以下结论:
(1)生物炭能够明显抑制黄绵土的入渗能力。黄绵土的入渗能力随着生物炭添加量的增加而降低,且小粒径(≤0.25 mm)生物炭对黄绵土入渗的抑制作用更明显。
(2)生物炭明显增加了黄绵土的持水能力,且小粒径(≤0.25 mm)大添加量(150 g·kg-1)生物炭对促进黄绵土的持水能力效果更佳。
(3)添加生物炭后黄绵土湿润锋深度与时间关系遵循幂函数变化;Kostiakov、Philip、Horton入渗模型均能较好的描述添加不同生物炭粒径和含量的黄绵土累积入渗量随时间变化过程。其中,Kostiakov模型拟合精度更高;van Genuchten公式适合添加生物炭黄绵土水分特征曲线的拟合。
陈温福, 张伟明, 孟 军. 2013. 农用生物炭研究进展与前景[J].中国农业科学, 46(16): 3324 – 3333. [Chen W F, Zhang W M, Meng J. 2013. Advances and prospects in research of biochar utilization in agriculture [J].Scientia Agricultura Sinica, 46(16): 3324 – 3333.]
程冬兵, 蔡崇法. 2008. 室内基于土壤水分再分布过程推求紫色土导水参数[J].农业工程学报, 24(7): 7 – 12.[Cheng D B, Cai C F. 2008. Determination of purple soil unsaturated hydraulic properties based on soil water redistribution in laboratory [J].Transactions of the Chinese Society of Agricultural Engineering, 24(7): 7 – 12.]
高海英, 何绪生, 耿增超, 等. 2011. 生物炭及炭基氮肥对土壤持水性能影响的研究[J].中国农学通报, 27(24): 207 – 213. [Gao H Y, He X S, Geng Z C, et al. 2011. Effects of biochar and biochar-based nitrogen fertilizer on soil water-holding capacity [J].Chinese Agricultural Science Bulletin, 27(24): 207 – 213.]
雷志栋, 杨诗秀, 谢森传. 1988. 土壤水动力学[M]. 北京:清华大学出版社. [Lei Z D, Yang S X, Xie S Z. 1988. Soil water dynamics [M]. Beijing: Tsinghua University press.]
李雪转, 樊贵盛. 2006. 土壤有机质含量对土壤入渗能力及参数影响的试验研究[J].农业工程学报, 22(3): 188 – 190.[Li X Z, Fan G S. 2006. In fl uence of organic matter content on in fi ltration capacity and parameter in fi eld soils [J].Transactions of the Chinese Society of Agricultural Engineering, 229(3): 188 – 190.]
李 卓, 吴普特, 冯 浩, 等. 2009. 容重对土壤水分入渗能力影响模拟试验[J].农业工程学报, 25(6): 40 – 45. [Li Z, Wu P T, Feng H, et al. 2009. Simulated experiment on effect of soil bulk density on soil in fi ltration capacity [J].Transactions of the Chinese Society of Agricultural Engineering, 25(6): 40 – 45.]
刘玉学, 刘 微, 吴伟祥, 等. 2009. 土壤生物质炭环境行为与环境效应[J].应用生态学报, 20(4): 977 – 982. [Liu Y X, Liu W, Wu W X, et al. 2009. Environmental behavior and effect of biomass-derived black carbon in soil [J].Chinese Journal of Applied Ecology, 20(4): 977 – 982.]
罗 凯, 陈汉平, 王贤华, 等. 2007. 生物质焦及其特性[J].可再生能源, 25(1): 17 – 19. [Luo K, Chen H P, Wang X H, et al. 2007. Characterization of bio-char and its characteristics [J].Renewable Energy Resources, 25(1):17 – 19.]
闵雷雷, 于静洁, 张广英, 等. 2010. 三种方法测估的林地稳渗率对比初探[J].南水北调与水利科技, 8(5): 36 – 38. [Min L L, Yu J J, Zhang G Y, et al. 2010. Preliminary comparison of steady in fi ltration rate in woodland by the three methods [J].South-to-North Water Transfers and Water Science & Technology, 8(5): 36 – 38.]
山 仑. 2012. 水土保持与可持续发展[J].中国科学院院刊, 27(3): 346 – 351. [Shan L. 2012. Soil and water conservation and sustainable development [J].Bulletin ofChinese Academy of Sciences, 27(3): 346 – 351.]
邵明安, 王全九, 黄明斌. 2006. 土壤物理学[M]. 北京: 高等教育出版社. [Shao M A, Wang Q J, Huang M B. 2006. Soil physics [M]. Beijing: Higher Education Press.]
谭 帅, 周蓓蓓, 王全九. 2014. 纳米碳对扰动黄绵土水分入渗过程的影响[J].土壤学报, 51(2): 263 – 269. [Tan S, Zhou B B, Wang Q J. 2014. Effect of nano-carbon on water in fi ltration process indisturbed loessal soil [J].Acta Pedologica Sinica, 51(2): 263 – 269.]
余新晓, 赵玉涛, 张志强, 等. 2003. 长江上游亚高山暗针叶林土壤水分入渗特征研究[J].应用生态学报, 14(1): 15 – 17. [Yu X X, Zhao Y T, Zhang Z Q, et al. 2003. Characteristics of soil water infiltration in sub-alpine dark coniferous ecosystem of upper reaches of Yangtze River [J].Chinese Journal of Applied Ecology, 14(1): 15 – 17.]
张文玲, 李桂花, 高卫东. 2009. 生物质炭对土壤性状和作物产量的影响[J].中国农学通报, 25(17): 153 – 157. [Zhang W L, Li G H, Gao W D. 2009. Effect of biomass charcoal on soil character and crop yield [J].Chinese Agricultural Science Bulletin, 25(17): 153 – 157.]
Atkinson C J, Fitzgerald J D, Hipps N A. 2010. Potential mechanisms for achieving agricultural benefits from biochar application to temperate soils: A review [J].Plant and Soil, 337(1/2): 1 – 18.
Chan K Y, Van Zwieten L, Meszaros I, et al. 2007. Agronomic values of greenwaste biochar as a soil amendment [J].Australian Journal of Soil Research, 45(8): 629 – 634.
Doerr S H, Shakesby R A, Walsh R P D. 2000. Soil water repellency: Its causes, characteristics and hydrogeomorphological signi fi cance [J].Earth Science Reviews, 51(1/2/3/4): 33 – 65.
Dugan E, Verhoef A, Sohi S. 2011. The effect of biochar and stover amendment on soil physical environment and plant growth [C]. UK Biochar Conference. Edinburgh: University of Edinburgh: 25 – 26.
Ghorbani D S, Homaee M, Mahdian M H, et al. 2009. Sitedependence performance of in fi ltration models [J].Water Resources Management, 23(13): 2777 – 2790.
Glaser B, Lehmann J, Zech W. 2002. Ameliorating physical and chemical properties of highly weathered soils in the tropics with charcoal: A review [J].Biology and Fertility of Soils, 35(4): 219 – 230.
Ibrahim, Hesham M, Mohammed I, et al. 2013. Effect of conocarpus biochar application on the hydraulic properties of a sandy loam soil [J].Soil Science, 178(4): 165 – 173.
Kimetu J M, Lehmann J. 2010. Stability and stabilization of biochar and green manure in soil with different organic carbon contents [J].Australian Journal of Soil Research, 48(6 / 7): 577 – 585.
Lehmann J, Gaunt J, Rondon M. 2006. Bio-char sequestration in terrestrial ecosystems—A review [J].Mitigation and Adaptation Strategies for Global Change, 11: 403 – 427.
Lehmann J, Joseph S. 2009. Biochar for environmental management: Science and technology [M]. UK and USA: Earthscan.
Lehmann J, Silva J P, Steiner C, et al. 2003. Nutrient availability and leaching in an archaeological anthrosol and a ferralsol of central amazonia: Fertilizer, and charcoal amendments [J].Plant and Soil, 249(2): 343 – 357.
Nimmo J R. 1997. Modeling structural infuences on soil water retention [J].Soil Science Society of America Journal, 61(3): 712 – 719.
Steiner C, Glaser B, Teixeira W G, et al. 2008. Nitrogen retention and plant uptake on a highly weathered central Amazonian Ferrasol amended with compost and charcoal [J].Journal of Plant Nutrition and Soil Science, 171(6): 893 – 899.
Whitman T, Lehmann J. 2009. Biochar—One way forward for soil carbon in offset mechanisms in Africa [J].Environmental Science & Policy, 12(7): 1024 – 1027.
Effects of biochar on water in fi ltration and water holding capacity of loessial soil
XIE Qian1, WANG Limei1, QI Ruipeng2, WANG Tongtong1, ZHENG Jiyong1,3
(1. College of Environment and Resources, Northwest A&F University, Yangling 712100, China; 2. Heilongjiang Beifeng Agricultural Production Means Group, Harbin 150000, China; 3. State Key Laboratory of Soil Erosion and Dryland Farming on the Loess Plateau, Institute of Soil and Water Conservation, Chinese Academy of Sciences & Ministry of Water Resources, Yangling 712100, China)
Background, aim, and scopeBiochar is a newly constructed scienti fi c term which is de fi ned as ‘‘a carbon(C)-rich and non-pollution product when biomass such as wood, manure or leaves is heated in a closed container with little or unavailable air’’. It has the properties of high internal surface area, microporosity, non-biological and biological stability. It has been widely proposed as a promising novel alternative of soil amendment to improve soil physical and chemical properties, to reduce the biological effectiveness of soil pollutant, as well as to reduce the emission of carbon dioxide and other greenhouse gases. However, to date, the effects of biochar addition on soil hydraulic properties, and the in fl uencing mechanism of biochar addition on water retention and holding capacity are still unclear.Materials and methodsEffects of biochar with two sizes (1—2 mm and ≤0.25 mm) and 4 doses (10 g·kg-1, 50 g·kg-1, 100 g·kg-1and 150 g·kg-1) on wetting front, cumulative in fi ltration and retention curves of loessial soil were explored through simulated experiments in laboratory. The loessial soil was collected from the soil surface (0—20 cm) of a fi eld without tillage in Ansai Ecological Experimental Station, Shaanxi Province innorthwest China. Experiment with biochar was charcoal-derived biochar and its carbon mass fraction was 85%.ResultsThe results showed that (1) the in fi ltration capacity was obviously decreased and water holding capacity was signi fi cantly increased compared to the control due to the biochar addition in loessial soil. When the particle size was the same and within a certain in fi ltration time period, in addition to the ≤0.25 mm treatment and the cumulative infiltration curve almost superposition under the 10 g·kg-1, 50 g·kg-1and 100 g·kg-1treatments, cumulative in fi ltration and wetting front moving rate tended to decrease with the increasing content of biochar, while water holding capacity tended to increase with the increasing content of biochar. Under the conditions of the same biochar addition dose, cumulative in fi ltration and wetting front moving rate tended to decrease with the particle size decreased within a certain in fi ltration period (40 minutes after in fi ltration start), while water holding capacity increased with the particle size decreased, but there was no signi fi cant effect on water holding capacity at the dose of 10 g·kg-1. 40 minutes after in fi ltration start, the wetting front moving rates for 1—2 mm treatment with 10 g·kg-1, 50 g·kg-1, 100 g·kg-1and 150 g·kg-1doses were decreased by 5.72%, 12.47%, 10.23% and 17.49%, respectively, compared with the control, cumulative infiltration were decreased by 11.17%, 24.48%, 22.07% and 31.10%, respectively; the wetting front moving rates of ≤0.25 mm treatment with the addition doses of 10 g·kg-1, 50 g·kg-1, 100 g·kg-1and 150 g·kg-1were decreased by 13.49%, 14.79%, 22.79% and 36.28%, respectively, compared with the control, and cumulative infiltration were decreased most by 57.93% with the dose of 150 g·kg-1. The averaged wetting front moving rate and cumulative in fi ltration were decreased by 16.69% and 27.79% in loessial soil with the comparison to the control. Overall, biochar addition reduced the water in fi ltration capacity and increased the water holding capacity for loessial soil. (2) Variation of the wetting front with time demonstrated a power function relationship, the determination coef fi cient was 0.997—0.999. Kostiakov, Philip and Horton in fi ltration model were successively used to simulation the soil water in fi ltration process and Kostiakov in fi ltration model of which determination coef fi cient was 0.989—0.998 fi tted best. (3) van Genuchten model was suitable for simulation the soil water holding process with biochar application, and the determination coef fi cient of it was 0.995—0.999.DiscussionThe results showed that the in fi ltration capacity was decreased and water holding capacity was increased with the biochar amendments to loessial soil. Biochar has high internal porosity and surface area and it creates a soil conditioning agent that can lower bulk density, increase the content of soil clay, affect pore size distribution and increase soil porosity. Therefore, it inhibited the in fi ltration capacity and improved water holding capacity of loessial soil.ConclusionsThe results showed that the loessial soil in fi ltration capacity tended to decrease with the increasing content of biochar, decreased with the particle size increased, while water holding capacity tended to increase with the increasing content of biochar, and the water holding capacity was best with the smallest particle size (≤0.25 mm) biochar addition in loessial soil. The results also showed that variation of the wetting front with time demonstrated a power function relationship, the determination coef fi cient was 0.997—0.999. Kostiakov, Philip, Horton in fi ltration model were successively used to simulation the soil water in fi ltration process and Kostiakov infiltration model fitted best. van Genuchten model was suitable for simulation the soil water holding process with biochar application.Recommendations and perspectivesThe data suggested that the use of biochar as soil amendment in loessialsoil plays an important role in increasing soil water holding capacity, and providing a scienti fi c basis for the evaluation on the in fl uence of biochar application on soil hydrology in the Loess Plateau.
loessial soil; biochar; cumulative in fi ltration; wetting front; water holding capacity
ZHENG Jiyong, E-mail: zhjy@ms.iswc.ac.cn
10.7515/JEE201601008
2015-10-12;录用日期:2015-11-10
Received Date:2015-10-12;Accepted Date:2015-11-10
国家自然科学基金项目(41571225);西北农林科技大学科研专项(2013BSJJ119,QN2013077)
Foundation Item:National Natural Science Foundation of China (41571225); Scienti fi c Research of Northwest A & F University
(2013BSJJ119, QN2013077)
郑纪勇,E-mail: zhjy@ms.iswc.ac.cn
- 地球环境学报的其它文章
- Infl uence of Tibetan Plateau uplift on dust cycle in arid and semi-arid region of Asia in winter
- 云微物理特性及云滴有效半径参数化:一次降水层状云的飞机观测资料结果
- 青藏高原下大武地区炭屑浓度所反映的环境演变与人类活动
- 浐河、灞河硝酸盐端元贡献比例
——基于硝酸盐氮、氧同位素研究 - Ozone (O3) pollution in eastern China: It’s formation and a potential air quality problem in the region
- 华北农村大气PM2.5中水溶性物质化学组成、吸湿性能及光学特征

