华北农村大气PM2.5中水溶性物质化学组成、吸湿性能及光学特征
韩艳妮,王格慧
(1.中国科学院地球环境研究所 黄土与第四纪地质国家重点实验室,西安710061;2.中国科学院大学,北京100049)
华北农村大气PM2.5中水溶性物质化学组成、吸湿性能及光学特征
韩艳妮1,2,王格慧1
(1.中国科学院地球环境研究所 黄土与第四纪地质国家重点实验室,西安710061;2.中国科学院大学,北京100049)
2013年6月10—25日在河北保定市固城镇运用大流量采样器进行每3小时1次PM2.5样品采集,对其进行有机碳(OC)、元素碳(EC)、水溶性有机碳(WSOC)、水溶性有机氮(WSON)、水溶性总氮(WSTN)、吸湿增长因子、吸光度以及无机离子分析,探讨其浓度、组成、吸湿性能与吸光性的变化特征。结果表明:采样期间固城镇PM2.5中WSON 平均浓度为5.0 ± 4.0 μg·m-3,最高浓度达15 μg·m-3;污染期WSON为6.9 ± 3.9 μg·m-3,是清洁期的四倍。整个采样期间WSON与、和呈强线性相关(R2>0.89),污染天阳阴离子当量比值F= 1.01,清洁天F= 1.45,表明污染期颗粒物酸性增强有利于气态有机胺等WSON通过酸碱中和转移到颗粒相。不同相对湿度下水溶性组分的吸湿增长因子(Gf)测量结果显示:[WSOC+WSON]/离子的比值越大,吸湿增长因子越小,表明与无机离子相比,水溶性有机物吸湿性能较低。固城夏季大气PM2.5中WSOC在365 nm波长下质量吸收效率(MAE)均值为0.52 m2·g-1,表明WSOC对PM2.5整体消光效应具有重要贡献。
PM2.5;水溶性离子;组成;吸湿性;质量吸收效率MAE
大气颗粒物通过吸收和散射太阳光降低能见度,直接影响全球能量平衡,此外,大气颗粒物通过成为云凝结核和冰核,影响云的形成和分布,从而间接影响全球气候。PM2.5是指大气中粒径小于2.5 μm的颗粒物,约占大气总颗粒物的20%—90%。卫星数据显示我国京津冀地区是全球大气PM2.5高污染地区。高浓度PM2.5导致灰霾事件频发,并呈现区域性特征。研究表明:北京周边省份的污染物传输是导致北京灰霾的重要原因之一。然而,关于PM2.5的研究大多集中在北京地区,而有关北京周边地区尤其是农村PM2.5的来源和形成机制研究还很缺乏。
水溶性物质是PM2.5的重要组成部分,占其质量的三分之一以上,可分为水溶性无机离子和水溶性有机物两部分。由于具有亲水性,PM2.5中水溶性物质可吸收空气中的水分,在颗粒物上形成水相,一方面使得颗粒物长大,增强其消光性能;另一方面也为各种气态物质在颗粒物上进一步富集和发生多相化学反应提供了媒介。因此,充分了解水溶性物质的理化特性对PM2.5的有效控制具有重要意义。
本研究以北京西南上风向农村地区夏季大气为对象,着重探讨PM2.5中水溶性物质的组成、来源、形成机制、吸湿性能和光学特征,以期为全面理解京津冀地区灰霾成因提供科学依据。
1 采样和实验
1.1 样品采集
应用Anderson大流量(1.13 m3·min-1)便携式采样器于2013年6月10—25日在河北省保定市固城镇进行采样,每3 h采集一个样品,共采集121个样品。所有样品均采用石英纤维滤膜(Whatman QM/A)收集。滤膜使用之前于马弗炉中450℃灼烧6 h以去除可能存在的有机污染物。采样后滤膜保存于-20℃冰箱中待分析。
1.2 有机碳OC和元素碳EC分析
OC、EC的分析采用DRI Model 2001热光碳分析仪,在采样滤膜上截取一定面积滤膜片,应用IMPROVEA热光反射原理分析(Chow et al,2004,2007)。
1.3 水溶性碳、氮和无机离子分析
所有样品均采用TOC-L型总有机碳分析仪(日本岛津公司)进行水溶性总碳(water-solution total carbon,WSTC)、水溶性有机碳(water-solution organic carbon,WSOC)、水溶性无机碳(watersolution inorganic carbon,WSIC)以及水溶性总氮(water-solution total nitrogen,WSTN)分析。无机离子采用(Dionex)DX-600型离子色谱仪进行分析。具体操作如下:剪取一定面积滤膜,加入50 mL超纯水(R>18.2 MΩ),超声萃取4次,每次15 min,随后经脱色摇床振荡1 h后静置。萃取后水溶液用一次性针管和0.45 μm水系过滤器(德国MEMBRANA公司生产)过滤,取28 mL萃取液用于水溶性碳、氮分析,4 mL用于无机离子分析。
水溶性有机氮(WSON)的浓度通过水溶性总氮(WSTN)与水溶性无机氮(WSIN)的差值来获得,即WSON=WSTN - WSIN。其中,WSIN由离子色谱所测的硝酸盐()、铵盐()二者之和来计算。公式如下:

1.4 颗粒物吸湿性能与光学特性分析
颗粒物吸湿性能分析的前处理步骤与无机离子相同,先剪取一定面积样品滤膜,用Mill-Q超纯水超声萃取,萃取液过滤后置于气溶胶发生器中。用美国MSP公司生产的吸湿性串联差分电迁移率分析仪(HTDMA,Hygroscopicity tandem differential mobility analyzer)在相对湿度(RH)分别为20%、40%、60%、70%、75%、80%的条件下,测量气溶胶发生器产生的100 nm干粒子的粒径增长,计算其吸湿增长因子(Gf=Dwet/Ddry)(Swietlicki et al,2008)。
气溶胶光学特性测量的前处理步骤与无机离子相同。取萃取液3 mL于比色皿中,用上海迈普达公司生产的型号为UV-6100S的紫外可见分光光度计扫描365 nm波长处样品的吸光度,并计算质量吸收效率(MAE)。质量吸收效率是吸光性物质的质量浓度与吸光度之间转换的有效参数,是一个重要的光学特征量。本研究中水溶性有机碳MAE的计算公式如下(吴一凡等,2013;闫才青等,2014; Yan et al,2015):

其中,ATNλ由紫外可见分光光度计直接测量;ATN700作为吸收基线扣除;Vw为萃取液的体积,mL;Va为颗粒物样品的采样体积,L;l为光程,m;WSOC为水溶性有机物质量浓度,μg·m-3;MAEλ指波长λ处水溶性有机物的单位质量吸光效率,m2·g-1。
2 结果与讨论
2.1 化学组成
2.1.1 采样期污染状况概述
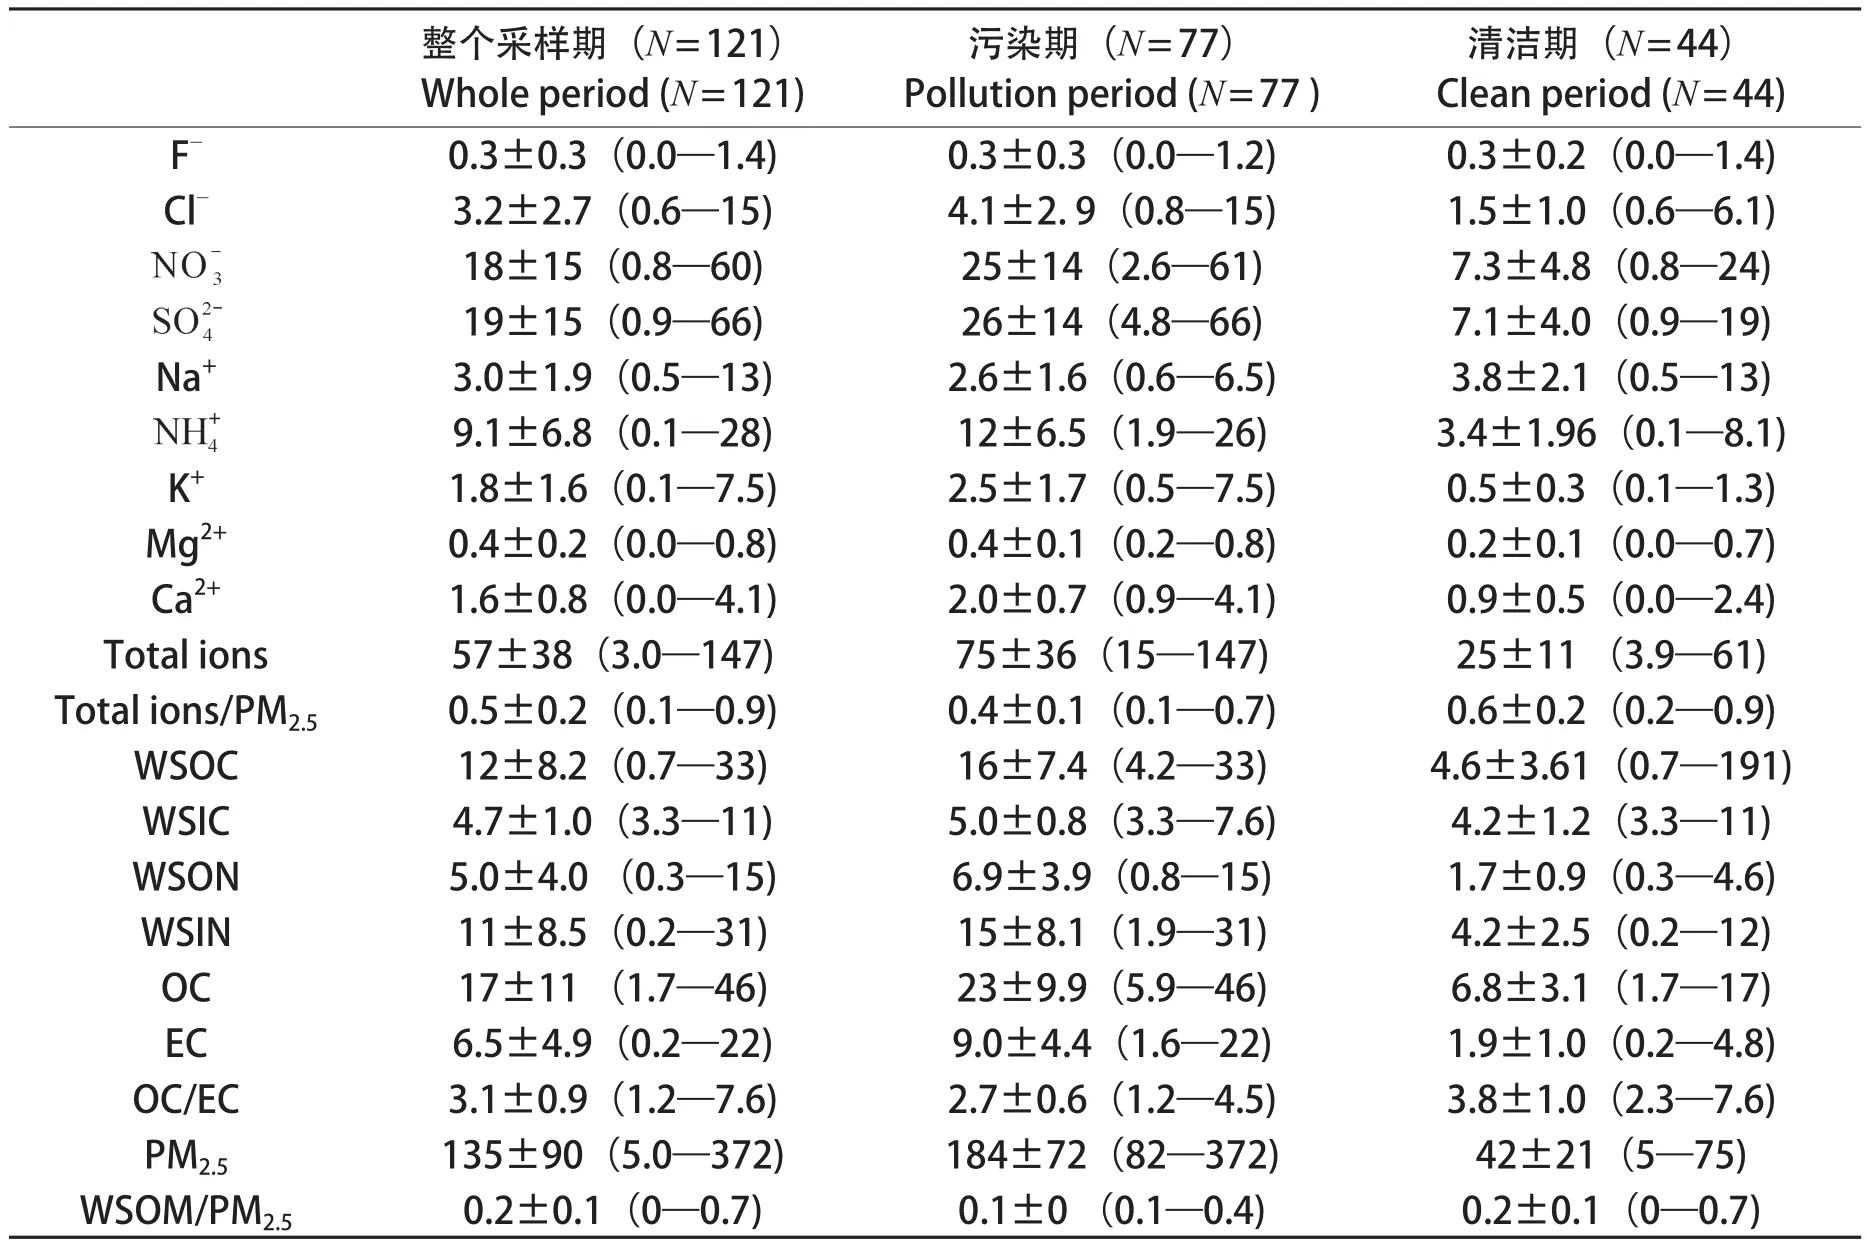
表1 2013年夏季河北固城镇PM2.5中水溶性各组分浓度(单位:μg·m-3)Tab.1 Concentrations of water-soluble species of PM2.5in Gucheng, Hebei Province during the summer of 2013 (Unit: μg·m-3)
由表1可知,2013年夏季固城镇大气中PM2.5的平均质量浓度为135 ± 90 μg·m-3(范围是5 —372 μg·m-3),约为国家环境空气质量二级标准(GB 3095—2012,75 μg·m-3)的2倍。阳离子中各离子浓度大小依次为,阴离子中各离子浓度大小依次为其中是最主要的水溶性无机离子,3小时平均质量浓度分别为18 μg·m-3、19 μg·m-3和9.1 μg·m-3,分别占总离子的29%、30%、14%。本次研究与北京(靳军莉等,2014;刀谞等,2015;黄玉虎等,2015;张大伟等,2015)、天津(刀谞等,2015)、保定(刀谞等,2015)、石家庄(靳军莉等,2014;刀谞等,2015)以及同时段固城(孟昭阳等,2015)等国内城市PM2.5以及无机离子对比见表2。
固城夏季PM2.5浓度低于同年冬季固城及石家庄的污染水平,但高于北京夏、冬两季。与2014年夏季相比,固城和的浓度均高于北京,但略低。主要来源于养殖业、农业灌溉和有机质的降解等过程产生的NH3在大气中的气固转化(Neff et al,2002;张婷等,2007;Zhang et al,2008),化肥的施用也会增加大气中NH3的含量(Zhu et al,2000)。孟昭阳等(2015)研究表明,固城站NH3主要来自农作物施肥等农业源以及牛羊的放牧活动,由于夏季温度高,土壤、动植物和垃圾中的NH3易于挥发至大气中,所以的浓度较高。统计分析结果显示:与和呈线性强相关,相关系数R2分别为0.92和0.90,与[+]摩尔比为1.0,表明上述三种离子是以NH4HSO4和NH4NO3的形式存在于大气中。由于Mg2+、Ca2+均为粉尘源,因此也呈现较强线性相关(R2= 0.68)。诸多研究表明大气细粒子中Cl-和K+主要来源于生物质燃烧,本次观测期间固城镇地区农村大气PM2.5中Cl-和K+相关系数R2= 0.44,表明生物质燃烧对华北农村大气PM2.5有一定贡献。
表2 固城与周边城市PM2.5及、、浓度比较Tab.2 Comparison of concentration of,,and PM2.5between Gucheng and other cities
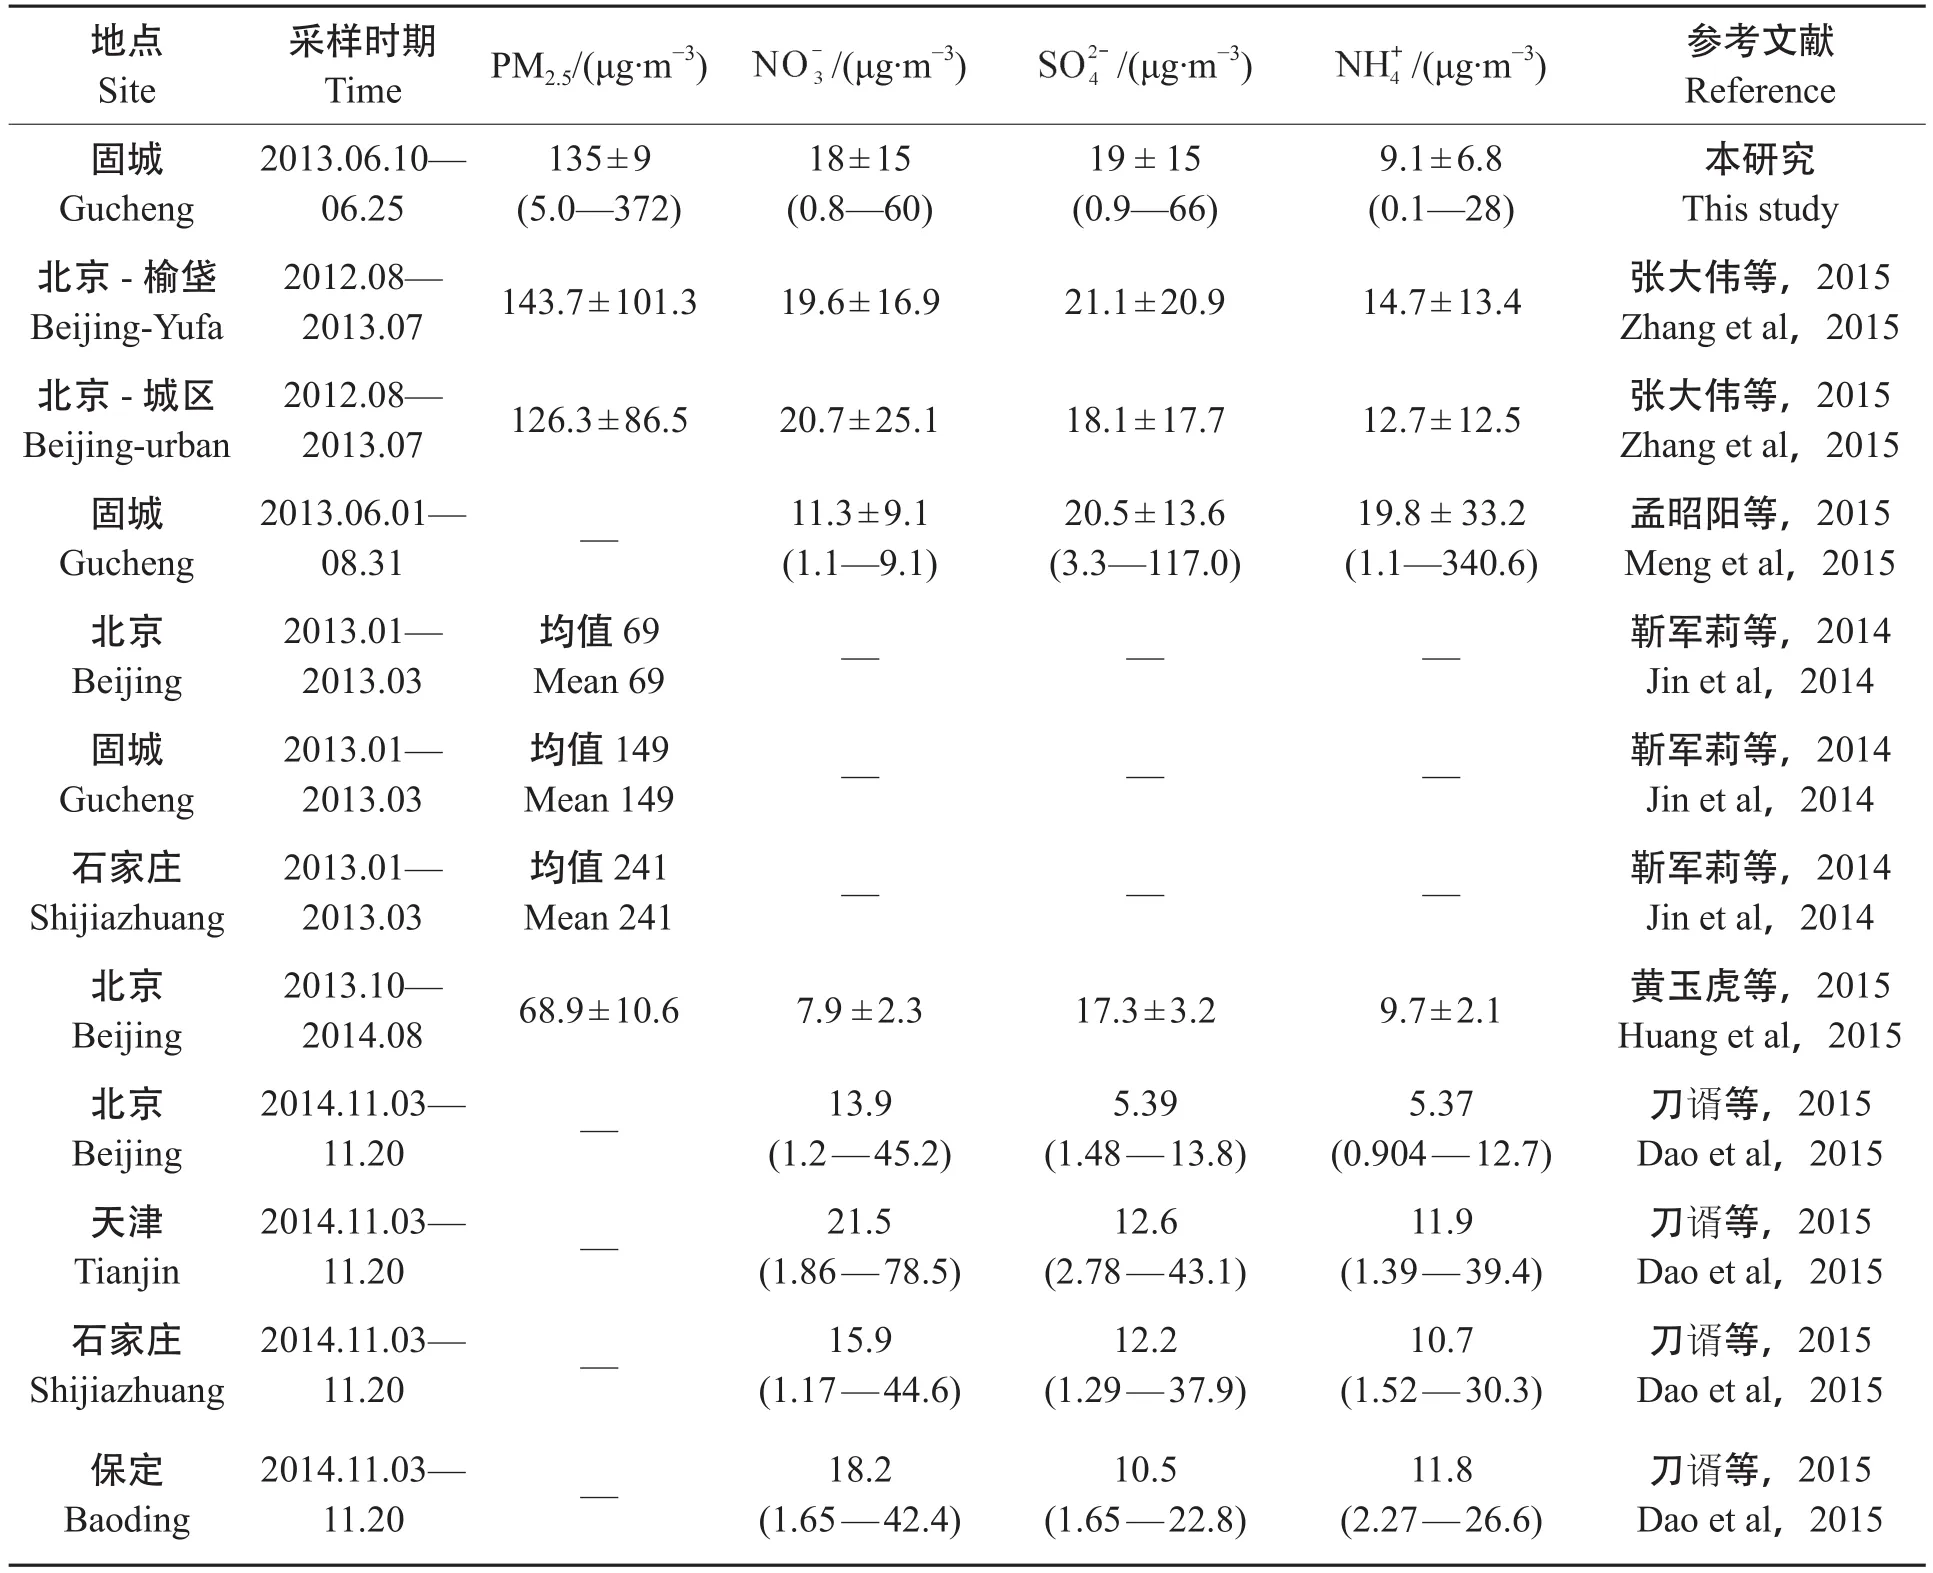
表2 固城与周边城市PM2.5及、、浓度比较Tab.2 Comparison of concentration of,,and PM2.5between Gucheng and other cities
地点Site采样时期TimePM2.5/(μg·m-3)/(μg·m-3)/(μg·m-3)本研究This study北京-榆垡Beijing-Yufa /(μg·m-3)参考文献Reference固城Gucheng 2013.06.10—06.25 135 ± 9 (5.0—372) 18 ± 15 (0.8—60) 19 ± 15 (0.9—66) 9.1 ± 6.8 (0.1—28) 2012.08—2013.07143.7 ± 101.319.6 ± 16.921.1 ± 20.914.7 ± 13.4张大伟等,2015 Zhang et al,2015北京-城区Beijing-urban 2012.08—2013.07126.3 ± 86.520.7 ± 25.118.1 ± 17.712.7 ± 12.5张大伟等,2015 Zhang et al,2015固城Gucheng孟昭阳等,2015 Meng et al,2015北京Beijing 2013.06.01—08.31—11.3 ± 9.1 (1.1—9.1) 20.5 ± 13.6 (3.3—117.0) 19.8 ± 33.2 (1.1—340.6) 2013.01—2013.03Mean 69——靳军莉等,2014 Jin et al,2014均值69固城Gucheng石家庄Shijiazhuang 2013.01—2013.03 2013.01—2013.03 Mean 149——靳军莉等,2014 Jin et al,2014均值149 Mean 241——靳军莉等,2014 Jin et al,2014均值241北京Beijing 2013.10—2014.0868.9 ± 10.67.9 ± 2.317.3 ± 3.29.7 ± 2.1黄玉虎等,2015 Huang et al,2015北京Beijing刀谞等,2015 Dao et al,2015石家庄Shijiazhuang刀谞等,2015 Dao et al,2015天津Tianjin 2014.11.03—11.20—13.9 (1.2—45.2) 5.39 (1.48—13.8) 5.37 (0.904—12.7) 2014.11.03—11.20—21.5 (1.86—78.5) 12.6 (2.78—43.1) 11.9 (1.39—39.4)刀谞等,2015 Dao et al,2015保定Baoding 2014.11.03—11.20—15.9 (1.17—44.6) 12.2 (1.29—37.9) 10.7 (1.52—30.3) 2014.11.03—11.20—18.2 (1.65—42.4) 10.5 (1.65—22.8) 11.8 (2.27—26.6)刀谞等,2015 Dao et al,2015
2013年夏季固城PM2.5中WSOC、WSIC浓度分别为12 μg·m-3、4.7 μg·m-3;WSON、WSIN分别为5.0 μg·m-3、11 μg·m-3。图1是WSON与水溶性离子、、和K+的相关分析, 从中可以看出,WSON与,,这三种离子的线性关系较强(R2> 0.89),与的相关系数最高(R2= 0.98)。WSON主要包括类似的小分子量有机胺(Ge et al,2011),比如甲胺、二甲胺、乙胺、二乙胺等,它们都是挥发性碱性气体,与氨气理化性质近似,易与和发生酸碱中和反应。另外,分析还发现WSOC与K+有很好的相关性(R2= 0.73),进一步证明生物质燃烧是该区域PM2.5的重要来源。
2.1.2 污染期与清洁期比较
图2为2013年夏季固城采样期间PM2.5质量浓度、WSOC、WSON的时间变化序列。我国国家环境空气质量标准(GB 3095—2012)规定的PM2.5质量浓度日均值二级标准是75 μg·m-3,据此我们将采样期间PM2.5浓度大于75 μg·m-3的时段定义为污染期,小于75 μg·m-3的时段定义为清洁期。2013年夏季固城PM2.5污染期和清洁期3 h平均质量浓度分别为184 ± 72 μg·m-3和42 ± 21 μg·m-3,污染期PM2.5质量浓度约为清洁期的4.4倍。
大气颗粒物的酸碱性一般用中和度(F)来定义,它是指阳离子与阴离子的比值:若F>1,说明阳离子多于阴离子,多余的阳离子未被中和,即颗粒物呈碱性;同理,若F<1,则说明颗粒物呈酸性。

图1 采样期间大气PM2.5中WSON与、、、K+相关性Fig.1 Linear fit regression of WSON with,,, and K+
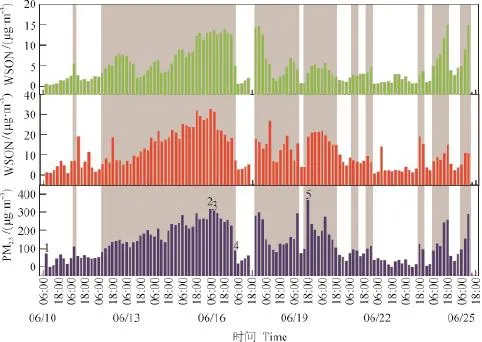
图2 水溶性有机氮、水溶性有机碳以及PM2.5时间变化序列(阴影部分为污染期,PM2.5>75 μg·m-3;其余为清洁期,PM2.5<75 μg·m-3)Fig.2 Temporal variations of WSON, WSOC and PM2.5(The time with PM2.5>75 μg·m-3is de fi ned as polluted period and marked in grey color)
阴阳离子当量浓度根据以下公式计算:

经分析可知,整个采样期中和度F均值为1.17,其中清洁期为1.45,污染期为1.01。相关分析表明WSON与中和度(F)呈负相关(R2= 0.3),这是因为大气中有机胺等气态水溶性含氮有机物可与颗粒相中酸性物质发生酸碱中和反应,使气态类物质转移至颗粒相中,并且较高的湿度、较低的温度和静风等气象条件有利酸碱中和反应,促进气固相之间的转化从而生成更多的WSON(程玉婷等,2014)。图3显示,清洁期和污染期都是阳离子当量浓度小于阴离子当量浓度,且污染期阳离子当量浓度缺失的比例更大,即污染期颗粒物酸性强于清洁期。图4为污染期与清洁期九种离子的摩尔百分比,其中清洁期阳离子当量浓度占总离子当量浓度的61%,而污染期阳离子当量浓度之占总离子当量浓度的53%。与清洁期相比,摩尔比重上升10个百分点,、比重下降。在清洁天风力较大,Na+、Ca2+、Mg2+三种离子的浓度较高约占到30%,污染期由于静风等气象因素,粉尘粒子易于干沉降,因此Na+、Ca2+、Mg2+三种离子总和只占到10%。K+作为生物质燃烧的标志物,并无明显变化。
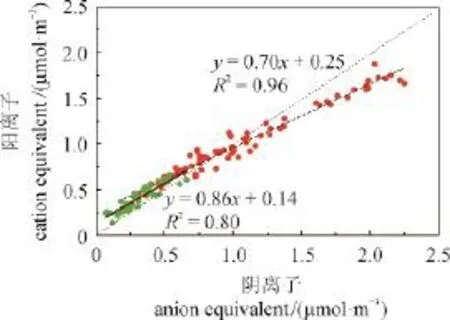
图3 污染期(红点)与清洁期(绿点)阴阳离子平衡Fig.3 Correlations between cations and antions during pollution and clean periods
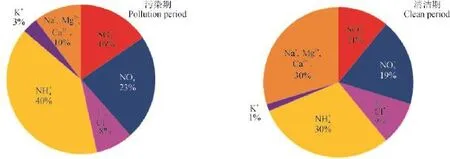
图4 污染期与清洁期阴阳离子摩尔百分比Fig. 4 Molar ratios of inorganic ions during polluted and clean periods
从表1中可看出,污染时段WSOC、WSON的浓度分别为16 ± 7.4 μg·m-3和6.9 ± 4.0 μg·m-3,分别是清洁时段浓度的3.4倍和4.0倍;WSIN污染期浓度是清洁期浓度的3.6倍;WSON/WSOC的比值从污染期的0.44降到清洁天的0.38,这和程玉婷等(2014)研究结果相一致,表明污染时段酸性气溶胶更利于WSON的生成。
2.2 吸湿性能与光学特性
根据WSOC浓度以及气象条件,我们选取五个典型样品(已在图1中标出)进行吸湿增长因子和光学特性的测定。其中,Sample 1和Sample 2是WSOC浓度最小和最大的两个样品;Sample 3和Sample 4,为典型清洁期样品,Sample 5是PM2.5浓度最高的样品(见表3)。

表3 2013年夏季固城PM2.5典型样品的物质组成和吸湿增长因子(Gf)Tab.3 Composition and hygroscopic growth factor (Gf) of selected PM2.5samples in Gucheng
2.2.1 吸湿性能
相同粒径颗粒物从大气环境中吸收水份而长大的能力取决于其化学组成。叶兴南和陈建民(2013)、王宗爽等(2013)、刘新罡和张远航(2010)、王轩等(2011)的研究表明,可溶性无机盐对气溶胶吸湿增长的贡献最大,粒径为100 nm的硫酸铵、硝酸铵和氯化钠在各自的潮解点的吸湿增长因子分别为1.46、1.23和1.88。黄耀等(2015)的研究表明沙尘粒子由于其本身含有一定量的水溶性无机盐,因此沙尘粒子也具有一定吸湿性。此外,有研究表明:有机物对气溶胶吸湿增长也有一定贡献(Svenningsson and Rissler,2006)。
图5为上述典型样品不同相对湿度下的吸湿增长因子变化趋势。从中可以看出:随着相对湿度(RH)升高,吸湿增长因子(Gf)越来越大。水溶性有机碳、水溶性有机氮之和与离子总量比值([WSOC+WSON]/[total ions])越大,增长因子越小,这与有机物吸湿性能较低相符。相对湿度(RH)为80%时,吸湿增长因子与离子总量和水溶性碳、氮的比值之间呈强相关(R2= 0.98),进一步表明:对颗粒物的吸湿性起主要作用的是无机离子。在相对湿度为80%时,Sample 1至Sample 5的吸湿增长因子分别为1.42、1.31、1.29、1.37和1.24。在这5个典型样品中,Sample 1处于清洁期,无机离子与水溶性有机物的比值最大,吸湿增长因子也高于污染期的其他4个样品。近几年灰霾席卷我国众多城市,有研究表明在灰霾期间硫酸盐、硝酸盐和铵盐等无机盐暴增,加上灰霾期湿度相对较高,促进了灰霾颗粒在高湿条件下的吸湿增长,体积的增长会加强颗粒物的消光作用,进一步降低了大气能见度。
2.2.2 光学特性
“棕色碳”是指能够在波长为200 —550 nm的紫外—近可见光波段吸收光的有机碳,被学者广泛研究的多为小于400 nm波段(Zhang et al,2011;Hoffer et al,2006;Liu et al,2013),为排除硝酸盐等其他吸光性物质的干扰,较多选择λ= 365 nm处的光吸收作为棕色碳的表征(闫才青等,2014)。运用1.4中公式,经计算,本研究观测期间5个典型样品的WSOC在365 nm下的MAE值分别为0.55 m2·g-1、0.61 m2·g-1、0.50 m2·g-1、0.41 m2·g-1和0.54 m2·g-1。为进一步了解固城采样点PM2.5的吸光特性,表4比较了国内外不同地区大气PM2.5的MAE 值。
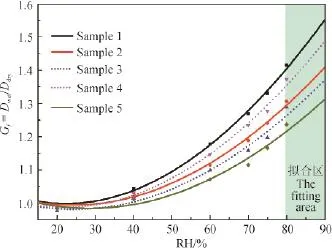
图5 固城典型样品吸湿性Fig.5 Hygroscopic growth factor (Gf) of PM2.5aerosols collected from Gucheng, a rural site near Beijing
通过比较,我们发现:就季节与地区来说,MAE普遍表现出冬季大于夏季,城市MAE值大于乡村(见表4)。此外,从表4还可以看出:北京和固城水溶性棕色碳的吸光能力强于美国、韩国的城市和乡村。例如:本研究中固城WSOC的MAE值0.52 ± 0.06 m2·g-1大于同期美国乡村所测得MAE值,小于2009年夏季在北京所测的MAE值,更小于北京冬季观测到的MAE值,这可能与冬季化石燃料燃烧排放增强相关,因为化石燃料源产生的WSOC中富含吸光性不饱和C = C键化合物。Cheng et al(2011)与Du et al(2014)研究表明柴油车排放的棕色碳的MAE大于来自生物质燃烧棕碳的MAE值,Zhang et al(2011)研究表明人为源棕色碳的吸光能力强于天然源棕色碳。上述不同地区和季节MAE比较,表明:我国城市大气中富含吸光性棕碳、特别是冬季取暖燃煤产生的棕碳相对增加导致城市冬季MAE最高。
3 结论
(1) 2013年夏季固城镇大气中PM2.5的3 h浓度水平在5—372 μg·m-3,平均为135 ± 90 μg·m-3,约为国家环境空气质量二级标准(GB 3095—2012,75 μg·m-3)的2倍;、和是最主要的水溶性无机离子,三者占总离子浓度的百分比依次为29%、30%、14%,共计约74%;水溶性有机物约占PM2.5质量浓度的20%。
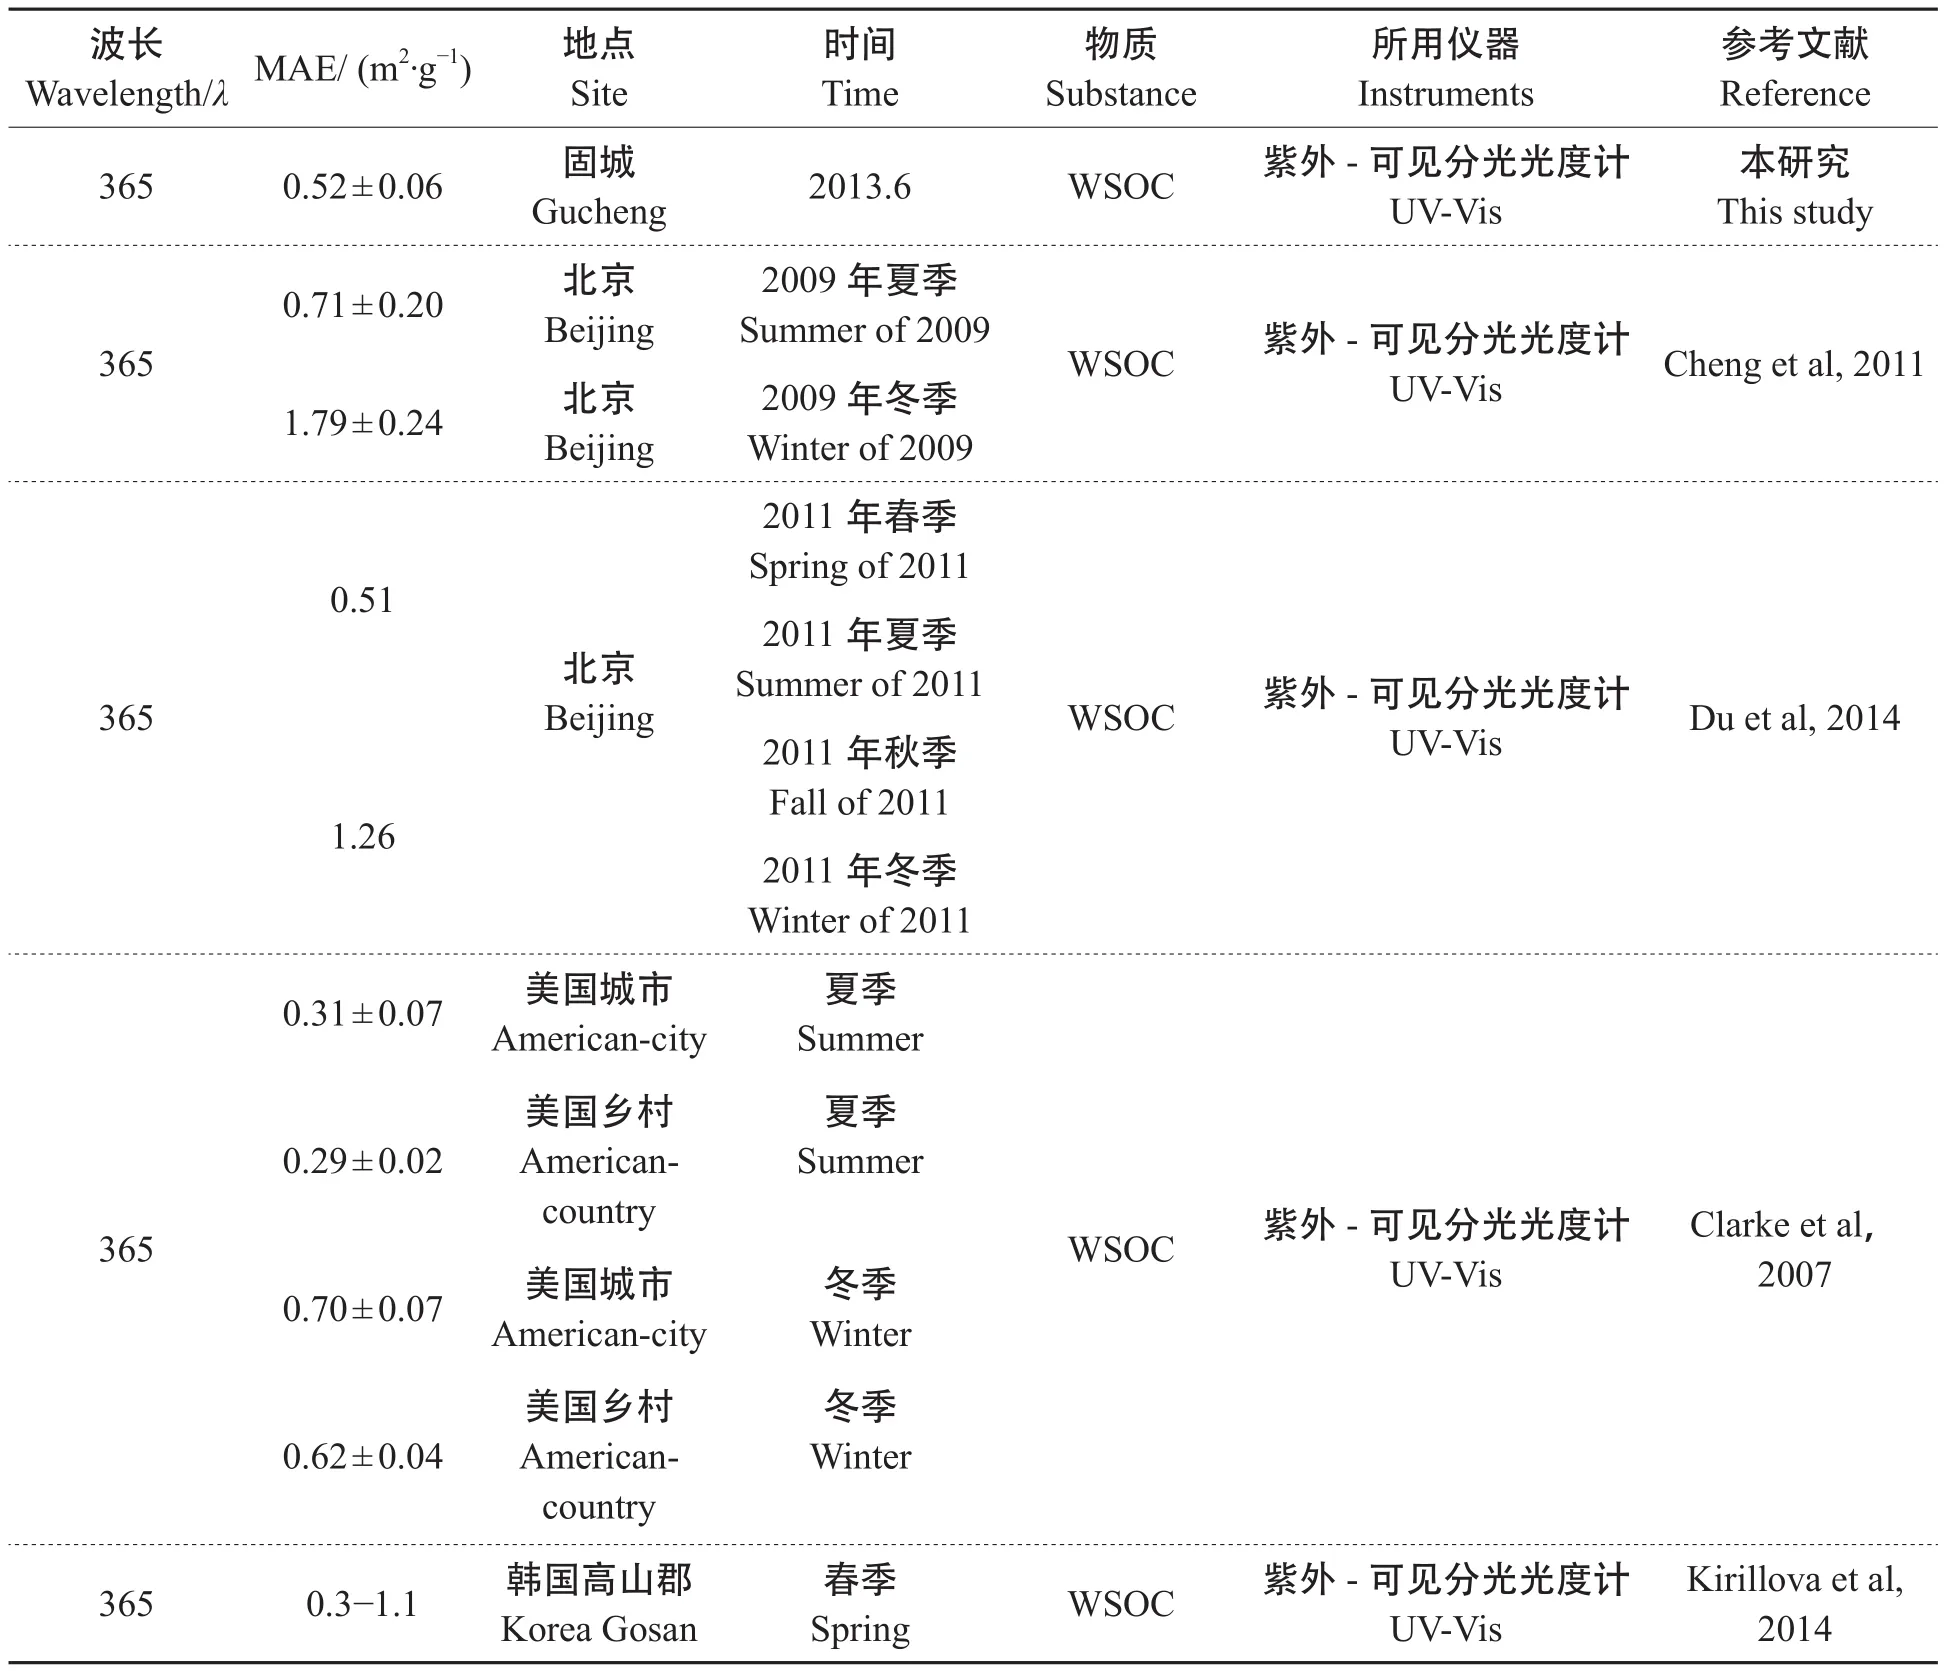
表4 不同研究中获得的MAE值Tab.4 Comparison of MAE measured at Gucheng site with those at other sites around the world
(3) 固城典型样品的吸湿特性和光学特性分析表明:污染期PM2.5中无机离子含量显著增加,随着湿度增加,灰霾粒子吸湿增长,消光能力增强,进一步降低了大气能见度。
(4) 固城PM2.5中WSOC的光吸收效率均值为0.52 m2·g-1,高于美国、韩国等地区。与国内外对比发现:WSOC的光吸收效率普遍表现出:城市大于乡村,冬季高于夏季。这是因为与自然源WSOC 相比,人为源产生的WSOC中富含吸光性不饱和键化合物。
程玉婷, 王格慧, 孙 涛, 等. 2014. 西安冬季非灰霾天与灰霾天PM2.5中水溶性有机氮污染特征比较[J].环境科学, 35(7): 2468 – 2476. [Cheng Y T, Wang G H, Sun T, et al. 2014. Characteristics of water-soluble organic nitrogen of PM2.5in Xi’an during wintertime non-haze and haze periods [J].Environmental Science, 35(7): 2468-2476.]
刀 谞, 朱红霞, 谭 丽, 等. 2015. 2014年APEC期间北京及周边重点城市PM2.5中水溶性离子变化特征[J].环境化学, 34(8): 1389 – 1395. [Dao X, Zhu H X, Tan L, et al. 2015. Variaations of PM2.5and its water soluble ions in Beijing and surrounding cities during the APEC in 2014 [J].Environmental Chemistry, 34(8): 1389 – 1395.]
黄 耀, 王格慧, 韩艳妮, 等. 2015. 沙尘暴期西安大气颗粒物化学组成及吸湿性能小时变化特征[J].地球环境学报, 6(1): 44 – 53. [Huang Y, Wang G H, Han Y N, et al. 2015. Hourly characteristic of chemical composition and hygroscopic property of TSP in Xi’an during dust storm [J].Journal of Earth Environment, 6(1): 44 – 53.]
黄玉虎, 李 媚, 曲 松, 等. 2015. 北京城区PM2.5不同组分构成特征及其对大气消光系数的贡献[J].环境科学研究, 28(8): 1193 – 1199. [Huang Y H, Li M, Qu S, et al. 2015. Characteristics of different components of PM2.5and contribution to ambient light extinction coef fi cient in Beijing [J].Research of Environmental Sciences, 28(8): 1193 – 1199.]
靳军莉, 颜 鹏, 马志强, 等. 2014. 北京及周边地区2013年1—3月PM2.5变化特征[J].应用气象学报, 25(6): 690-700. [Jin J L, Yan P, Ma Z Q, et al. 2014. Characteristics of PM2.5in Beijing and Surrounding Areas from January to March in 2013 [J].Journal of Applied Meteorological Science, 25(6): 690 – 700.]
刘新罡, 张远航. 2010. 大气气溶胶吸湿性质国内外研究进展[J].气候与环境研究, 15(6): 808 – 816. [Liu X G, Zhang Y H. 2010. Advances in research on aerosol hygroscopic properties at home and abroad [J].Climatic and Environmental Research, 15(6): 808 – 816.]
孟昭阳, 谢育林, 贾诗卉, 等. 2015. 2013年夏季华北乡村站点固城大气氨变化特征[J].应用气象学报, 26(2): 141 – 150. [Meng Z Y, Xie Y L, Jia S H, et al. 2015. Characteristics of atmospheric ammonia at Gucheng, a rural site on North China Plain in summer of 2013 [J].Journal of Applied Meteorological Science, 28(8): 1186 – 1192.]
王 轩, 陈建华, 陈建明, 等. 2011. 实验室发生纳米气溶胶吸湿性表征[J].环境科学研究, 24(6): 621 – 631. [Wang X, Chen J H, Chen J M, et al. 2011. Characterization of hygroscopic properties of laboratory-generated nanometer aerosol [J].Research of Environmental Science, 24(6): 621 – 631.]
王宗爽, 付 晓, 王占山, 等. 2013. 大气颗粒物吸湿性研究[J].环境科学研究, 26(4): 341 – 349. [Wang Z S, Fu X, Wang Z S, et al. 2013. Research progress of the hygroscopicity of atmospheric particles [J].Research of Environmental Sciences, 26(4): 341 – 349.]
吴一凡, 黄晓峰, 兰紫鹃, 等. 2013. PM2.5中水溶性有机物吸光特性的模拟研究[J].中国环境科学, 33(10): 1736 – 1740. [Wu Y F, Huang X F, Lan Z J, et al. 2013. Simulation study of light absorption characteristics of water-soluble organic matter in PM2.5[J].China Environmental Science, 33(10): 1736 – 1740.]
闫才青, 郑 玫, 张远航. 2014. 大气棕色碳的研究进展与方向[J].环境科学, 35(11): 4404 – 4414. [Yan C Q, Zheng M, Zhang Y H. 2014. Research progress and direction of atmospheric brown carbon [J].Environmental Science, 35(11): 4404 – 4414.]
叶兴南, 陈建民. 2013. 灰霾与颗粒物吸湿增长[J].自然杂志, 35(5): 337 – 341. [Ye X N, Chen J M. 2013. Haze and hygroscopic growth [J].Chinese Journal of Nature, 35(5): 337 – 341.]
张 婷, 曹军冀, 吴 枫, 等. 2007. 西安春夏季气体及PM2.5中水溶性组分的污染特征[J].中国科学院研究生院学报, 24(5): 641 – 647. [Zhang T, Cao J J, Wu F, et al. 2007. Characterization of gases and water soluble ion of PM2.5during spring and summer of 2006 in Xi'an [J].Journal of the Graduate University of the Chinese Academy of Sciences, 24(5): 641 – 647.]
张大伟, 王小菊, 刘保献, 等. 2015. 北京城区大气PM2.5主要化学组分以及污染特征[J].环境科学研究, 28(8): 1186 – 1192. [Zhang D W, Wang X J, Liu B X, et al. 2015. Characteristics of PM2.5and its chemical composition in the urban area of Beijing [J].Research of Environmental Sciences, 28(8): 1186 – 1192.]
Cao J J, Wu F, Chow J C, et al. 2005. Characterization and source apportionment of atmospheric organic and element carbon during fall and winter of 2003 in Xi’an, China [J].Atmospheric Chemistry and Physics, 5: 3127 – 3137.
Cheng Y, He K B, Zheng M, et al. 2011. Mass absorption ef fi ciency of elemental carbon and water-soluble organic carbon in Beijing, China [J].Atmospheric Chemistry and Physics, 11: 11497 – 11510.
Chow J C, Watson J G, Chen L W A, et al. 2004. Equivalence of element carbon by thermal/optical reflectance and transmittance with different temperature protocols [J].Environmental Science & Technology, 38(16): 4414 – 4422.
Chow J C, Watson J G, Chen L W A, et al. 2007. The IMPROVE-A temperature protocol for thermal/optical carbon analysis: maintaining consistency with a long-term database [J].Journal of the Air & Waste Management Association, 57(9): 1014 – 1023.
Clarke A, McNaughton C, Kapustin V, et al. 2007. Biomass burning and pollution aerosol over North America:Organic components and their influence on spectral optical properties and humidification response [J].Journal of Geophysical Research, 112, D12818, doi: 10.1029/2006JD007777.
Du Z Y, He K B, Cheng Y, et al. 2014. A yearlong study of watersoluble organic carbon in Beijing Ⅱ: Light absorption properties [J].Atmospheric Environment, 89: 235 – 241.
Ge X L, Wexler A S, Clegg S L. 2011. Atmospheric amines—PartⅠ. A review [J].Atmospheric Environment, 45: 524 – 546.
Hoffer A, Gelencser A, Guyon P, et al. 2006. Optical properties of humic-like substance(HULIS) in biomass-burning aerosols [J].Atmospheric Chemistry and Physics, 6(11): 3563 – 3570.
Kirillova E N, Andersson A, Han J, et al. 2014. Sources and light absorption of water-soluble organic carbon aerosols in the outflow from northern China [J].Atmospheric Chemistry and Physics, 14(3): 1413 – 1422.
Liu J, Bergin M, Guo H, et al. 2013. Size-resolved measurements of brown carbon in water and methanol extracts and estimates of their contribution to ambient fine-particle light absorption [J].Atmospheric Chemistry and Physics, 13(24): 12389 – 12404.
Neff J C, Holland E A, Dentener F J, et al. 2002. The origin, composition and rates of organic nitrogen deposition: A missing piece of the nitrogen cycle [J].Biogeochemistry, 57(1): 99 – 136.
Svenningsson B, Rissler J. 2006. Hygroscopic growth and critical supersaturations for mixed aerosol particles of inorganic and organic compounds of atmospheric relevance [J].Atmospheric Chemistry and Physics, 6: 1937 – 1952.
Swietlicki E, Hansson H C, Svenningsson B, et al. 2008. Hygroscopic properties of submicrometer atmospheric aerosol particles measured with H-TDMA instruments in various environments-a review [J].Tellus, 60B: 432 – 469
Turpin B J, Lim H J. 2001. Species contributions to PM2.5mass concentrations: revisiting common assumptions for estimating organic mass [J].Aerosol Science and Technology, 35: 602 – 610.
Yan C Q, Zheng M, Sullivan A P, et al. 2015. Chemical characteristics and light-absorbing property of watersoluble organic carbon in Beijing: Biomass buring contributions [J].Atmospheric Environment, 121: 4 – 12.
Zhang X L, Lin Y H, Surratt J D, et al. 2011. Light-absorbing soluble organic aerosol in Los Atlanta: A Contrast in secondary organic aerosol [J].Geophysical Research Letters, 38, L21810, doi: 10.1029/2011GL049385.
Zhang Y, Zheng L, Liu X, et al. 2008. Evidence for organic N deposition and its anthropogenic sources in China [J].Atmospheric Environment, 42(5): 1035 – 1041.
Zhu T, Pattey E, Desjardins R L. 2000. Relaxed eddyaccumulation technique for measuring ammonia volatilization [J].Environmental Science & Technology, 34(1): 199 – 203.
Composition, hygroscopicity and light absorption of water-soluble fraction of PM2.5at a rural site near Beijing
HAN Yanni1,2, WANG Gehui1
(1. State Key Laboratory of Loess and Quaternary Geology, Institute of Earth Environment, Chinese Academy of Sciences, Xi’an 710061, China; 2. University of Chinese Academy of Sciences, Beijing 100049, China)
Background, aim, and scopeHaze episodes have frequently occurred in North China Plain (NCP) due to rapid increases in vehicle numbers and fossil fuel consumption. Beijing is the largest megacity in NCP and has experienced severe air pollution. Previous studies indicate that the transportation of fi ne particulates from NCP is an important source to haze formation in Beijing. Many researches about PM2.5have focused on Beijing urban aerosols, while the information about the physical-chemical properties of aerosols from Beijing surrounding regions especially the rural areas is very limited. Hygroscopicity is one of the key factors affecting the behavior of an aerosol in the atmosphere, because by water vapor uptake aerosol may signi fi cantly alter its physical-chemical properties such as light scattering and absorbing, transportation, gasparticle phase partitioning and aqueous reaction. This paper aims to investigate the chemical composition,hygroscopic growth factor and optical absorption ef fi ciency of fi ne particles at Gucheng, a rural site with a distance of about 100 km southwest to Beijing.Materials and methods121 PM2.5samples were collected during June 10th—25th 2013 at Gucheng, Hebei Province by using high-volume sampler (1.13 m3·min-1) with a 3 h interval. The samples were measured for element carbon (EC), organic carbon (OC), watersoluble organic carbon (WSOC) and water-soluble organic nitrogen (WSON), inorganic ions, hygroscopic growth factor (Gf) and optical mass absorption efficiency (MAE) at 365 nm light wavelength.ResultsDuring sampling period PM2.5ranged from 5.0 μg·m-3to 372 μg·m-3with an average of 135 μg·m-3, which was about two times the national air quality secondary standard (GB 3095—2012, 75 μg·m-3). During the sampling period,andwere the dominant inorganic ions, accounting for 29%, 30%, 14% of the total inorganic ions, respectively. The average concentration of WSON was 5.0 ± 4.0 μg·m-3with a maximum of 15 μg·m-3during the whole campaign and four times higher in polluted periods (6.9 ± 3.9 μg·m-3) than in the clean periods (1.7 ± 0.9 μg·m-3). In the whole sampling period WSON well correlated with,and(R2> 0.89), and enahced with an increase in the equivalent ratio of cations to anions from 1.01 in the polluted periods to 1.45 in the clean periods, suggesting that acidity of PM2.5was favorable for the gas-to-particle partitioning of WSON species such as low molecular weight amines. Hygroscopic growth factors (Gf) of the water-soluble fraction of the PM2.5samples were measured by hygroscopic tandem differential mobility analyzer (HTDMA). The results showed thatGfnegatively correlated with the mass ratio of (WSOC + WSON) to (inorganic ions), indicating that water-soluble organic compounds were less hygroscopic in comparison with inorganic ions. Mass absorption ef fi ciency (MAE) of WSOC at the Gucheng site was 0.52 m2·g-1, higher than that in the United States, South Korea and other regions.DiscussionBy comparison the concentrations of,,, and PM2.5from the Gucheng site with those from other cities, we found that Cl-and K+at Gucheng site mainly derived from biomass burning. A comparison of MAE values measured in this study with those in the literature suggests that the values of MAE of WSOC are generally greater in cities than in rural regions and higher in winter than summer. Moreover, the Gucheng MAE values, together with others reported, showed that MAE was higher for Chinese aerosols those for any other countries, suggesting the importance of anthropogenic WSOC in China.ConclusionsHigh-volume PM2.5samples were collected during June 10th—25th 2013 at Gucheng, a rural site near Beijing, and determined for chemical composition including inorganic ions, organic carbon, elemental carbon, water-soluble organic carbon and water-soluble organic nitrogen, hygroscopic growth factor, and light absorption to investigate the sources, formation mechanisms, hygroscopicity and optical properties of PM2.5in NCP. During the whole period,andwere dominant inorganic ions, and acidity of aerosols was stronger in pollution period than clean period which was favorable for the gas-to-particle partitioning of low molecular weight amines. Hygroscopicity analysis showed thatGfof the samples was largely determined by its water-soluble inorganic fraction. MAE was higher in Gucheng than in other cities because of the consumption of coal in winter.Recommendationsand perspectivesIn current work sources, hygroscopic and optical properties of PM2.5were investigated in rural area near Beijing. Water-soluble organic compounds constitute an important fraction of the rural fine particles, and have been found to be light absorbing in UV-visible wavelength range. Details in molecular compositions of the water-soluble organic compounds are needed for explaining the haze formation in China.
PM2.5; water-soluble matter; composition; hygroscopicity; mass absorption ef fi ciency (MAE)
WANG Gehui, E-mail: wanggh@ieecas.cn
10.7515/JEE201601006
2015-11-23;录用日期:2016-01-21
Received Date:2015-11-23;Accepted Date:2016-01-21
国家杰出青年科学基金项目(41325014)
Foundation Item:National Science Fund for Distinguished Young Scholars (41325014)
王格慧,E-mail: wanggh@ieecas.cn
--先进无机材料论坛例记(Ⅰ)
- 地球环境学报的其它文章
- Infl uence of Tibetan Plateau uplift on dust cycle in arid and semi-arid region of Asia in winter
- 云微物理特性及云滴有效半径参数化:一次降水层状云的飞机观测资料结果
- 青藏高原下大武地区炭屑浓度所反映的环境演变与人类活动
- 浐河、灞河硝酸盐端元贡献比例
——基于硝酸盐氮、氧同位素研究 - Ozone (O3) pollution in eastern China: It’s formation and a potential air quality problem in the region
- 华中地区某县农田土壤黑碳分布特征及来源解析

