Thermal stability and hydration behavior of ritonavir sulfate:A vibrational spectroscopic approach☆
Kaweri Gambhir,Parul Singh,Deepak K.Jangir,Ranjana Mehrotra
Quantum Optics and Photon Physics,CSIR-National Physical Laboratory,Dr.K.S.Krishnan Marg,New Delhi 110012,India
Original Article
Thermal stability and hydration behavior of ritonavir sulfate:A vibrational spectroscopic approach☆
Kaweri Gambhir1,Parul Singh1,Deepak K.Jangir,Ranjana Mehrotra*
Quantum Optics and Photon Physics,CSIR-National Physical Laboratory,Dr.K.S.Krishnan Marg,New Delhi 110012,India
A R T I c L E I N F o
Article history:
25 April 2015
Accepted 5 May 2015
Available online 23 May 2015
Ritonavir sulfate Diffuse re fl ectance infrared Fourier transform spectroscopy Raman spectroscopy Thermal degradation Hydration
Ritonavir sulfate is a protease inhibitor widely used in the treatment of acquired immunode fi ciency syndrome.In order to elucidate the inherentstability and sensitivity characteristics ofritonavir sulfate,it was investigated under forced thermal and hydration stress conditions as recommended by the International Conference on Harmonization guidelines.In addition,competency of vibrational(infrared and Raman)spectroscopy was assessed to identify structuralchanges of the drug symbolizing its stress degradation.High performance liquid chromatography was used as a con fi rmatory technique for both thermal and hydration stress study,while thermogravimetric analysis/differential thermal analysis and atomic force microscopy substantiated the implementation of vibrational spectroscopy in this framework.The results exhibited high thermal stability of the drug as signi fi cant variations were observed in the diffuse re fl ectance infrared Fourier transform spectra only after the drug exposure to thermal radiations at 100°C.Hydration behavior of ritonavir sulfate was evaluated using Raman spectroscopy and the value of critical relative humidity was found to be>67%.An important aspect of this study was to utilize vibrational spectroscopic technique to address stability issues of pharmacological molecules,not only for their processing in pharmaceutical industry,but also for predicting their shelf lives and suitable storage conditions.
©2015 Xi'an Jiaotong University.Production and hosting by Elsevier B.V.All rights reserved.This is an open access article under the CC BY-NC-ND license(http://creativecommons.org/licenses/by-nc-nd/4.0/).
1.Introduction
Inhibition of human immunode fi ciency virus(HIV)protease has been recognized as an important approach for therapeutic intervention ofacquired immunode fi ciency syndrome(AIDS)[1].Protease inhibitors are the drugs which play an instrumental role in the reduction of morbidity and mortality among people with HIV infection [2,3].Amongst the family of protease inhibitors,ritonavir sulfate has revolutionized HIV therapy due to its selective,competitive and reversible inhibitory effects on both HIV-1 and HIV-2 proteases [4].Ritonavir,{[5S-(5R*,8R*,10R*,11R*)]-10-hydroxy-2-methyl-5-(1-methylethyl)-1-[2-(1-methylethyl)-4-thiazolyl]-3,6-dioxo-8,11-bis
(phenylmethyl)-2,4,7,12-tetraazatridecan-13-oic acid,5-thiazolylmethyl ester}(Fig.1),is a synthetic organic compound derived from N-carbamoyl-alpha amino acids and their derivatives.
The stability of pharmaceutical molecules is a matter of great concern as it affects the safety and ef fi cacy of the drug product. Therefore,the International Conference on Harmonization(ICH) Q1A guideline entitled“Stability testing of new drug substances and products”requires stress testing to be carried out in order to elucidate the inherent stability and sensitivity characteristics of the active substance[5].However,literature supports limited analytical methods established for the stability studies of the solid dosage form of ritonavir sulfate.While high performance thin layer chromatography(HPTLC)has been used for simultaneous determination of ritonavir and lopinavir in capsules[6].A few liquid chromatography–mass spectroscopy(LC–MS)methods have been reported for analysis of ritonavir and its metabolites in biological fl uids[7–10].International Pharmacopoeia(Ph.Int.) describes a liquid chromatography method to separate ritonavir and its impurities[4].Determination of ritonavir in bulk dosage form using spectrophotometric and potentiometric methods has also been described[11–15].In recent years,several high performance liquid chromatography(HPLC)methods for simultaneous determination of antiretroviral drugs in plasma have been demonstrated[16,17].Nevertheless,HPLC has been widely used for the stress degradation study of pharmaceuticals,it has some disadvantages in terms of cost performance,time consumption and necessary equipment,such as the use of expensive disposable cartridges at solid-phase drug extraction,gradient elution control by a gradient HPLC pump system and the ultraviolet detection at multiple wavelengths.Therefore,in the present scenario,a simpli fi ed technique is desirable for addressing these issues.
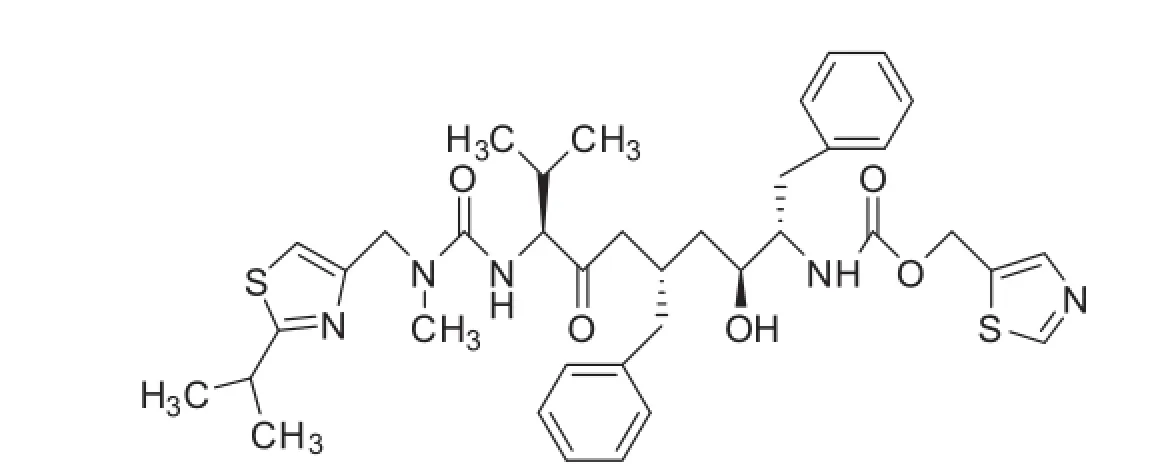
Fig.1.Chemical structure of ritonavir sulfate.
Vibrational spectroscopy has an edge over the above mentioned techniques for studying pharmaceutical systems at molecular level as it is a nondestructive and noninvasive technique,and is sensitive to structural conformational aspects and the environment of the compound to be analyzed[18].It also offers substantial advantages in terms of speed,lends them to in-process monitoring of the structure and does not require hazardous organic solvents.Vibrational spectroscopy has been employed by various researchers to evaluate the photo-stability of drugs.The photo-stability of nicardipine and corresponding transformations during the shelf-life of the solid dosage form of a drug has been determined using Fourier transform infrared(FTIR)spectroscopy [19].Similarly,the photo-stability of carbamazepine polymorphs and nifedipine has been studied using Fourier transform re fl ection-absorption spectroscopy[20,21].In our previous study,we applied diffuse re fl ectance infrared spectroscopy to evaluate the stability of some antiretroviral and anticancer drugs[22–24].Raman spectroscopy has been successfully used for the quantitative analysis of polymorphic mixture of carbamazepine[25].Sardo et al.[26]used Raman spectroscopy to monitor reversible-hydration kinetic processes of niclosamide.Moreover,hydration and dehydration characteristics of theophylline have been monitored using Raman spectroscopy[27].
The present study was conducted to assess the feasibility of vibrational spectroscopy to address thermal as well as hydration stability issues of ritonavir sulfate.The critical temperature and critical relative humidity(RH)of ritonavir sulfate estimated through this work are necessary not only for its processing in pharmaceutical industry but also for predicting its shelf life and suitable storage conditions.In this framework,diffuse re fl ectance infrared Fourier transform(DRIFT)spectroscopy was used to evaluate the thermal stability of the drug.HPLC and thermogravimetric analysis(TGA)/differential thermal analysis(DTA) were used to substantiate the inferences drawn from the spectroscopic analysis of the thermally degraded drug.Furthermore, Raman spectroscopy,a water transparent technique,was used to study the hydration stress behavior of ritonavir,and HPLC was also used as a con fi rmatory technique for hydration stress behavior. Moreover,atomic force microscopy(AFM)analysis was carried out to depict changes in the topographical morphology of the hydrated form of ritonavir sulfate.
2.Experimental
2.1.Materials and methods
Tablets of ritonavir sulfate used in this investigation were procured from Cipla Pharmaceuticals Limited,India.Spectroscopic grade potassium bromide(KBr)was bought from BDH Laboratory Suppliers,England.Methanol(CH4O),potassium phosphate(KH2PO4), acetonitrile(C2H3N)and 0.05 Mphosphoric acid(H3PO4)used in the study were of HPLC grade and obtained from Qualigens Fine Chemicals.Millipore puri fi ed water(resistance~18.2 MΩ)from Scholar-UV Nex UP 1000 system was used for HPLC analysis.All other reagents were of analytical grade and used without further puri fi cation.
2.2.Thermal degradation studies
2.2.1.Sample preparation
Ritonavir sulfate was thermally degraded using Linkam TP 92, HFS 91/Hot stage plate with platinum resistor.The setup included a small aluminum dish in which the drug powder was kept on the silver block in the hot stage.The drug samples for the study were heated at different temperatures ranging from 30 to 120°C with an increment of 10°C for a period of 1–6 h with an increment of 1 h at each temperature.Besides this,a fresh drug sample was used at each temperature and retention time.Then,the thermally treated samples were cooled down to room temperature before being subjected to DRIFT measurements.The heating and cooling rate of the hot stage was maintained at 10°C/min.
2.2.2.DRIFT spectroscopic measurements
To characterize thermally treated ritonavir sulfate samples, homogenous sample mixtures were prepared by dispersing 5% (m/m)of thermally treated drug powder in spectroscopic grade potassium bromide.The sample mixtures were then kept in the sample holder of Varian 660 Fourier transform infrared spectrophotometer equipped with Pike Technologies,diffuse re fl ectance accessory operating with a Globar source,in combination with a KBr beam splitter and deuterated triglycine sulfate(DTGS)detector.The infrared spectra of the drug powder before and after exposure to thermal radiation were recorded in the scan range of 400–4000 cm-1with a resolution of 4 cm-1.A total of 256 scans were collected for each spectrum.Background spectrum was also recorded with ground potassium bromide powder under the same experimental conditions before collecting each sample scan.
2.2.3.HPLC measurements
HPLC analysis of thermally degraded ritonavir sulfate was performed on a Shimadzu HPLC(UFLC,Prominence)equipped with an LC-20AD binary pump,an SPD-20A variable wavelength UV–vis detector,a CTO-20A column oven,degasser and a manual injector fi tted with 20μL sample loop.The instrument was controlled by LC software.A Phenomenex C18column(250 mm× 4.6 mm,5μm)was used for analysis.The mobile phase consisting of acetonitrile:0.05 M phosphoric acid(55:45,v/v),was ultrasonicated and vacuum fi ltered by passing through a 0.44μm pore size membrane fi lter prior to use.The standard stock solutions of fresh ritonavir sulfate at a concentration of 1.0 mg/mL,after exposure to thermal radiations and different RH treated samples, were prepared in the mobile phase.The prepared solution was ultrasonicated for 20 min,vacuum fi ltered through a 0.44μm membrane fi lter and then a 0.22μm membrane fi lter before being fed to the manual injector.The fl ow rate was adjusted to 1.0 mL/ min and the injection volume of 20μL was maintained.All the chromatograms were recorded at a wavelength of 210 nmwith the column temperature maintained at 40°C.
2.2.4.TGA/DTA studies
For comprehensive analysis of ritonavir sulfate's thermal behavior, TGA/DTA measurements of the drug were conducted on a Shimadzu TA 60 thermalanalyzer with 10 mg of sample under a nitrogen fl ow of 40 mL/min with a heating rate of 10°C/min from 35 to 350°C.The experiment was performed in triplicate to check the reproducibility.
2.3.Hydration studies
2.3.1.Sample preparation
Approximately 0.5 g of the anhydrous ritonavir sulfate samples were transferred to glass petridishes and exposed to different RH conditions which were obtained using various saturated salt solutions.The RH values taken from literature[28]were manually optimized and were as follows:9%(KOH),13%(LiCl),20%(KC2H3O2),28% (KF),30%(CaCl2),42%[Zn(NO3)2],48%(KSCN),66%(NaNO2),73% (KHSO4),81%[(NH4)2SO4],82%(NH4Cl),86%(Na2SO3),92%(KNO3). Similarly,0%and 100%RH were achieved using silica and millipore water,respectively.To equilibrate the humidity conditions,each sample was exposed to different relative humidity for one week.All the experiments were performed at ambient temperature and repeated three times to check its reproducibility.
2.3.2.FT-Raman measurements
The hydration behavior of ritonavir sulfate treated under various RH conditions,was investigated using Perkin Elmer FT-Raman spectrophotometer equipped with Nd:YAG laser with an excitation wavelength of 1064 nm.The laser power was set to 500 mW.A total of 256 scans were accumulated for each spectrum with a resolution of 4 cm-1.
2.3.3.AFM measurements
For AFM measurements,discs of ritonavir sulfate samples,after exposure to different RH environments,were prepared by placing approximately 200 mg of the sample in a press dye at a pressure of 10 t for 5 min.Raman spectroscopy of the discs did not depict any change in the spectra as a consequence of the applied pressure. AFM measurements of the discs were performed using Witec AFM-micro-Raman instrument.All measurements were acquired in air using tapping mode with silicon cantilevers with a nominal force constant and resonance frequency of approximately 50 N/m and 300 kHz,respectively.
3.Results and discussion
3.1.Thermal degradation analysis
3.1.1.DRIFT spectroscopic analysis
Ritonavir sulfate was thermally treated at temperatures ranging from 30 to 120°C beyond which the physical state of the drug started changing.The DRIFT spectrum of the thermally untreated drug in the frequency range of 4000–400 cm-1is shown in Fig.2. The characteristic spectrum of fresh ritonavir sulfate showed sharp peaks at 3085 and 3285 cm-1corresponding to C=C–H asymmetric stretching vibrations of benzene ring and to N–H stretching vibrations of amide groups,respectively,while those peaks at 2953,2918 and 2853 cm-1are due to C–H symmetric and antisymmetric stretching vibrations of alkanes[29].The absorption band owing to the carbonyl group of ester linkage was observed at 1725 cm-1[30].In addition,1678 cm-1band corresponds to C=O stretching vibrations of amide group.Similarly, bands at 1524 and 1496 cm-1can be assigned to C=C stretching vibration of aromatic carbons presenting in the benzene ring, while infrared band at 1461 cm-1is due to C–H3bending vibrations[29].Furthermore,the absorption band at 1372 cm-1is attributed to C–H rocking vibration of alkanes.C–O stretching vibrations of esters were found in the infrared region 1000 to 1300 cm-1[29].Besides this,the band at 936 cm-1corresponds to O–H bending vibrations of carboxylic acid.In the frequency range of 400–900 cm-1,out of plane C–H distortions were visible amongst which the band at 739 cm-1may be due to the presence of C–H bending vibrations depicting aromatic substitution[31].
The overlaid DRIFT spectra of ritonavir sulfate collected after exposure to thermal radiations at different temperatures are shown in Fig.3 and signi fi cant changes at higher temperatures in frequency region of 1800–400 cm-1are illustrated in Fig.4.No major structural changes in terms of infrared band position or intensity were noticed up to 70°C,although trivial intensity variations in the region of–OH stretching(3000–4000 cm-1)were observed,which may be attributed to loss of water adsorbed. Considerable intensity variation was observed in the spectra at 80°C,which revealed that the drug started degrading around this temperature.Signi fi cant changes were detected in the spectra after exposure at 100°C for 5 h.The intensity of characteristic peaks ascribed to ritonavir sulfate started diminishing at the above mentioned temperature.The higher frequency region attributed to CH/NH/OH stretching was relatively stable,except for slight intensity variation observed.The intensity of bands at 2953,2918 and 2853 cm-1which were due to H–C–H symmetric and antisymmetric stretching vibrations of alkanes diminished.The infrared absorption band at 1725 cm-1owing to the carbonyl group of ester linkage also vanished.Slight intensity variation was observed in the band at 936 cm-1which corresponds to O–H bending vibrations of carboxylic acid.Besides this,a drop in the intensity was observed at 1372 and 1239 cm-1bands which correspond to C–H rocking vibration of alkanes and C–O stretching vibrations of esters,respectively.Similarly,bands at 1117,1025 and 703 cm-1disappeared whereas a new peak at 444 cm-1originated in the spectra of degraded drug(inset of Fig.4).This band may be tentatively assigned to out of plane C–H distortion due to thiazole moiety[32].It can be used as a marker band for the degradation of ritonavir sulfate.Similarly,peaks at 1286 and 845 cm-1owing toC–O stretching vibrations of esters and C–H“oop”modes showed more intense behavior on degradation.The variations in the band positions and intensity observed in the infrared spectra of the drug when exposed to intense thermal radiations are listed in Table 1.
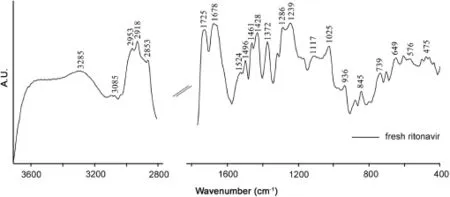
Fig.2.DRIFT spectrum of ritonavir sulfate in the frequency range of 4000–400 cm-1.
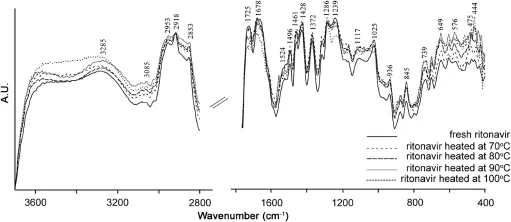
Fig.3.Overlaid DRIFT spectra of ritonavir sulfate in the frequency range of 4000–400 cm-1.

Fig.4.Overlaid DRIFT spectra of ritonavir sulfate at higher temperatures in the region of 1800–400 cm-1.

Table 1 Changes in DRIFT frequencies after ritonavir sulfate exposure to higher temperatures and their proposed assignments
The results of DRIFT spectroscopy presented here showed that major structural changes took place in ritonavir sulfate after exposure to thermal radiation at 100°C,whereas it got completely decomposed after 200°C.Further,these results indicated higher thermal stability of the drug as illustrated by TGA/DTA outcomes.
3.1.2.HPLC analysis
HPLC chromatogram of unexposed ritonavir sulfate as shown in Fig.5A revealed that the drug was separated at a retention time of about 6 min.Further,the chromatographic results of thermally exposed ritonavir remained the same in terms of peak intensity and retention time up to 80°C,beyond which an additional peak was observed marking onset of the drug degradation process.And an additional peak along with a decrease in the characteristic peak intensity of ritonavir sulfate was observed at 100°C(exposure time 5 h)and remained consistent up to 120°C.Thus,it can be inferred that maximum degradation was attained at 100°C,and HPLC results substantiated DRIFT outcomes.The comparative chromatogram of thermally exposed(100°C,5 h)drug with that of unexposed drug is shown in Fig.5B.
3.1.3.TGA/DTA
Ritonavir sulfate was analyzed using TGA/DTA to get an idea about the thermaldecomposition behavior of the drug.In TGA,the change in sample mass was measured by a thermobalance as a function of temperature.Fig.6 shows the TGA curve of ritonavirsulfate.High thermal stability of the drug can be evident from the thermal curve as the decomposition started at about 200°C.The major weight loss occurred between 220 and 300°C.DTA curve was in accordance with TGA results.

Fig.5.(A)HPLC chromatogram of unexposed ritonavir sulfate and(B)overlaid chromatogram of unexposed and thermally degraded drug at 100°C atexposure time of 5 h.

Fig.6.TGA curve of ritonavir sulfate.
3.2.Hydration studies
3.2.1.Raman analysis
Raman spectrum of anhydrous ritonavir sulfate is shown in Fig.7.The band at 1732 cm-1was attributed to the NH…O stretching.The Raman frequency at 1665 cm-1is assigned to the NH…N stretching vibration.The band at 1602 cm-1corresponds to the amide CO stretching vibration.N=N stretching was observed at about 1492 cm-1[33].The absorption band at 1230 cm-1is assigned to the C=O stretching vibration.The ring stretching was observed at 1205 cm-1.O–HN deformation was observed at 1115 cm-1.The Raman frequency at 932 cm-1may be attributed to symmetric C–O–C stretching.In-plane ring bending vibration was observed at 750 cm-1[33].
Fig.8 compares the Raman spectra of untreated ritonavir sulfate with those of collected ones after the drug exposure to RH(82%). Remarkable differences in terms of band intensity were visible in the overlaid spectra,which may be associated with the structuralchanges induced by hydration.The tentative assignments of the bands where differences occurred are presented in Table 2.

Fig.7.Raman spectra of ritonavir sulfate in the region of 1800–600 cm-1.
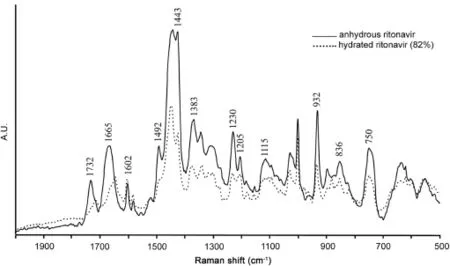
Fig.8.Overlaid Raman spectra of ritonavir sulfate after exposure to high relative humidity.

Table 2 Changes in Raman frequencies after exposing ritonavir sulfate to higher relative humidity and their proposed assignments

Fig.9.Overlaid HPLC chromatogram of unexposed and hydrated(82%RH)drugs.
It can be seen that NH…O stretching vibration that appeared at 1732 cm-1in anhydrous form disappears on hydration.The band at 1665 cm-1that is assigned to NH…N stretching became less intense and shifted towards lower wavenumber on hydration.N=N stretching band at 1492 cm-1disappeared after the drug exposure to higher humidity.O–H stretching peak observed at 1443 cm-1in anhydrous form became sharp at higher humidity.This may be due to the hydrogen bonding on hydrate formation.The intensity of C=O stretching vibration at 1230 cm-1was decreased after the drug exposure to higher humidity.The observed shifts may result from the increase of hydrogen contacts of–OH Group.The structural changes in the ritonavir sulfate exposure to higher humidity may be associated with hydrate/pseudo polymorphic transition of the drug.These results suggested that hydrate formation took place when the drug is exposed to higher humidity.In addition,structural changes due to hydrate/pseudo polymorphic transition can easily be monitored by Raman spectroscopy.
要实现基础地理信息数据与地理国情要素数据的有机整合,其核心问题就是生产数据库的数据规定编制。即结合基础地理信息数据和地理国情要素数据的特征,制定兼容二者的要素代码规则、要素内容和指标,同时也要满足各类成果数据自动抽取的要求。
During processing steps like crystallization and lyophilization, wet granulation and spray-drying pharmaceutical solids may come in contact with water.Further,the drug substances,which were subjected to stress conditions(different temperatures and RH environments)during storage,lead to unexpected hydration and dehydration phenomena,which affect several drug properties such as solubility,dissolution rate,stability and bioavailability [34,35].The Raman spectra of anhydrous samples stored at different relative humidities showed evidences of the presence of hydrated samples only after RH>67%and all the bands assigned to anhydrous ritonavir sulfate remained intact up to 65%RH.
3.2.2.HPLC analysis
HPLC chromatogram illustrating hydration behavior of ritonavir sulfate under water stress condition is shown in Fig.9.It is evident that the structure of ritonavir sulfate started changing at about 73%RH.A gradual peak shift to relatively higher retention time was obtained beyond this RH value,while the drug remained stable below this humidity condition.
3.2.3.AFM analysis

Fig.10.AFM topographic image of ritonavir sulfate after exposing to different relative humidity environments.(A)anhydrous,(B)28%RH and(C)82%RH.
The surface morphological changes of the anhydrous as well as hydrated samples ofritonavir sulfate were characterized by AFM.It is wellknown that AFM is one of effective ways for the surface analysis due to its high resolution and powerful analysis software.Fig.10 shows AFM results before and after the drug exposure to different relative humidity environments in terms of SDR(signal of disproportionate reporting)percentage.The anhydrous form of ritonavir sulfate showed SDR 4.76538%,which was eventually reduced to SDR 1.04291%at 82%RH.Therefore,it can be concluded that morphology of the drug changed as it was exposed to different RH environments, which may be attributed to hydrate formation.
4.Conclusions
The present study assessed the feasibility of vibrational spectroscopy to evaluate the thermal stability and hydration behavior of tablet dosage form of ritonavir sulfate.From DRIFT spectroscopic investigations,it can be concluded that ritonavir sulfate started degrading around 80°C and got completely degraded at 100°C.All the characteristic peaks of ritonavir sulfate diminished signi fi cantly along with the emergence of a new peak at 444 cm-1at 100°C and at all temperatures beyond it.Similarly,high thermal stability of ritonavir sulfate is also con fi rmed through TGA/DTA investigations.Raman spectroscopic results suggested that the drug underwent structural transition as a consequence of hydration when exposed to different RH environments.The value of critical RH for ritonavir sulfate was found to be>67%.The results of hydration were con fi rmed by AFM analysis.In addition,HPLC results were in wellagreement with DRIFT and Raman spectroscopic inferences accredited to thermal and hydration stress degradation,respectively.Further,this study was carried out to evaluate the stability of ritonavir sulfate under other stress conditions as de fi ned by ICH guidelines.
Acknowledgments
The authors are thankfulto the Director,CSIR–National Physical Laboratory,New Delhi,India,for granting the permission to publish this work.
References
[1]S.G.Deeks,F.M.Hecht,M.Swanson,et al.,HIV-RNA and CD4 cell count response to protease inhibitor therapy in an urban AIDS clinic:response to both initial and salvage therapy,Aids 13(1999)F35–F43.
[3]R.N.Rao,B.Ramachandra,R.M.Vali,et al.,LC–MS/MS studies of ritonavir and its forced degradation products,J.Pharm.Biomed.Anal.53(2010)833–842.
[4]R.S.Yekkala,D.Ashena fi,I.Mariën,et al.,Evaluation of an international pharmacopoeia method for the analysis ofritonavir by liquid chromatography, J.Pharm.Biomed.Anal.48(2008)1050–1054.
[5]ICH Stability Testing of New Drug Substances and Products,International Confrence on harmonization,IFPMA Geneva,1993.
[6]A.Sulebhavikar,U.Pawar,K.Mangoankar,et al.,HPTLC method for simultaneous determination oflopinavir and ritonavir in capsule dosage form, J.Chem.5(2008)706–712.
[7]W.Gutleben,N.D.Tuan,H.Stoiber,et al.,Capillary electrophoretic separation of protease inhibitors used in HIV therapy,J.Chromatogr.A 922(2001) 313–320.
[8]P.G.Wang,J.S.Wei,G.Kim,et al.,Validation and application of a high performance liquid chromatography–tandem mass spectroscopy method for simultaneous quanti fi cation of lopinavir and ritonavir in human plasma using semi-automated 96-wellliquid–liquid extraction,J.Chromatogr.A 1130(2006) 302–307.
[9]K.M.Rentsch,Sensitive and speci fi c determination of eight antiretroviral agents in plasma by high performance liquid chromatography–mass spectroscopy,J.Chromatogr.B 788(2003)339–350.
[10]E.Gangl,I.Utkin,N.Gerber,et al.,Structuralelucidation of metabolites of ritonavir and indinavir by LC–MS,J.Chromatogr.A 974(2002)91–101.
[11]K.Chiranjeevi,K.P.Channabasavaraj,P.Srinivas Reddy,et al.,Development and validation of spectrophotometric method for quantitative estimation of ritonavir in bulk and pharmaceutical dosage form,Int,J.Chem.Technol.Res.3 (2011)58–62.
[12]A.Behera,S.K.Moitra,S.Si,et al.,Method development,validation and stability study of ritonavir in bulk and pharmaceutical dosage form by spectrophotometric method,Chron.Young Sci.2(2011)161–167.
[13]J.Martin,G.Deslandes,E.Dailly,et al.,A liquid chromatography–tandem mass spectrometry assay for quanti fi cation of nevirapine,indinavir,atazanavir, amprenavir,saquinavir,ritonavir,lopinavir,efavirenz,tipranavir,darunavir and maraviroc in the plasma of patients infected with HIV,J.Chromatogr.B 877(2009)3072–3082.
[14]R.Nanda,A.Kulkarni,P.Yadav,Simultaneous spectrophotometric estimation of atazanavir sulfate and ritonavir in tablets,Der Pharm.Chem.3(2011) 84–88.
[15]C.L.Dias,A.M.Bergold,P.E.Fröehlich,UV-derivative spectrophotometric determination of ritonavir capsules and comparison with LC method,Anal.Lett. 42(2009)1900–1910.
[16]J.A.Droste,C.P.Verweij-Van Wissen,D.M.Burger,Simultaneous determination of the HIV drugs indinavir,amprenavir,saquinavir,ritonavir,lopinavir,nel finavir,the nel fi navir hydroxymetabolite M8,and nevirapine in human plasma by reverse phase high performance liquid chromatography,Ther.Drug Monit. 25(2003)393–399.
[17]G.Aymard,M.Legrand,N.Trichereau,et al.,Determination of twelve antiretroviralagents in human plasma sample using reversed-phase high-performance liquid chromatography,J.Chromatogr.B 744(2000)227–240.
[18]S.Wartewig,R.H.Neubert,Pharmaceuticalapplications of mid-IR and Raman spectroscopy,Adv.Drug Deliver.Rev 57(2005)1144–1170.
[19]A.Heinz,C.J.Strachan,K.C.Gordon,et al.,Analysis of solid-state transformations of pharmaceutical compounds using vibrational spectroscopy,J.Pharm. Pharmacol.61(2009)971–988.
[20]M.A.Bayomi,K.A.Abanumay,A.A.Al-Angary,Effect of inclusion complexation with cyclodextrins on photostability of nifedipine in solid state,Int.J.Pharm. 243(2002)107–117.
[21]Y.Matsuda,R.Akazawa,R.Teraoka,et al.,Pharmaceutical evaluation of carbamazepine modi fi cations:comparative study for photostability of carbamazepine polymorphs by using Fourier-transformed re fl ection-absorption infrared spectroscopy and colorimetric measurement,J.Pharm.Pharmacol.46 (1994)162–167.
[22]P.Singh,R.Mehrotra,A.K.Bakhshi,Stress degradation studies of nel fi navir mesylate by Fourier transform infrared spectroscopy,J.Pharma.Biomed.Anal. 53(2010)287–294.
[23]P.Singh,L.Premkumar,R.Mehrotra,et al.,Evaluation of thermal stability of indinavir sulphate using diffuse re fl ectance infrared spectroscopy,J.Pharm. Biomed.Anal.47(2008)248–254.
[24]P.Singh,G.Tyagi,R.Mehrotra,et al.,Thermalstability studies of5-fl uorouracil using diffuse re fl ectance infrared spectroscopy,Drug Testing Anal.1(2009) 240–244.
[25]C.J.Strachan,D.Pratiwi,K.C.Gordon,et al.,Quantitative analysis of polymorphic mixtures of carbamazepine by Raman spectroscopy and principal components analysis,J.Raman Spectosc.35(2004)347–352.
[26]M.Sardo,A.M.Amado,P.J.Ribeiro-Claro,Pseudopolymorphic transitions of niclosamide monitored by Raman spectroscopy,J.Raman Spectrosc.39(2008) 1915–1924.
[27]A.M.Amado,M.M.Nolasco,P.J.Ribeiro-Claro,Probing pseudopolymorphic transitions in pharmaceuticalsolids using Raman spectroscopy: hydration and dehydration of theophylline,J.Pharm.Sci.96(2007) 1366–1379.
[28]R.C.Weast,M.J.Astle,W.H.Beyer,CRC Handbook of Chemistry and Physics, CRC press,Boca Raton,FL,1988.
[29]G.Socrates,Infrared and Raman Characteristic Group Frequencies:Tables and Charts,John Wiley&Sons,England,2004.
[30]J.Machado,D.Baleanu,A.A.AL-Zahrani,et al.,On similarities in infrared spectra of complex drugs,Rom.Rep.Phys.66(2014)382–393.
[31]N.P.Roeges,A Guide to the Complete Interpretation of Infrared Spectra of Organic Structures,Wiley,New York,1974.
[32]D.L.Pavia,G.M.Lampman,G.S.Kriz,et al.,Introduction to Spectroscopy, Cengage Learning,USA,2008.
[33]F.R.Dollish,W.G.Fateley,F.F.Bentley,Characteristic Raman Frequencies of Organic Compounds,John Wiley&Sons,New York,1974.
[34]R.K.Khankari,D.J.W.Grant,Pharmaceutical hydrates,Thermochim.Acta 248 (1995)61–79.
[35]G.Daniele,C.Goldbronn,M.Mutz,et al.,Solid state characterization of pharmaceutical hydrates,J.Therm.Anal.Calorim.68(2002)453–465.
13 December 2014
in revised form
☆Peer review under responsibility of Xi'an Jiaotong University.*
.Fax:+91 11 45609310.
E-mail address:ranjana@nplindia.org(R.Mehrotra).
1Equal contribution.
 Journal of Pharmaceutical Analysis2015年6期
- Journal of Pharmaceutical Analysis的其它文章
- Development of cell metabolite analysis on micro fl uidic platform☆
- Identi fi cation,synthesis and characterization of process related des fl uoro impurity of ezetimibe and HPLC method validations☆
- Quanti fi cation of tolvaptan in rabbit plasma by LC–MS/MS:Application to a pharmacokinetic study☆
- Antimicrobial and antiproliferative prospective of kosinostatin–a secondary metabolite isolated from Streptomyces sp.☆
- Optimization,validation and application of an assay for the activity of HMG-CoA reductase in vitro by LC–MS/MS☆
- In vitro–in vivo studies of the quantitative effect of calcium, multivitamins and milk on single dose cipro fl oxacin bioavailability☆
