
Population Exposure and Impacts from Earthquakes:Assessing Spatio-temporal Changes in the XX Century
2015-12-19 08:46FreireEhrlichandFerri
S.Freire,D.Ehrlichand S.Ferri
Population Exposure and Impacts from Earthquakes:Assessing Spatio-temporal Changes in the XX Century
S.Freire1,D.Ehrlich1and S.Ferri1
Media and specialized scienti fic literature are often addressing the“increasing impact and ensuing damages due to natural hazards”.It is frequently argued that a rising frequency and intensity of hazards is responsible for the increase in losses.The role of increasing population exposure due to phenomenal population growth,or urbanization as a driver of risk is still insuf ficiently addressed.We investigate spatio-temporal changes in population exposure to seismic hazard and their role on impacts from earthquakes in the XX century.Spatial analysis is used to study historical population distributions in relation to seismic intensity,at theglobalandcontinentallevels.Changesinnumberofvictimswerealsoanalyzed,while considering the progress in frequency and magnitude of hazard events.There is also a focus on megacities and implications of fast urbanization for exposure and risk.We find that global population exposure in zones of severe seismic hazard has grown above overall population growth rates,with exposure growth rates being highest in the Americas,Asia,and Oceania.Results illustrate the relevance of population growth and exposure for risk assessment and disaster outcome,and underline the need for conducting detailed global mapping of settlements and population distribution.
Populationdistribution;exposure;earthquakes;spatio-temporalanalysis;megacities.
1 Introduction
It is often conveyed,in mass media as well as in the disaster-related scienti fic literature,an idea of“increasing impact,damages,and cost of natural hazards”[Alexander(2006)].This situation is typically attributed to the rising frequency of haz-ard events[e.g.,Smolka(2006)]and/or growing vulnerability of populations[e.g.,Huppert and Sparks(2006)].However,for many hazard occurrences,especially those above a certain magnitude or intensity,population exposure is arguably the greatest determinant of resulting human losses and impacts[Freire and Aubrecht(2012)].If this is con firmed,then the ongoing remarkable global population growth and related expansion of urbanization(especially in the most hazardous areas),is the main driver of these mounting impacts,since the frequency of events appears to have remained relatively constant[Cutter and Emrich(2005)].In fact,for a number of low-income countries the rapid population growth outpaces any disaster risk mitigation and vulnerability reduction activities,resulting in a net disaster risk increase[UNISDR(2009a)].
Disaster risk,understoodas thepotentialforlossanddamage,resultsfromthecombination of three main components:hazard,exposure,and vulnerability[UNDP(2004)].Currently,a major driver of growing disaster risk is the rapid increase in exposure of population and assets[UN(2012);UNISDR(2013)].Population exposure typically refers to the number of people present in hazard zones,that are thereby subject to potential harm[UNISDR(2009b)].
A new wave of urbanization is taking place in hazard-exposed countries[UNISDR(2013)].Due to the current extent and pace of urbanization,the geographical analysis of population exposure should receive more attention.As major concentrations of population and assets(infrastructure,economical activities)megacities1Megacities are urban agglomerations which have at least 10 million inhabitants[UN(2006)]often constitute risk hotspots that deserve special attention.The termmegacitieswas not in use at the beginning of the XX century.The term was coined to accommodate the large conurbations resulting from population growth in urban areas.Of today’s megacities only Tokyo and New York were already megacities in 1950[UN(2006)].Mexico City became a megacity in 1975[Bilham(1988)]and other 20 cities turned megacities by 2011[UN(2012)].
Evaluating population exposure for global disaster risk assessment is challenging,being limited by the availability and quality of geophysical and socio-economic data[Lerner-Lam(2007);Peduzzi,Dao,Herold,and Mouton(2009)].In fact,estimations of human exposure to hazards have been mostly conducted for limited areas,from parts of cities to small regions[e.g.,Wieland,Pittore,Parolai,and Zschau(2012)].When such studies are conducted for large areas,such as continents or the globe,they usually do not incorporate a temporal dimension[e.g.,Small and Naumann(2001)].However,analyzing past and present variation of exposure enables identi fication of dynamics and trends and may provide insight into future changes in risk.Earthquakes may provide a case-study that allows advancing these anal-yses.Concerning global seismic hazard,there is availability of digital data on its spatial distribution.Seismic hazard analysis relies on two data sources:he zonation of global spatial seismicity–a probabilistic seismic hazard layer computed by spatializing the occurrence of hazardous events over time–and the actual earthquakes recording catalogues.This zonation can be considered relatively stable in time,since it is due to slow-changing tectonics.In fact,the occurrence of earthquakes involves stochastic processes and on time scales of millennia their rates are steady and unchanging on a global scale[Huppert and Sparks(2006)].However,the way in which these rates are captured and represented based on earthquake catalogs is more problematic.Earthquake catalogs and databases provide data on their frequency and impacts.Although the randomness in the occurrence of these events complicates testing of scienti fic hypotheses about earthquakes[Sornette and Werner(2005)],this problem might be mitigated by analyzing a suf ficiently long and complete temporal series.
The United States Geological Survey(USGS)estimates population exposure to signi ficant global earthquakes which occurred since 1973[Allen,Wald,Earle,Marano,Hotovec,Lin,and Hearne(2009a)].However,the analysis departs from a static representation of population distribution,i.e.,a layer representing a single date.Improving retrospective analyses of human exposure requires not only spatially explicit demographic data[NRC(2007)],but also population datasets having an historical dimension and consistent modeling approach that enable their comparison.Although several databases which explicitly represent population distribution now exist,not all are ideally suited to conduct such studies.
The Gridded Population of the World-GPWv3[CIESIN(2004)]provides contemporary estimations of population distribution(at a spatial resolution of 2.5 arcminutes)covering only the period 1990–2015.The LandScan project[Dobson,Bright,Coleman,Durfee,and Worley(2000)]outputs higher resolution(0.5 arcmin.)yearly maps since 1998,but changes to the model advise against conducting inter-year comparisons.The History Database of the Global Environment-HYDE 3.1 project[Goldewijk,Beusen,de Vos,and van Drecht(2010)]uses consistent sources and modeling approach to estimate global population densities for the period 10,000 BC to AD 2000,aimed at supporting global change studies.The availability of the HYDE spatially-explicit surfaces of population distribution at decadal intervals,despite their coarse spatial resolution(5 arc-min.),offers the opportunity to extend the temporal depth of retrospective analyses.
This work builds on and extends recent research investigating changes in population exposure and their role on impacts from earthquakes in the XX century[Freire,Ferri,and Ehrlich(2014)].Spatial analysis is used to study contemporary population distributions in relation to seismic intensity,at global and continental scales(period 1900–2000)and for megacities(period 1950–2010).Changes in number of victims were also analyzed.The ultimate goal is to study earthquake impacts and their frequency in relation to the spatio-temporal variation of the potentiallyaffected population.
2 Materials and methods
2.1 Data sets
Data used for analysis included both spatial and tabular global sets related to seismic risk(Table 1).These data were freely available on the Internet.
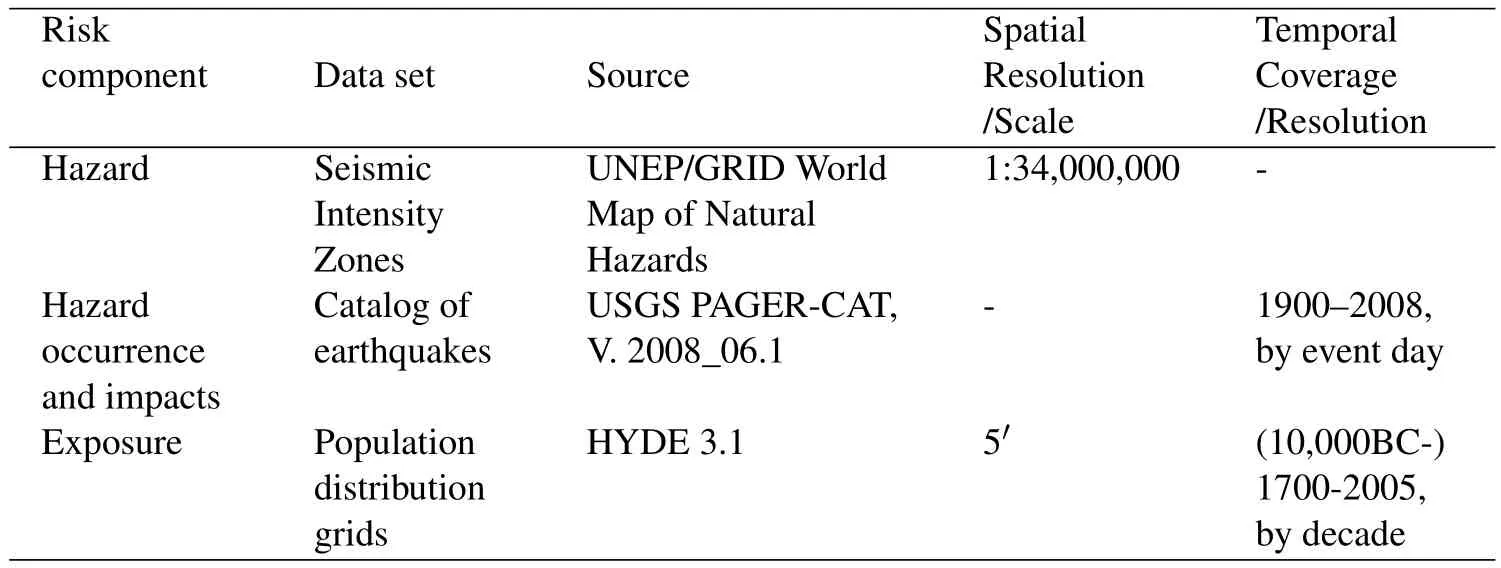
Table 1:Data sets used and respective characteristics.
Figure 1:Global map of seismic intensity zones.
The global map of hazard zoning was obtained by using the“EQUAGEO”vector coverage,which was produced by UNEP/GRID on the basis of the World Map of
Natural Hazards[MunichRe(1988)].This map shows earthquake intensity zones based on the 1956 version of the Modi fied Mercalli Intensity Scale(MMI)(Fig.1).On this map,the original twelve intensity levels have been aggregated into five zones(see Fig.1 and Table2http://earthquake.usgs.gov/research/pager/data/).MMI is usually the preferred scale to assess population exposure because it describes exclusively the effects of an earthquake,in the way it is felt by people(lower numbers)and on the observed structural damage(higher numbers)(USGS PAGER-Prompt Assessment of Global Earthquakes for Response).It is this structural damage and building collapse that is responsible for most casualties in earthquakes[Alexander(1996)].
Although MMI is still widely used,it is important to note that it has been shown to‘saturate’at a given level,and to show discrepancies in intensity assessments.In order to mitigate these effects,other intensity scales have been proposed,such as the recent Environmental Seismic Intensity scale[ESI(2007);Michetti,Esposito,Guerrieri,Por fido,Serva,Tatevossian,Vittori,Audemard,Azuma,Clague,Comerci,Gurpinar,Mccalpin,Mohammadioun,Mörner,Ota,and Roghozin(2007)].
Data on actual earthquake events was obtained from the USGS earthquake catalog(USGS PAGER-CAT2http://earthquake.usgs.gov/research/pager/data/),a composite global register of signi ficant events for the period 1900–2008[Allen,Marano,Earle,and Wald,(2009b)].The PAGERCATcombinesinformationonthesource(i.e.,hypocentrallocationandmagnitude)and casualty estimates gathered from several published catalogs for earthquakes of magnitude M 5.5 and greater.In version 2008_06.01 this catalog provides data for 22,450 earthquake events.
To investigate human exposure,we used data from the History Database of the Global Environment-HYDE 3.1[Goldewijk,Beusen,and Janssen(2010)].The HYDE model considers land availability and a set of attractivity rules to hindcast current population distribution from LandScan using historical estimates of national populations.HYDE provides spatially-explicit global raster surfaces of population counts for various time steps,since 10,000 BC to AD 2005(by decade since AD 1700),at a resolution of 5 arc-minutes(approx.10 km at equator).In this analysis we used decadal layers covering the period 1900–2000.Population distributions for 1900 and 2000 are shown in Fig.2.
For analysis at continental level,the world was subdivided in five continents based ontheGlobalAdministrativeBoundariesDatabase(GADM:http://www.gadm.org/).GADM provides digital spatial data on the location of the world’s administrative areas(or administrative boundaries)for use in GIS and similar software.We used version2http://earthquake.usgs.gov/research/pager/data/.0 and applied one modi fication to the continental attribution of countries:Russia was divided in its European part,that corresponding to the territory West of the Ural mountains,and its Asian part,that East of the Ural mountains.The Western part was included in the European continent and the Eastern part to the Asian continent.

Figure 2:Map of HYDE 3.1 population distribution(5′cell size)for 1900(A)and 2000(B),centered in Afghanistan.
2.2 Methodology
The analysis was carried out in a Geographic Information System(GIS)and addressed spatio-temporal changes in population exposure and impacts from earthquakes at(a)global level,(b)by continent,and(c)for selected cities.
At global and continental level,changes in population exposure to seismic hazard in the period 1900–2000 were investigated.For examining this changing exposure,both total population and their density were analyzed for each seismic hazard zone and decade from 1900 to 2000.This was accomplished by conducting zonal analyses of the population surfaces and the seismic hazard map in a GIS.These analyses involve overlaying the selected population surfaces and the seismic hazard map and for each surface/decade summing the population contained in each of the five seismic zones.
At global level,the estimated number of victims in this period,as reported in the PAGER-CAT catalog,was also considered.We especially focused the analyses on zones 3 and 4,which match areas potentially affected by Mercalli Intensity levels VIII and above.This level corresponds to severe shaking for which considerable damage in ordinary substantial buildings with partial collapse is to be expected.Damage is great in poorly built structures3See http://earthquake.usgs.gov/learn/topics/mercalli.php.
Converging further the analysis in geographic space,we investigate and discuss the 1950–2010 evolution of population exposure for the world’s twenty megacities,drawing on UN data for population[UN(2006)]and considering their location respective to the global seismic zoning(Fig.1).Megacities are not the only hotspots of risk-although many are located and expand into hazardous areas.However,they symbolize the speed and magnitude of population growth and subsequent increase in exposure and potentially in disaster risk.
3 Results and discussion
3.1 Global population exposure
Results of the global analysis of population exposure to seismic hazard in 1900 and 2000 are presented in Tables 2 and 3.This analysis was carried out by summarizing(summing)the population distribution in 1900 and 2000(from the HYDE 3.1 database)contained in the seismic hazard zones of the EQUAGEO map.
Table 2 shows,for each seismic hazard zone and respective Modi fied Mercalli(MMI)levels,the global population exposure in 1900 and 2000 and relative changes.Table 3 displays the global land surface of seismic hazard zones and respective population densities in 1900 and 2000.
Tables 2 and 3 show that in 2000 about 17%of the global population was exposed to severe ground shaking(MMI>=VIII),increasing from about 14%in 1900.However,this exposure had the highest relative increase from 1900 to 2000(>300%),with human occupation of the highest hazard zone(zone 4)increasing by more than 180 million people in this period.
Although zone 4(MMI IX-XII)accounts for only 1.5%of the total land surface,in 2000 it includes 4%of the world’s population.Population density in that zone was already the highest in 1900,and in 2000 it is five times higher than in zone 0(MMI I-V)(119 vs.23 people per Km2).It is also much higher than average global density(about 45 people/Km2)
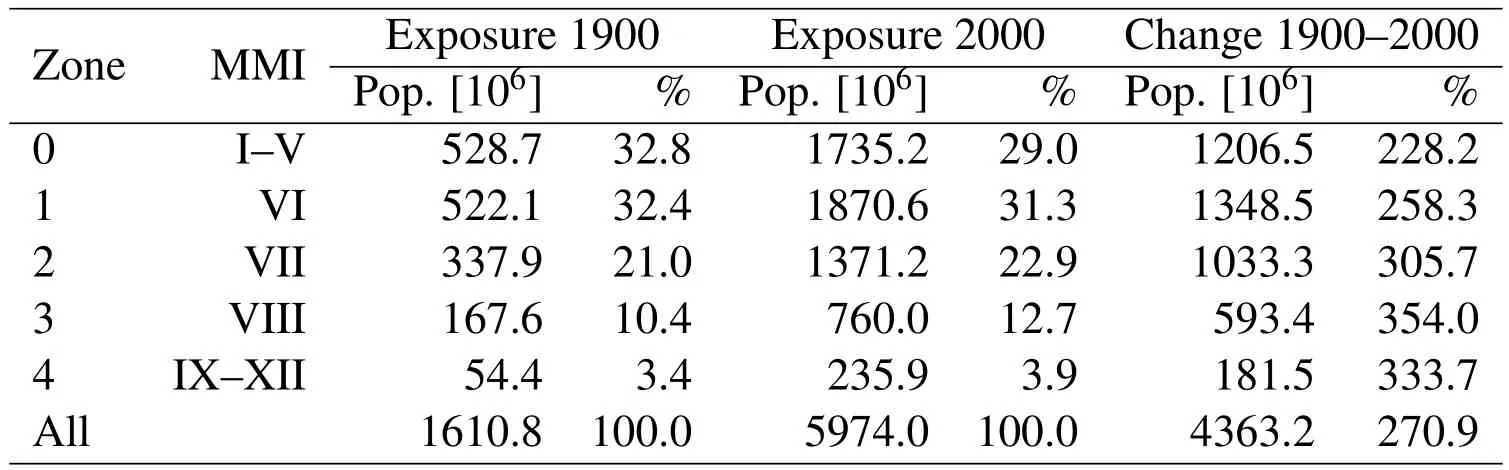
Table 2:Zones of seismic hazard in the EQUAGEO map and total population exposure in 1900 and 2000.

Table 3:Zones of seismic hazard in the EQUAGEO map,their respective area and population densities in 1900 and 2000.
These findings may support and offer additional evidence to the claim that in main hazard areas the population growth rates are such that it makes it virtually impossible for the speed of implementation of protection measures to catch up[cf.Adger and Brooks(2003)].This is especially dangerous since earthquake mortality appears to be more systematically linked to the population exposed to severe ground shaking(Modi fied Mercalli Intensity VIII+)[Allen,Marano,Earle,and Wald(2009b)].
Figure 3 shows changes in population living within zones 3 and 4(VIII+).Beyond the continuous increase of total exposure,a finer analysis by decade shows that population growth rate in zone 3 has increased above the global population rate in all periods,while for zone 4 this also occurred in the 1960s and 70s,and especially until 1940,when its increase rate was the highest.

Figure 3:Evolution of global population exposed to highest seismic hazard,by decade.Bars refer to total population in zones(right axis)and lines to percentual population change relative to previous period(left axis).
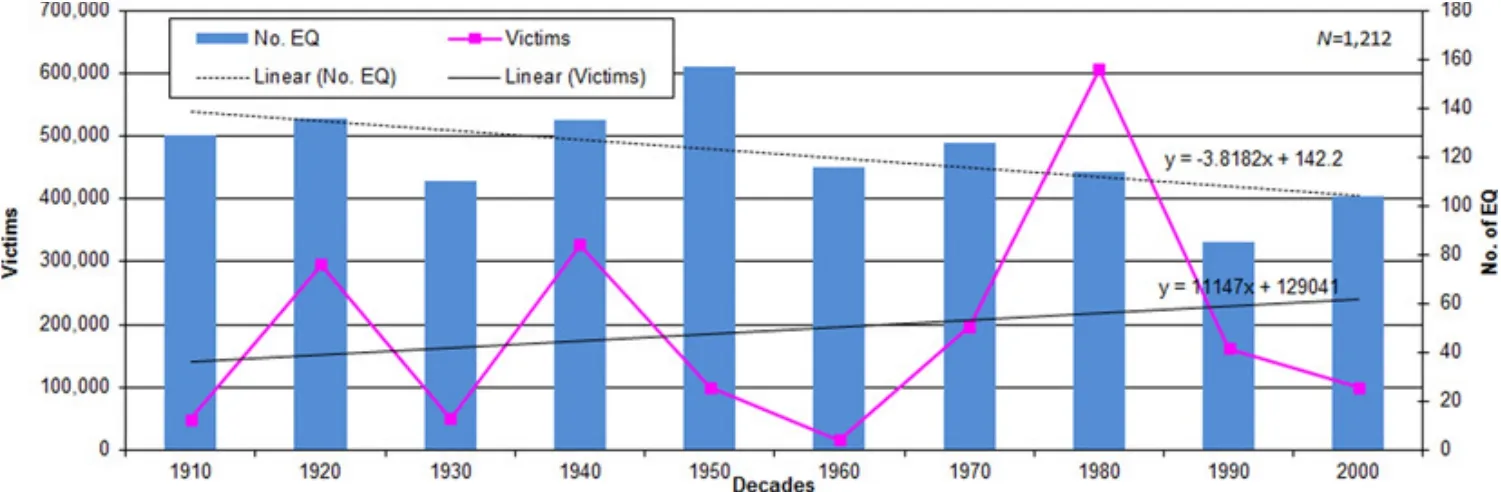
Figure 4:Number of events and number of victims for large earthquakes(M>7)from USGS PAGER-CAT,by decade.
Figure 4 shows the total number of events and number of victims(deaths+injuries)for magnitudes M greater than 7,summarized by decade from the values in the earthquake catalog(using PAGER preferred values).While the number(frequency)of large earthquakes is relatively stable(average of 121 per decade)or even shows a tendency to decrease,the number of victims displays a remarkable variation,albeit with a slight rising tendency(however mostly due to high mortality and morbidity in the 1980s).A small number of major events tend to be responsible for a disproportionate number of victims,by hitting urban areas or densely populated areas.If one takes victims as an indication of direct impact on human populations,these impacts do not show a clear tendency to decrease.
However,the period under analysis,a mere century,may be too short to adequately capture and study the repeat cycle of the largest events,which cause the greatest impacts,mortality and morbidity.Overall mortality in earthquakes is concentrated heavily in the largest events and in particular places,and only about three- fifths of the damaging earthquakes that occur around the world generate mortality or morbidity[Alexander(1996)].
Furthermore,it should be considered that catalogs contain a wide variety of uncertainties and data gaps[Sornette and Werner(2005);Bilham(2009)]which cannot be easily eliminated.In fact,the absence of reliable data is a major constraint to conducting assessments of disaster risk and losses.Still,loss of life is considered the most consistent and quanti fiable measure,despite the recent focus on economic value[NRC(2006)].In this case,thresholding earthquake events by magnitude 7 was also required due to the strong bias present in the number of registered events and associated data below that level.Further research is needed to con firm these results and investigate tendencies in more detail,spatially and temporally.
3.2 Continental population exposure
In Figure 5 is plotted for each continent the evolution from 1900 to 2000 of the share of its total population within the two highest seismic hazard zones(3 and 4,corresponding to MMI levels VIII+).

Figure 5:Evolution from 1900 to 2000 of share of continent’s population within seismic hazard zones 3 and 4.
Figure 5 shows the 1900–2000 trends regarding relative population exposure to higher earthquake hazard,by continent.In the period under analysis,two main situations can be identi fied:while Europe and Africa have overall rather low relative exposure(around 5%of total population),the remaining continents display much higher values(above 15%),albeit showing different tendencies in time.It is im-portant to note that this percentage remains relatively constant while in Africa total population has grown 6-fold in this period.
In the Americas the share of exposed population increases quite markedly after 1940,to reach 23%in 2000(highest value among all continents).This increase is especially driven by urban and population growth in Central and South America,on the Paci fic margin where seismic hazard levels are highest.
Oceania displays the highest value in 1900(22%),which decreases to 18%by year 2000,due to faster population growth in Australia,where maximum seismic intensity level is VII.
Exposure in Asia remains relatively high around 20%in this period,with a slight decrease from 1960.Below,this analysis by continent will be further re fined.
Table 4 and Figure 6 illustrate the evolution of population exposed to seismic hazard,inAfrica,byfocusingonchangesinpopulationdensityandexposuretohighest hazard.

Table 4:Zones of seismic hazard in the EQUAGEO map,their respective area and population densities in 1900 and 2000 for Africa.
Results show that although zones 3 and 4 occupy a very small share of Africa’s area(about 1.5%),their population density is much higher than the continent’s average.In zone 3(level VIII)the population density is the highest,and has increased very signi ficantly from 1900 to 2000.Figure 6 shows that changes in exposure in zones 3 and 4 increased dramatically after 1950,and especially after 1960(above 27%increase each decade,the highest of all continents),albeit generally following overall population increase.However,exposure in zone 3 increased above the general population on most decades,whereas in zone 4(IX–XII)this has only occurred in the 1970s and 1980s.More recently,exposure change rates are lower than the continent’s average,indicating that population is growing faster in lower hazard zones,but these values are still very high.In Africa,the share of total population exposure to severe seismic hazard is the lowest of all continents.
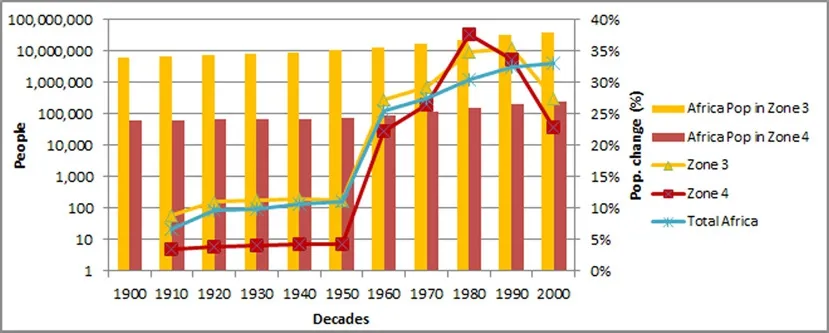
Figure 6:Evolution of population exposed to highest seismic hazard,in Africa.

Table 5:Zones of seismic hazard in the EQUAGEO map,their respective area and population densities in 1900 and 2000 for Asia.
In Asia(Table 5 and Figure 7),the population density has been highest in zone 4 throughout the century,and the share of land surface occupied by seismic zones 3 and 4 is the largest of all continents(about 13%).Relative changes in exposure in these zones have been very high,especially since the 1950s,but largely following overall population change.Since the 1970s,exposure in zone 3 has been increasing above the overall rate.These factors result in a population exposed(790 million)to these levels of seismic hazard that is largest than that in all other continents combined.
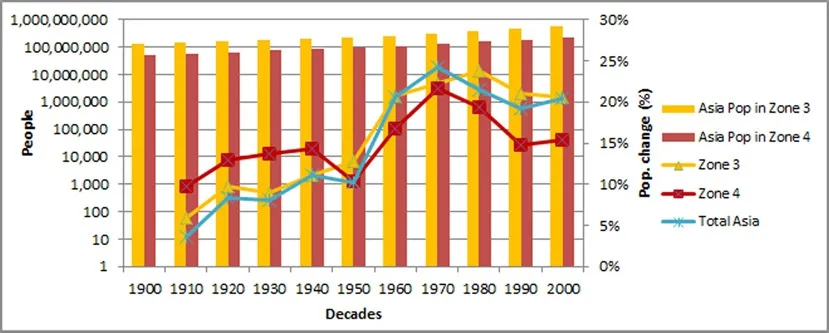
Figure 7:Evolution of population exposed to highest seismic hazard,in Asia.

Table 6:Zones of seismic hazard in the EQUAGEO map,their respective area and population densities in 1900 and 2000 for the Americas.
In the Americas(Table 6 and Figure 8)population density in zone 4 has suffered the highest increase and in 2000 is almost four times the overall average.Density in zone 3 is also quite high and had the second-highest increase.Changes in Relative exposure in these zones have been above the overall population change rates since the 1920s,with a 34%increase in zone 4 in the 1990s.This contributes to the Americas having the highest relative increase in severe population exposure among all continents,in the period under analysis,with 188 million people estimated to be living in zones 3 and 4 in 2000.This translates into being the second continent most exposed,after Asia.
In Europe(Table 7 and Figure 9),although zone 4 occupies a very small share of the total surface(0.6%),its population density has increased the most between 1990 and 2000 and became the highest in the latter date.While this density is not much greater than the overall density,this value is already quite high in this continent.Concentration of population in zone 3 had the second highest increase,and change rates in both zones have been signi ficantly above those for the continent for most of the century(from 1910s to 1980s),but have slowed down considerably in subsequent decades.

Figure 8:Evolution of population exposed to highest seismic hazard,in the Americas.
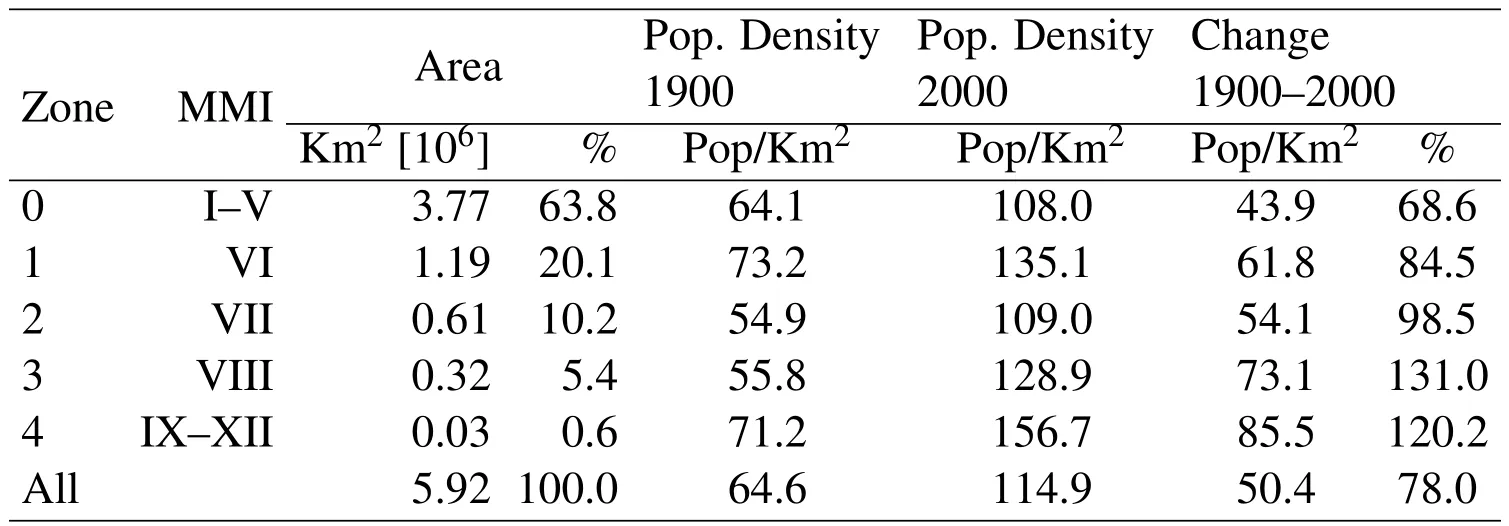
Table 7:Zones of seismic hazard in the EQUAGEO map,their respective area and population densities in 1900 and 2000 for Europe.
Table 8 and Fig.10 show that in Oceania population densities in zones 3 and 4 are about three times that the continent’s average,but have increased slower than in other zones.Exposure change rates in both zones have generally followed overall population change,with values in zone 3 being slightly higher in last four decades of the century.
Due to the small population of Oceania,the total population exposure in 2000 to severe seismic hazard is the lowest of all continents(5 million),with relative exposure showing a tendency to decrease.

Figure 9:Evolution of population exposed to highest seismic hazard,in Europe.

Table 8:Zones of seismic hazard in the EQUAGEO map,their respective area and population densities in 1900 and 2000 for Oceania.
Population exposure to seismic hazard differs signi ficantly per continent.In Europe,increase in seismic exposure is relatively low due to slow population growth.Population has not increased dramatically in the period under analysis and a large proportion of people already live in urban areas.The population growth in the Americas is higher than in Europe and similarly so much of its population is urbanized.European and American economies may still require the construction of physical infrastructure that expand exposure.Asia and Africa,on the other hand,are still largely rural and population growth is the highest if compared to the other continents.Most of the overall increase will occur in Asia due to the sheer increase of the population and projected increase of their economies.
3.3 Population exposure and risk of megacities
This section addresses population trends in current megacities[UN(2006)]as a hotspot of risk to natural hazards.It also discusses the need for better structural vulnerability assessment in megacities and argues for an extension of analyses to the fast growing cities and settlements in hazard prone areas.
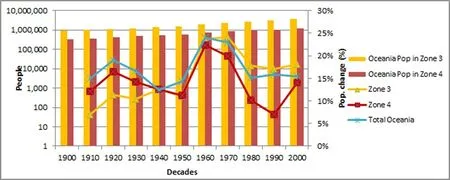
Figure 10:Evolution of population exposed to highest seismic hazard,in Oceania.
Megacities are important hotspots for seismic risk due to the high density of people,physical assets and services that may be harmed by one single earthquake.The analysis of historical earthquakes in large cities over the past,that of megacities seismic hotspots[Wenzel,Bendimerad,and Shina(2007)],as well as the sheer populationgrowthindicatethatfuturesingleearthquakeshavethepotentialtocause the staggering value of 1 million fatalities[Bilham(2009)].
Population totals and seismic hazard zones are not the only predictors of mortality.Seismic risk is also a function of structural vulnerability that,by and large,is driven by overall wealth of society.The high income countries such as Japan have invested in planning and building codes to make their building stock resilient to the destructive power of the quakes.The building stock in rapidly expanding cities of low income countries is reported as of not always including the seismic building standards as construction occurs as informal settlements outside the planning regulations and thus unable to withstand the destructive energy of earthquakes and other hazards[UNISDR(2015)].It is the collapse of the building stock that generates most of the casualties in earthquake disasters.
Earthquakes may trigger other natural hazards.Earthquakes that occur in cities located on fault lines on foothills and in mountain areas trigger landslides that may interrupt roads and lifelines.Additional effects may include the generation of arti ficial dams that in turn generate hydrological hazard.The earthquakes occurring offshore of coastal cities may trigger the much devastating tsunamis.The occurrences of two of the most devastating tsunamis ever[Indian Tsunami(2004);Tohoku Tsunami(2011)]are a sobering reminder that earthquakes generate secondary hazards that may impact way beyond the footprint of the earthquake.Ten of the 15 megacities analyzed below are located on continental edges even if only few are susceptible to tsunamis.
The growth of cities cannot be stopped.It is the result of natural population growth due to the region’s fertility rate as well as urbanization that is moving the center of economic production towards urban areas.The projections are signi ficant.Population will increase by two billion in the next 30 years[UN(2012)–Population Revision].This population will all require housing as well as infrastructure for the functioning of their economies.The forecast for new constructions over the next 30 years varies considerably.However,considering the growth of the global economy,and the demand for housing due to population increase and urbanization,it is projected that the “to-be-built”building stock in the next 30 years may be larger than the total building stock existing today.The way that future building stock will be built will by and large determine the future seismic risks[Bilham(2009)].
Seismic risk can just not be eliminated.The frequency and intensity of earthquakes(the hazard)is driven by geological processes that change slowly in time.The increase in exposure,of population and physical assets,will continue unabated.It is only the vulnerability of people and the susceptibility of its assets that we may act upon[UNISDR(2015)]and that is heavily dependent on the availability of resources,governance,and equally important on the understanding of both the physical sciences that underpin seismology as well as demography and demographic trends which are addressed in this paper.
The spatial location of population and physical exposure and its temporal trends need to be better detailed.Despite the wide availability of population information,most is not available at the spatial detail required for modeling risks.That applies also for the building stock.Understanding the trends in both population and physical exposure is important for at least two reasons.First,spatial-and time-consistent measures of population and physical exposure are used in risk modeling.Second,the population and exposure figures in space and time are used to normalize disaster loss data[IRDR(2015)]and to derive indicators for the three major international conventions to be signed in 2015 namely,the post-2015 framework for disaster risk reduction,sustainable development goals and climate change.In fact,as anticipated by Bilham(2004,2009)and con firmed through models combining expected seismic hazard and growing exposures and vulnerabilities,the largest seismic disasters are yet to unfold[UNISDR(2015)].
Finally,it is the scienti fic findings that need to be made available,with proper language,to the practitioners and decision makers.Mainstreaming disaster management in resilience and making a development agenda is proposed as the only alternative to reduce risk[UNISDR(2015)].
3.4 Evolution of population exposure for megacities,1950–2010
Of the existing twenty megacities in 2005[UN(2006)]only five are not located in zones of signi ficant seismic hazard;three cities are located in zone 1,six in zone 2,four in zone 3,and 2 in zone 4(Tokyo and Osaka)(Fig.11).

Figure 11:Population growth(in thousands)between 1950 and 2010 in 15 megacities,symbolized based on their respective seismic zones.
The increase in megacities population between 1950 and 2010 is over 30 million people in each of the earthquake intensity zones 1,3 and 4;and exceeds 80 million for earthquake zone 2.The population growth of megacities in the past 60 years has been phenomenal and unprecedented,although varying across countries and continents.
Some megacities may still add population and physical assets,while others may experience limits to the expansion due to topography and water bodies.Cities such as Tokyo and Osaka have clearly shown a diminishing rate of expansion(Fig.11).This in part due to geographical constraints in the expansion of the city and low national fertility.Most of the other megacities will continue to expand due to a combination of high population growth rates and urbanization process driven by economic concentration of activities in urban areas.
That population growth is accompanied with an increase in the building stock.Up to 1950 most of the building stock of the world was not engineered to withstand the impact of seismic hazard.The seismic building codes came later also for megacities in high income countries.High income and high seismic risk countries have started to implement codes after major disasters,often caused by earthquakes of not particularly high intensity.Italy for example de fined building codes after the 1976 Friuli earthquake and those codes have started to be implemented in the 1980’s.Low income countries have followed whenever possible the code standards.
Large part of the building stock in the megacities of the developing world is built without seismic building codes.This is due a number of reasons that include the lack of up to date seismic maps that would de fine the areas where codes need to be enforced,the inexistence of codes,the inability to implement the codes due to financial restrictions,or to enforce the building codes due to poor governance.The building stock of many low income countries is often informal and thus does not follow any formal construction rules.The structural fragility of the building stock maybethemaindriveroffutureearthquakemortalityandthemostdif ficultvariable to estimate in disaster risk modeling because so little data is available on both the extent of the built up and the structural characteristics of the built up.
Megacities are not the only urban areas that grow.About 75%of the current population is located in centers with less than 750,000 people,and most of future population growth will occur around smaller urban centers[UN(2012)].However,it is the large cities that may approach megacity size or the very high number of medium size cities that constitute the locations where the built environment will expand fastest.It is that growth that cumulatively adds to most of urban growth and exposure today[Cross(2001)],and much of that growth takes place in seismic hazard areas[Jackson(2006)].
Unfortunately,datasets for medium and small-sized cities and smaller settlements are seldom available for use in exposure and risk assessments.Remote sensing at medium and high resolution has started to address the lack of exposure data.For example,a wall-to-wall,detailed human settlement map of Europe is available at scale of 1:50:000[Ferri et al.,(2014);Florczyk,Ferri,Syrris,Kemper,Halkia,Soille,and Pesaresi(2015)]and are being produced for the world,for several epochs[Pesaresi,Ehrlich,Ferri,Florczyk,Freire,Haag,Halkia,Julea,Kemper,and Soille(2015)].These new datasets will provide new insights on the amount of built up that is exposed to natural hazards.Those human settlement datasets are used for both physical exposure mapping as well as for disaggregating coarse scale population data[Freire,Kemper,Pesaresi,Florczyk,and Syrris(2015)]for generating finer population exposure maps.This reality calls for new tools and geodata from the Disaster Risk Management community.
4 Conclusions and outlook
This paper investigates spatio-temporal changes and trends in population exposure to seismic hazard and implications for impacts and losses.Spatial analysis was used to combine historical population distributions with a global seismic intensity map to assess human exposure to this hazard throughout the XX century.The evolution of victims was also analyzed,while controlling for the progress in frequency and magnitude of hazard events.Analyses were carried out at the level of the globe,of individual continents,and of megacities,with a special focus on the zones potentially subjected to severe shaking(Intensity VIII+).
Results show that globally,population in zones of severe seismic hazard has been growing above overall population growth rates,increasing its share from 14%to 17%of the total.Population density is also highest in seismic zone 4.This will eventually increase the contribution of this component to impacts and losses.Growth rates of severe exposure have been highest in the Americas,Asia,and Oceania,with absolute population exposure and density being highest in Asia.However,the Americas have experienced the highest relative increase in severe population exposure among all continents,in the period under analysis.
Most of the world’s megacities have signi ficant exposure to seismic hazard and related secondary threats.Rapid and widespread urbanization poses special challenges for disaster risk management,with emerging cities being dif ficult to map and monitor,despite being hot-spots of population exposure.This illustrates the relevance of population growth and exposure in risk assessment and disaster outcome,and underlines the need for conducting detailed and updated global mapping of settlements and population distribution.
Future developments should focus on two ambitious research avenues:(a)including the role of vulnerabilities on the analysis,especially structural one,to better approximate integrated disaster risk assessment;and(b)forecast future exposure to seismic hazard and risk by considering and including projections of population change and urban expansion.For the latter goal,the work by Seto,Güneralp,and Hutyra(2012)and Linard,Tatem,and Gilbert(2013)deserve mention as important efforts in that direction.
Also,given the availability of European seismic catalogues covering a wider time window,a more detailed analysis is possible in Europe.
Acknowledgement:The work presented here is supported by the EC JRC in-stitutional research projectsGlobal Human Settlement Analysis for Disaster Risk Reduction(GLOB-HS)andEuropean Urban Development and Territorial Cohesion(E-URBAN).
The authors gratefully acknowledge the comments and suggestions of two anonymous reviewers.
Adger,W.;Brooks,N.(2003):Does global environmental change cause vulnerability to disaster?inNatural Disasters and Development in a Globalizing World,ed.Mark Pelling(London:Routledge,19–42.
Alexander,D.(1996):The health effects of earthquakes in the mid-1990s.Disasters,vol.20,no.3,pp.231–247.
Alexander,D.(2006):Globalization of disaster:trends,problems and dilemmas,Journal of International Affairs,vol.59,no.2,pp.1–22.
Allen,T.I.;Wald,D.J.;Earle,P.S.;Marano,K.D.;Hotovec,A.J.;Lin,K.;Hearne,M.(2009a):An Atlas of ShakeMaps and population exposure catalog for earthquake loss modeling,Bull.Earthquake Eng.;vol.7,no.3,pp.701–718.
Allen,T.I.;Marano,K.D.;Earle,P.S.;Wald,D.J.(2009b):PAGER-CAT:A composite earthquake catalog for calibrating global fatality models,Seism.Res.Lett.,vol.80,no.1,pp.57–62.
Bilham,R.(1988):Earthquake and urban growth.Nature.Vol.336,pp.624–625.Bilham,R.(2004):Urban earthquake fatalities–a safer world,or worse to come?Seismol.Res.Lett.;vol.75,pp.706–712.
Bilham,R.(2009):The seismic future of cities,Bull.Earthquake Eng.,vol.7,pp.839–887.
Cross,J.A.(2001):Megacities and small towns:different perspective on hazard vulnerability.Environmental Hazards,vol.3,no.2,pp.63–80.
Center for International Earth Science Information Network(CIESIN)-Columbia University,United Nations Food and Agriculture Programme-FAO,and Centro Internacional de Agricultura Tropical-CIAT(2004).Gridded Population of the World,Version 3(GPWv3):Palisades,NY:NASA Socioeconomic Data and Applications Center(SEDAC).http://dx.doi.org/10.7927/H4639MPP.Accessed 1 Dec 2014.
Cutter,S.L.;Emrich,C.T.(2005):Are natural hazards and disaster losses in the U.S.increasing?EOS Trans.Am.Geophys.Union,vol.86.No.381,pp.388–389.
Dobson,J.E.;Bright,E.A.;Coleman,P.R.;Durfee,R.C.;Worley,B.A.(2000): LandScan:A global population database for estimating populations at risk.Photogrammetric Engineering and Remote Sensing,vol.66,no.7,pp.849–857.
Ferri,S.;Syrris,V.;Florczyk,A.;Scavazzon,M.;Halkia,S.;Pesaresi,M.(2015):A new map of the European settlements by automatic classi fication of 2.5-m resolution SPOT data,Proceedings of IGARSS 2014,Quebec,Canada,13–18 July 2014.
Florczyk,A.J.;Ferri,S.;Syrris,V.;Kemper,T.;Halkia,M.;Soille,P.;Pesaresi,M.(2015):A new european settlement map from optical HR/VHR RS data,forthcomingIEEE J-STARS Special Issue.(Accepted for publication)
Freire,S.;Aubrecht,C.(2012):Integrating population dynamics into mapping human exposure to seismic hazard.Natural Hazards&Earth Systems Sciences,vol.12,no 11,pp.3533–3543.
Freire,S.;Ferri,S.;Ehrlich,D.(2014):Assessing temporal changes in global population exposure and impacts from earthquakes.In S.R.Hiltz,M.S.Pfaff,L.Plotnick,A.C.Robinson(eds.),Proceedings of the 11th International ISCRAM Conference,pp.329–333.
Freire,S.;Kemper,T.;Pesaresi,M.;Florczyk,A.;Syrris,V.(2015):Combining GHSL and GPW to improve global population mapping,Proceedings of 2015 IEEE International Geoscience&Remote Sensing Symposium(IGARSS),26–31 July 2015,Milan Italy,IEEE,2015,pp.2541–2543.
GADM,v.2.0(Global Administrative Boundaries Database).Available at:http://www.gadm.org/.(last access:10 Jun 2014).
Goldewijk,K.K.;Beusen,A.;Janssen,P.(2010):Long-term dynamic modeling of global population and built-up area in a spatially explicit way:HYDE 3.1,The Holocene,vol.20,pp.565–573.
Goldewijk,K.K.;Beusen,A.;de Vos,M.;van Drecht,G.(2011):The HYDE 3.1 spatially explicit database of human induced land use change over the past 12,000 years.Global Ecology and Biogeography,vol.20,no.1,pp.73–86.
Huppert,H.;Sparks,S.(2006):Extreme natural hazards:population growth,globalization and environmental change,Phil.Trans.R.Soc.A,vol.364,pp.1875–1888.
IRDR(2015): Integrated Research on Disaster Risk:Measuring Losses from Disasters:Guidelines on Human and Economic Impact Indicators.(in Press)
Jackson,J.(2006):Fatal attraction:living with earthquakes,the growth of villages into megacities,and earthquake vulnerability in the modern world.Phyl.Trans.R.Soc.A,vol.364,pp.1911–1925.
Lerner-Lam,A.(2007):Assessing global exposure to natural hazards:progress and future trends,Environ.Hazards,vol.7,pp.10–19.
Linard,C.;Tatem,A.J.;Gilbert,M.(2013):Modelling spatial patterns of urban growth in Africa,Applied Geography,vol.44,pp.23–32.
MunichRe(1988): “EQUAGEO”:TheWorldMapofNaturalHazards,Munchener Ruckversicherungs-Gesellschaft(Munchener Re),Koniginstrasse 107,D-8000 Munchen 40,Germany.
Michetti,A.M.;Esposito,E.;Guerrieri,L.;Por fido,S.;Serva,L.;Tatevossian,R.;Vittori,E.;Audemard,F.;Azuma,T.;Clague,J.;Comerci,V.;Gurpinar,A.;Mccalpin,J.;Mohammadioun,B.;Mörner,N.A.;Ota,Y.;Roghozin,E.(2007):Intensity Scale ESI 2007,Mem.Descrittive della Carta Geologica d’Italia,Roma,74,53 pp.
NRC(National Research Council)(2007): Tools and methods for estimating populations at risk from natural disasters and complex humanitarian crises.Washington,DC:The National Academies Press.
NRC(National Research Council)(2006):Facing Hazards and Disasters:Understanding Human Dimensions.Washington,DC:The National Academies Press.
Peduzzi,P.;Dao,H.;Herold,C.;Mouton,F.(2009):Assessing global exposure and vulnerability towards natural hazards:the disaster risk index.Nat.Hazards Earth Syst.Sci.;vol.9,pp.1149–1159,doi:10.5194/nhess-9-1149-2009.
Pesaresi,M.;Ehrlich,D.;Ferri,S.;Florczyk,A.;Freire,S.;Haag,F.;Halkia,M.;Julea,A.M.;Kemper,T.;Soille,P.(2015):Global Human Settlement Analysis for Disaster Risk Reduction.Proceedings of the 36th International Symposium on Remote Sensing of Environment,11–15 May 2015,Berlin,Germany.
Small,C.;Naumann,T.(2001):The global distribution of human population and recent volcanism,Environmental Hazards,vol.3,pp.93–109.
Seto,K.C.;Güneralp,B.;Hutyra,L.R.(2012): Global forecasts of urban expansionto2030anddirectimpactsonbiodiversityandcarbonpools.Proceedings of the National Academy of Sciences.http://dx.doi.org/10.1073/pnas.1211658109.
Smolka,A.(2006):Natural disasters and the challenge of extreme events:risk management from an insurance perspective.Phil.Trans.R.Soc.A,vol.364,pp.2147–2165.
Sornette,D.;Werner,M.J.(2005):Apparentclusteringandapparentbackground earthquakes biased by undetected seismicity,J.of Geophys.Res.;vol.110,B09303,doi:10.1029/2005JB00362.
UN(United Nations)(2006):Department of Economic and Social Affairs,Population Division.World Urbanization Prospects:The 2005 Revision.Working Paper No.ESA/P/WP/200.http://www.un.org/esa/population/publications/WUP2005/2005WUPHighlights_Final_Report.pdf
UN(United Nations)(2012):Department of Economic and Social Affairs,Population Division:World Urbanization Prospects:The 2011 Revision.Final Report with Annex Tables.New York.
UNDP(United Nations Development Programme)(2004):Reducing Disaster Risk–A challenge for development–A Global Report,ISBN 92-1-126160-0,New York,USA.
UNEP/GRID(United Nations Development Programme/Global Resource Information Database),Available at:http://www.grid.unep.ch/index.php?lang=enUNISDR(United Nations International Strategy for Disaster Risk Reduction)(2009a): Global Assessment Report on Disaster Risk Reduction 2009.United Nations,Geneva,Switzerland.
UNISDR(United Nations International Strategy for Disaster Risk Reduction)(2009b): UNISDR Terminology on Disaster Risk Reduction.United Nations,Geneva,Switzerland.
UNISDR(United Nations International Strategy for Disaster Risk Reduction)(2013): Global Assessment Report on Disaster Risk Reduction 2013-From Shared Risk to Shared Value:the Business Case for Disaster Risk Reduction.United Nations,Geneva,Switzerland.
UNISDR(United Nations International Strategy for Disaster Risk Reduction)(2015):Global Assessment Report on Disaster Risk Reduction 2015.United Nations,Geneva,Switzerland.Available at:http://www.preventionweb.net/english/hyogo/gar/
USGS(United States Geological Survey)PAGER-Prompt Assessment of Global Earthquakes for Response,available at:http://earthquake.usgs.gov/earthquakes/pager/(Last access:17 Jan 2014).
Wenzel,F.;Bendimerad,F.;Shina,R.(2007): Megacities-megarisks.Nat.Hazards,vol.42,pp.481–491.Doi:10.1007/s11069-006-9073-2
Wieland,M.;Pittore,M.;Parolai,S.;Zschau,J.(2012):Exposure estimation from multi-resolution optical satellite imagery for seismic risk assessment,ISPRS Int.J.Geo-Inf.,vol.1,pp.69–88.
1European Commission,Joint Research Centre(JRC),Institute for the Protection and Security of the Citizen(IPSC),Global Security and Crisis Management Unit,Via Enrico Fermi 2749,21027 Ispra VA,Italy
 Computer Modeling In Engineering&Sciences2015年32期
- Computer Modeling In Engineering&Sciences的其它文章
- Comparison of Scenarios with and without Bridges and Analysis of Backwater Effect in 1-D and 2-D River Flood Modeling
- A Probabilistic Approach to Hazard Mapping Based on Computer Simulations.An Example for Lava Flows at Mount Etna
- A Framework for Comprehensive Impact Assessment in the Case of an Extreme Winter Scenario,Considering Integrative Aspects of Systemic Vulnerability and Resilience
- Modelling of Landslides:An SPH Approach