Multiobjective optimization of friction welding of UNS S32205 duplex stainless steel
P.M.AJITH,Birendr Kumr BARIK,P.SATHIYA,*,S.ARAVINDAN
aDepartment of Production Engineering,National Institute of Technology,Tiruchirappalli 620015,Tamilnadu,India
bDepartment of Mechanical Engineering,Indian Institute of Technology Delhi,New Delhi 110016,India
Multiobjective optimization of friction welding of UNS S32205 duplex stainless steel
P.M.AJITHa,Birendra Kumar BARIKa,P.SATHIYAa,*,S.ARAVINDANb
aDepartment of Production Engineering,National Institute of Technology,Tiruchirappalli 620015,Tamilnadu,India
bDepartment of Mechanical Engineering,Indian Institute of Technology Delhi,New Delhi 110016,India
The present study is to optimize the process parameters for friction welding of duplex stainless steel(DSS UNS S32205).Experiments were conducted according to central composite design.Process variables,as inputs of the neural network,included friction pressure,upsetting pressure,speed and burn-off length.Tensile strength and microhardness were selected as the outputs of the neural networks.The weld metals had higher hardness and tensile strength than the base material due to grain refinement which caused failures away from the joint interface during tensile testing.Due to shorter heating time,no secondary phase intermetallic precipitation was observed in the weld joint.A multi-layer perceptron neural network was established for modeling purpose.Five various training algorithms,belonging to three classes,namely gradient descent,genetic algorithm and Levenberg-Marquardt,were used to train artificial neural network.The optimization was carried out by using particle swarm optimization method.Confirmation test was carried out by setting the optimized parameters.In conformation test,maximum tensile strength and maximum hardness obtained are 822 MPa and 322 Hv,respectively.The metallurgical investigations revealed that base metal,partially deformed zone and weld zone maintain austenite/ferrite proportion of 50:50.
Artificial neural network;Duplex stainless steel;Hardness;Tensile test;Friction welding;Particle swarm optimization
1.Introduction
Duplex stainless steel has equal phase balance of approximately equal amounts of ferrite and austenite.It has a mixed microstructure consisting of ferrite(bcc)and austenite(fcc)phases.The duplex stainless steel exhibits higher resistance to stress corrosion cracking and has higher strength than austenitic stainless steel.As a result of these positive factors,the duplex stainless steel is widely used in the oil and gas,petrochemical,pulp and paper,and pollution control industries.It is well known that the duplex stainless steel exhibits good weldability,but the melting and solidification associated with fusion welding processes destroy the favorableduplex microstructure of this stainless steel[1,2].A major concern with fusion welding of duplex stainless steel is the formation of detrimental intermetallic phases at elevated temperatures.Sigma and chi phases form in duplex stainless steels at elevated temperature and precipitate preferably in the ferrite.This will considerably affect the toughness of the welded joint[3].The formations of these phases are due to the high chromium and molybdenum contents.The problem mentioned above can be overcome by employing solid state welding process like friction welding.
Friction welding is a solid state welding process.It makes use of frictional heat generated on the rubbing surfaces to raise the temperature at the interface,which is high enough to cause the two surfaces to be forged together at high pressure.Friction welding has significant economic and technical advantages.The present study utilized a continuous drive friction welding machine.In continuous drive friction welding,oneworkpiece is rotated at nominal constant speed and aligned with the second part at an applied pressure.The rotation and pressure are maintained for a specific period to ensure adequate thermal and mechanical conditioning of the interface region.Thereafter the rotation is stopped by forced braking,and at the same time the pressure is increased to forge the parts together.The application of an axial force maintains an intimate contact between the parts and causes the plastic deformation of the material near the weld interface.
http://dx.doi.org/10.1016/j.dt.2015.03.001
2214-9147/Copyright©2015,China Ordnance Society.Production and hosting by Elsevier B.V.All rights reserved.
The friction welding finds widespread industrial use as a mass production process for the joining of materials.Friction welding process allows welding of several materials that are extremely difficult to fusion weld.The friction welding process parameters play a significant role in making good quality joints[4].To produce a good quality joint,it is important to set up proper welding process parameters.Therefore,identifying the suitable combinations of process input parameters to produce the desired output requires many experiments,making this process time-consuming and costly[5].
So as to avoid this problem,various optimization methods can be applied to define the desired output variables by developing the mathematical models to specify the relationship among the input parameters and output variables. Generally,the quality of a weld joint is directly influenced by the welding input parameters during the welding process. Therefore,welding can be considered as a multi-input multioutput process.Though several studies have been made on weld quality by considering response variables separately,the report on simultaneous consideration of response variables in friction welding of DSS material is scarce.
Artificial neural network(ANN)is a modelling technique which is inspired by the structure and functional aspects of biological neural networks.It has been widely used for modelling manufacturing related problems.ANN eliminates the limitations of the classical approaches by extracting the desired information using the input data.Applying ANN to a system needs sufficient input and output data instead of a mathematical equation[6,7].ANN is a good alternative to conventional empirical modeling based on polynomial and linear regressions[8].Employing the neural networks models would lead to time and cost saving by predicting the experimental results[9].Sathiya et al.[10]used the evolutionary computational techniques optimize the friction welding parameters.The suggested methods were used to determine the welding process parameters by which the desired tensile strength and minimized metal loss were obtained in friction welding.They described how to obtain near optimal welding conditions over a wide search space by conducting a smaller number of experiments.Paventhan et al.[11]have done the optimization of friction welding process parameters for joining carbon steel and stainless steel.They developed an empirical relationship to predict the tensile strengths of friction welded AISI 1040 grade medium carbon steel and AISI 304 austenitic stainless steel,incorporating the process parameters,namely friction force,forging force,friction time and forging time which have greater influence on strength of the joint.Response surface methodology was applied to optimize the friction weldingprocessparameterstoattainmaximumtensile strength of the joint.Koen et al.[12]developed a new welding method for fully automatic pipelines girth welding using a new friction welding machine.The proposed new welding procedure,called Friex,is a new variant of the well-known friction welding process.An intermediate ring is rotated between the pipes to be welded to generate the heat necessary to realize the weld.Luo et al.[13]designed a mixed-integrated approach to control the welding flashes in the continuous drive friction welding on small diameter tubes and then eliminate the problems of the inner friction welding flashes.Experimental results show that this mixed-integrated approach is used to reduce the sum of the inner welding flashes to control the crimping direction of the friction welding flashes,which promotes the forming of the outer friction welding flashes. Udayakumar et al.[14],carried out the experimental investigation on super duplex stainless steel and attempted to develop the mathematical models based on response surface methodology in order to predict the corrosion current and impact strength as a function of key input parameters in the friction welding process.They found that the friction force is a significant parameter for changing the impact strength.Friction force and burn-off length have a negative effect on impact strength.As the friction force increases,the impact strength decreases.
In a very recent investigation,an attempt has been made to optimize the process parameters of activated tungsten inert gas(ATIG)welding process for ASTM/UNS S32205 DSS joints to obtain desirable aspect ratio and average ferrite number(FN). This investigation revealed that,the joints were produced by the optimized process parameters and their average ferrite number(FN)in the weld zone is 71.62,and the ferrite content is approximately 50.674%which is well within the acceptable range[15].
From the above literatures,a very few investigations were carried out on friction welding and the parameter optimization of duplex stainless steel using evolutionary algorithms like artificial neural networks(multiobjective optimization).The aim of this work is to predict and optimize the friction welding parameters of UNS S32205 duplex stainless steel using ANN and PSO.The input(factors)parameters were friction pressure(FP),upsetting pressure(UP),rotational speed(N)and burnoff length(BOL),and the responses were tensile strength(TS)and hardness.The five training algorithms selected were batch back propagation(BBP),incremental back propagation(IBP),quick propagation(QP),Levenberg-Marquardt(LM),and genetic algorithm(GA).Among the five algorithms,the QP algorithm had a better performance.The QP algorithm was applied to the ANN network for modeling of friction welding parameters and also to study the direct effect of the individual parameters.
2.Material and methods
The base material chemical compositions of UNS S32205 duplex stainless steel were analyzed using an optical emission spectrometer,and their values are presented in Table 1.

Table 1 Base material chemical composition(wt.%).
The friction welding parameters were chosen based on the preliminary welding trials and their parameter levels were categorized as low,medium and high.The upper and lower limits were identified and the different levels of process parameters are presented in Table 2.
The friction welding trials were conducted as per the central composite rotatable factorial design consisting of 30 sets of coded conditions[16].The microstructure samples were prepared as per the standard procedure.The samples were prepared by electrolytically etching them in 10%oxalic acid at 9 V for 30 s as per ASTM E3-11.The mechanical characteristics of friction welds were evaluated from tensile tests as per the ASTM E 8 standards.The tensile-tested samples are presented in Fig.1.Microhardness survey was carried out using a HMV-2000 Vickers microhardness tester at 500 g load for 10 s.
3.Methodology
Typical ANN model flow chart was used in this study,as shown in Fig.2.The basic steps considered for designing the neural network model are to collect the data required for training the network,designing the network architecture and training the network.
Alldatasetswereobtainedfromtheexperiments mentioned above and were divided into three parts,i.e.21,5 and 4 data as training data,testing data and validation data,respectively,which are summarized in Table 4.The training data were used to compute the network parameters.The Neural Power professional version 2.5 software tool was employed in this study.The models were developed to establish the input-output correlations of the friction welding of duplex stainless steel(DSS UNS S32205)using the neural networks.ANNs were constructed with layers of units,and thus termed multilayer ANNs.Multilayer perceptron(MLP)neural network consisted of input,hidden and output units.A single hidden layer network was used in this study.The optimum number of neurons in hidden layer was determined by a series of topologies,in which the number of neurons was varied from 1 to 30.The root mean square error(RMSE)was used as the error function.

Table 2 Upper and lower limits with different levels of the parameters.
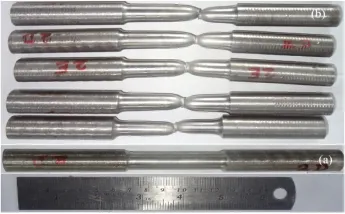
Fig.1.Tensile-tested weld samples.
Experimental data were used to train the network.Scaled data were passed into the input layer and then were propagated from input layer to hidden layer and finally to the output layer of the network.Every node in hidden or output layer first acted as a summing junction which combined and modified the inputs from the previous layer using the following equation.

where yiis the net input to node j in hidden or output layer;xiis the input to node j(or output of previous layer);wijis the weight representing the strength of the connection between the ith node and jth node;i is the number of nodes;and bjis the bias associated with node j.
In order to perform a supervised training,ANN output error between the actual and predicted output results could be evaluated.The following equations were used to find R,DC,AAPD and RSME.DC reflects the degree of fit for themathematical model.The DC shows the level of model fitness. If value of DC is closer to 1,the model is considered as a better design and fits to the actual data.
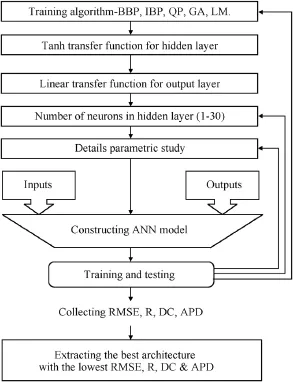
Fig.2.Typical ANN model flow chart.

Table 3 ANN algorithm setting for five learning algorithms.

where E=experimental value P=predicted value;E- is the mean value of Eiis the mean value of Pi.Coefficient of determination is

Average absolute percentage deviation(AAPD)is
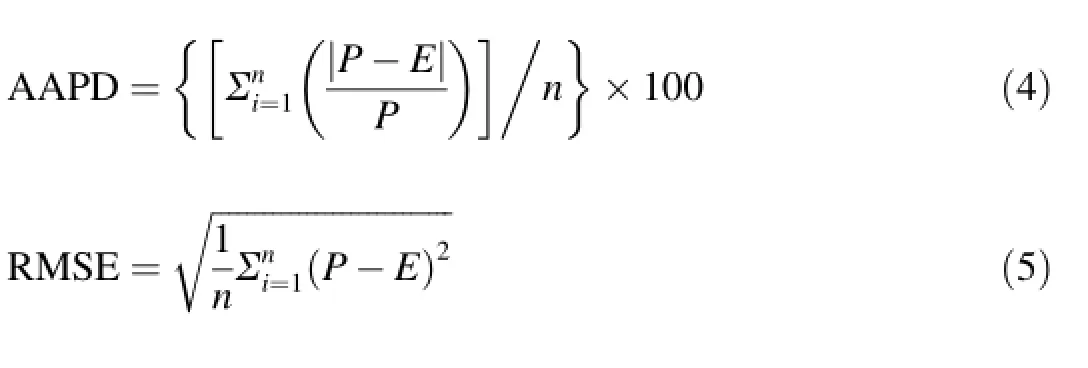
So,we considered the ANN model with lowest RMSE,AAPD and highest DC,R as the best ANN design.
3.1.Optimization procedure
Particle swarm optimization(PSO)was used to optimize the friction welding parameters and its flow chart for PSO is presented in Fig.3.The trained data obtained from ANN should be imported into PSO as the basic input data.
4.Results
4.1.Selection of the best neural network model
The results for various algorithms are summarized and presented in Table 3.As shown in Table 3,the QP algorithm has a better performance relative to BBP,IBP,LM and GA algorithms.Fig.4 shows the plots of ANN predicted response versus actual response with QP algorithms for the training and testing data.From Fig.4 it is seen that the calculated and observed hardness's and tensile strengths have almost the same values for QP algorithms.
The percentages of contribution to the individual input parameters are presented in Fig.5.
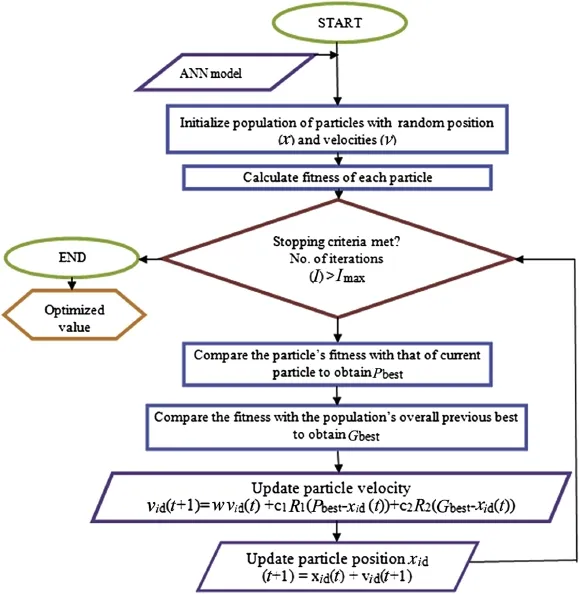
Fig.3.Flow chart of PSO.

Fig.4.Training and testing data with experimental results for TS and mH using QP model.
From Fig.5,it can be seen that the upsetting pressure is the most significant parameter followed by the friction pressure, speed of rotation and born-off length.The percentage contributions of individual parameter are upsetting pressure of 47.05%,friction pressure of 25.99%,speed of rotation of 21.96%and burn-off length of 4.96%.

Fig.5.Percentages of contribution to the input parameters using QP model.
4.2.Effects of process parameters
The effects of upsetting pressure and friction pressure on tensile strength and microhardness are presented in Fig.6.
From Fig.6(a)it is seen that the friction pressure varied from 45 MPa to 125 MPa and the upsetting pressure varied from 155 MPa to 185 MPa,and,the hardness and tensile strength increased at maximum friction pressure Maximum tensile strength obtained was 825 MPa at friction pressure of 185 MPa and upsetting pressure of 105 MPa.In Fig.6(b),the obtained maximum microhardness was 323 MPa at friction pressure of 85 MPa and upsetting pressure of 105 MPa.The predicted model using quick propagation algorithm was fitted so well to the actual values for both training and testing set. Therefore,it could be suggested that the model trained with QP algorithm is the most efficient model for this problem;hence this model was applied for further application.It was reported that the quick propagation learning algorithm could be adopted for the training of all the ANN models[17].Thepredicted values of the best model for training and testing set are presented in Table 4.

Fig.6.Effects of friction pressure and upsetting pressure on TS and Microhardness(mH).

Table 5 Results of confirmation test.
From Table 4,it is clearly seen that the testing and training data are very closer to the experimental results.So QP model is the most appropriate method to predict the effect of the individual parameters of friction welding process.The input parameters were obtained from the QP model and fed in to the PSO algorithm to get the optimized values.The optimized values of friction pressure,upsetting pressure,rotational speed and burn-off length are 105 MPa,180 MPa,2000 rpm and 3.9 mm,respectively.The tensile strength of 827.17 MPa and the hardness of 325.61 Hv were obtained.
4.3.Results of confirmation test
因为城本来是不大的,有许多熟人,也都是来看灯的都遇到了。其中我们本城里的在哈尔滨念书的几个男学生,他们也来看灯了。哥哥都认识他们。我也认识他们,因为这时候我们到哈尔滨念书去了。所以一遇到了我们,他们就和我们在一起,他们出去看灯,看了一会,又回到我们的地方,和伯父谈话,和哥哥谈话。我晓得他们,因为我们家比较有势力,他们是很愿和我们讲话的。
In order to further validate the obtained results,the confirmation test was carried out to verify the PSO model results.The results of confirmation test are shown in Table 5.
From Table 5,it is seen that the results obtained from test is very close to the results of PSO.The photograph and macrograph of optimized friction welded sample are presented in Fig.7(a)and(b).
The different zones of microstructures for optimized parameters are presented in Fig.8.
The joint interface is called as the weld zone(WZ)and the adjunct side is called as the partially deformed zone(PDZ)and also unaffected base metal(BM).The percentage of ferrite phase was measured using Fischer Feritscope MP 30 and average ferrite values are presented in Table 6.
The microhardness test was carried out along the longitudinal direction of the joint interface with load of 500 g and dwell time of 10 s.The microhardness profile is shown in Fig.9.
Fig.10 presents the SEM fracture surface of the confirmation tensile tested sample.The fracture of tensile weld sample takes place away from the joint interface.
The XRD pattern of optimized parameter weld zone is presented in Fig.11.
5.Discussions

Fig.7.Confirmation test.

Fig.8.SEM micrograph of different zones of friction weld joint..

Table 6 Austenite-to-ferrite values in different weld zones.
In the real time engineering applications of manufacturing industries,the selection of proper process parameters plays a crucial role in making quality products.In this study,the friction welding process parameters were optimized using PSO.The best result was obtained from QP algorithm with 4-4-2 topology that had minimum RMSE and AAP,maximum R and DC for both training and testing sets.From Fig.4,it is seen that a good agreement was made on predicted values with observed values of QP algorithms.Fig.5 shows that the joint performance of the friction welded joint mainly depends on the upsetting and friction pressures.Because of more refined grain formation during the high UP,a large amount of heat is generated.Fig.6(a)and(b)revels that more heat was generated at higher friction pressure and also more soften state was obtained.It was also observed that,when the upsetting pressure was high,less amount of soften material was retained in the weld zone.The grains were finer due to the faster cooling rate in the weld and HAZ regions.Coarse grains were observed at low upsetting pressure because of slow rate of cooling.The weld zone consisted of finer grains,while the adjunct side PDZ had the coarse grains.The refinement of grains in the weld zone was due to dynamic recrystallization and also due to higher temperature in the peripheral region[18].
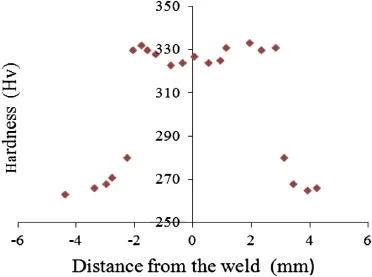
Fig.9.Microhardness profile for optimized parameter.
During the friction welding,heat generated at both ends of the metal rod is high.Due to this,the ends of the rods are in red hot or plastic stage.Later the upsetting pressure is applied and welding is completed with immediate atmospheric air cooling.

Fig.10.SEM fracture surface of tensile tested sample.

Fig.11.XRD pattern of optimized parameter weld zone.
So the simultaneous effect of short time cooling and high upsetting pressure will result in the formation of fine grains in PDZ and WZ regions.Another advantage is of the short timecooling prevents the phase changes.Therefore optimum amount of austenite was reformed.Table 6 reveals that the austenite-to-ferrite ratio is 50:50 in the three zones of the weld like BM,PDZ and WZ.It was found that hardness and tensile strength was mostly influenced by an interactive effect of upsetting pressure and heating pressure.
From the confirmation experiment it is observed that PSO resultsareingoodagreementwiththeexperimentalresults.The deviationoftheexperimentalvalueswaslessthan2%compared with optimized PSO results of tensile strength and microhardnessvalues.Fig.8(a)and(b)revealthattheweldingcarriedwith the optimized values resulted in nowelding defects like cavities and cracks in the interface.Presence of secondary phases in duplex stainless steel microstructure can be very harmful for its corrosion resistance.No secondary intermetallic phases were found from Fig.8.From Fig.9,it is seen that PDZ has higher hardness values than that of WZ and base material.It is due to therefinementofgrainsoccurringinPDZ.Thiscanbeattributed to work hardening effect caused by heavy deformation in PDZ[19].The measured average grain sizes for BM,PDZ and WZ wereintheorderof28.7,10.6and22.3microns,respectively.In thetensiletestedsample,thefractureoccurredinbasemetaland was away from the joint zone.The tensile strength of the weld jointwasmuchhigherthanthatofthebasemetal(750Mpa).The maximum tensile strength obtained using optimized parameters was 827.17 Mpa and the experimental value was 822 Mpa.The strength and hardness were increased due to grain refinement in WZ and PDZ.It is also revealed that the hardness and tensile strength values are higher in both WZ and PDZ.Fig.10 reveals that the ductile fracturewas appeared and also the dimpleswere found.The dimples were elongated in the stress direction.Due to the high amount of ferrite content and more amounts of dimples present in the weld zone,the tensile strength of the joints is much higher than the strength of base material.Fig.11 reveals that the identified peaks represent the presence of only ferrite and austenite.No other intermetallic phases were identified in the XRD pattern.Less plastic state and slow cooling time restricted the weld zone phase transformation.
6.Conclusions
From this investigation the following conclusions are drawn:
1)The percentage contributions of input parameters are: upsetting pressure=47.05%,friction pressure=25.99%,speed of rotation=21.96%,and burn-off length=4.96%.
2)PDZ has the finer grain size compared to the weld zone and base material.
3)Austenite and ferrite phases are present in the weld zone.
4)The tensile strength of the friction joint(optimized)is higher than the base material strength and the fracture occurred is in ductile nature.
5)Higher hardness values were obtained in PDZ compared to WZ and BM.This is due to the refinement of grain size in the weld region.
6)The austenite-to-ferrite ratio is 50:50 for three zones of the weld like BM,PDZ and WZ.
[1]TMR Stainless.Practical guidelines for the fabrication of duplex stainless steels.London:International Molybdenum Association;2009. p.1-69.
[2]Jenney Cynthia L,Annette O'Brien.Welding handbookvol.2.Miami F L:AWS:American Welding Society;1991.p.523-30.
[3]Olson David Leroy,Siewert Thomas A,Liu Stephen,Edwards Glen R. ASM handbook,vol.6.Materials Park:ASM International;1995. p.1130-52.
[4]Dunkerton SB.Toughness properties of friction welds in steels.Weld J 1986;8:193-201.
[5]Balamurugan Karupanan,Mishra Mahendra Kumar,Sathiya Paul,Sait Abdullah Naveen.Weldability studies and parameter optimization of AISI 904L super austenitic stainless steel using friction welding.Mater Res 2014;17(4):908-19.
[6]Mandal S,Sivaprasad PV,Venugopal S,Murthy KPN.Artificial neural network modeling to evaluate and predict the deformation behavior of stainless steel type AISI 304L during hot torsion.Appl Soft Comput J 2009;9(1):237-44.
[7]Ali Akcayol M,Cinar Can.Artificial neural network based modeling of heatcatalyticconverterperformance.ApplThermEng 2005;25(14-15):2341-50.
[8]Erdogan Kose.Modelling of colour perception of different age groups usingartificialneuralnetworks.ExpertSystAppl 2008;34(3):2129-39.
[9]Shabanzadeh Parvaneh,Norazak Senu,Shameli Kamyar,Ismail Fudziah,Maryam Mohagheghtabar.Application of artificial neural network(ANN)for the prediction of size of silver nano particles prepared by green method.Dig J Nanomater Biostructures 2013;8(2):541-9.
[10]Sathiya P,Aravindan S,Noorul Haq A,Paneerselvam K.Optimization of friction welding parameters using evolutionary computational techniques.J Mater Process Technol 2009;209(5):2576-84.
[11]Paventhan R,Lakshminarayanan PR,Balasubramanian V.Optimization of friction welding process parameters for joining carbon steel and stainless steel.J Iron Steel Res Int 2012;19(1):66-71.
[12]Faes Koen,Dhooge Alfred,De Baets Patrick,Van Der Donckt Eric,De Waele Wim.Parameter optimisation for automatic pipeline girth welding using a new friction welding method.Mater Des 2009;30:581-9.
[13]Luo J,Ye YH,Xu JJ,Luo JY,Chen SM,Wang XC.A new mixedintegrated approach to control welded flashes forming process of damping-tube-gland in continuous drive friction welding.Mater Des 2009;30:353-8.
[14]Udayakumar T,Raja K,Afsal Husain TM,Sathiya P.Prediction and optimization of friction welding parameters for super duplex stainless steel(UNS S32760)joints.Mater Des 2014;53:226-35.
[15]Magudeeswaran G,Nair Sreehari R,Sundar L,Harikannan N.Optimization of process parameters of the activated tungsten inert gas welding for aspect ratio of UNS S32205 duplex stainless steel welds.Def Technol 2014;10:251-60.
[16]Montgomery DC.Design and analysis of experiments.7th ed.Wiley;2009.
[17]Jain Sanjay K,Archana Sarkar,Vaibhav Garg.Impact of declining trend offlowonHarikeWetland.India.WaterResourManag 2008;22(4):409-21.
[18]Satyanarayana VV,Madhusudhan Reddy G,Mohandas T.Dissimilar metal friction welding of austenitic-ferritic stainless steels.J Mater Process Technol 2005;160:128-37.
[19]Satyanarayana VV,Madhusudhan Reddy G,Mohandas T.Continuous drive friction welding studies on AISI 304 austenitic stainless steel welds.MaterManufProcess2004;19:487-505.http://dx.doi.org/ 10.1081/AMP-120038657.
4 August 2014;revised 16 February 2015;accepted 3 March 2015
Available online 27 March 2015
.Tel.:+91 431 2503510;fax:+91 431 2500133.
E-mail address:psathiya@nitt.edu(P.SATHIYA).
Peer review under responsibility of China Ordnance Society.
Copyright©2015,China Ordnance Society.Production and hosting by Elsevier B.V.All rights reserved.
- Defence Technology的其它文章
- Effect of tool pin profile on microstructure and tensile properties of friction stir welded dissimilar AA 6061-AA 5086 aluminium alloy joints
- Microstructure and pitting corrosion of armor grade AA7075 aluminum alloy friction stir weld nugget zone-Effect of post weld heat treatment and addition of boron carbide
- Variation of chemical composition of high strength low alloy steels with different groove sizes in multi-pass conventional and pulsed current gas metal arc weld depositions
- Friction stir surfacing of cast A356 aluminium-silicon alloy with boron carbide and molybdenum disulphide powders
- Theoretical study of BTF/TNA cocrystal:Effects of hydrostatic pressure and temperature
- Microstructure and pitting corrosion resistance of AA2219 Al-Cu alloy friction stir welds-Effect of tool profile

