
介质黏滞性质对余震活动影响的数值模拟
2015-10-12 02:30曲均浩蒋海昆
地震地质 2015年1期
曲均浩 蒋海昆 宋 金 李 金
1)中国地震局地质研究所,北京 100029
2)山东省地震局,济南 250014
3)中国地震台网中心,北京 100045
4)新疆维吾尔自治区地震局,乌鲁木齐 830011
介质黏滞性质对余震活动影响的数值模拟
曲均浩1,2)蒋海昆3)宋金3)李金4)
1)中国地震局地质研究所,北京100029
2)山东省地震局,济南250014
3)中国地震台网中心,北京100045
4)新疆维吾尔自治区地震局,乌鲁木齐830011
假定主震破裂面上残余凹凸体的破裂导致余震,残余凹凸体尺度符合分形分布,在破裂面上随机分布,残余凹凸体破裂/失稳强度符合对数正态分布;以岩石圈下部粘弹介质震后应力松弛作为导致残余凹凸体破裂的动力输入,加载应力按负指数形式衰减;以库仑破裂准则作为失稳判据,考虑残余凹凸体破裂对附近区域的应力加载,在不同条件下模拟生成包含时、空、强三要素的人工“余震”序列。通过G-R关系及修改的大森公式,检测模拟输出与实际余震活动统计特征的吻合程度,以此作为进一步调整模型参数的依据。在此基础上重点讨论介质黏滞性质对余震活动的影响。结果显示:表征岩石物理特性的黏滞系数对余震活动持续时间、衰减快慢起重要的控制作用,黏滞系数与衰减系数之间显示负指数的相关关系。余震序列G-R关系与黏滞系数关系不大,主要受控于残余凹凸体的尺度分布,即与构造不均匀性关系更为密切。
主震破裂面余震活动残余凹凸体应力松弛黏滞系数
0 引言
大地震发生后,在震源区及邻近区域会观测到大量的余震活动。余震活动满足2个重要的统计关系,一个是描述地震震级、频度之间关系的G-R关系,另一个是描述余震随时间衰减特征的修改的大森公式。介质状况和应力分布的不均匀性及其相互作用,是影响余震活动的重要因素(Mogi,1962a,b;Scholz,1968a,b,c),以此为基础,许多研究从不同角度来解释余震活动机理:1)从介质不均匀性的角度,普遍接受的事实是,余震是残余凹凸体的进一步破裂(Kanamori,1981;Kisslinger et al.,1991;Somerville et al.,1999);2)从应力变化的角度,速率-状态依从、亚临界裂纹扩展、蠕变或余滑模型等认为主震造成的断层应力变化是余震发生的主要原因(Dieterich,1994;Huc et al.,2003;Kanamori et al.,2004),但也有研究者通过对实际余震观测资料的研究,认为主震造成的应力变化并非是控制余震发生的主要原因(Gasperini et al.,1989;Helmstetter et al.,2003),或者此种控制作用非常微弱(Peng et al.,2009);3)主震断层滑动引起的孔隙流体扩散,也被认为是余震发生的重要诱因,余震频次与孔隙压变化之间存在一定的关系(Nur et al.,1972),但由于构造物理实验中干燥岩石受压也能产生类似主-余型地震序列的声发射序列,因而尽管流体对余震发生具有重要作用,但不一定是余震产生的必要因素(Hirata,1987)。总体来看,目前尚无单一的模型能够完全解释余震活动现象(Kanamo-ri,2004;Felzer,2010),更为重要的是,上述各种模型或理论用于余震研究时,均是针对所预设模型的应力变化来开展的,并未能够模拟得到真正的“余震”序列,从而也无法通过“余震”数据的直接计算,全面考察模拟结果与实际余震活动在时间及强度等方面统计特征的相似程度。所开展的与余震序列衰减有关的研究,亦是直接假定余震衰减率与应力的某种变化有关,例如Perfettini等(2004,2007)假定余震活动速率正比于蠕滑断层的滑动速率,Nur等(1972)则直接假定余震频次与孔隙压的时间偏微分成正比,进而解析得到大森公式参数与模型参数之间的关系。
从力学加载的角度,余震活动主要受同震应力触发(King et al.,1994;Harris et al.,1998;Stein et al.,1999)、震后余滑(Marone et al.,1991;Savage et al.,1997;Perfettini et al.,2004,2007;Hsu et al.,2006)以及震后震源区附近下地壳介质粘弹松弛(Deng et al.,1999;Freed et al.,2001;Pollitz et al.,2001)等因素的影响。同震应力触发对余震分布区域及余震规模有较好的解释(King et al.,1994;Harris et al.,1998;Stein et al.,1999;Toda,2005),而余滑或应力松弛过程则被认为是控制余震时间衰减特征的重要因素(Marone et al.,1991;Royden,1997;Sav-age et al.,1997;Deng et al.,1999;Freed et al.,2001;Pollitz et al.,2001;Hsu et al.,2006)。中、下地壳的深部余滑在一定程度上可以解释余震活动及震后形变(Marone et al.,1991;Savage et al.,1997;Hsu et al.,2006),但这也有可能受到下地壳粘滞性形变的驱动(Perfettini et al.,2004),与此有关的松弛过程被认为是余震序列得以持续的首要影响因素(Deng et al.,1999)。事实上,1990年青海共和7.0级地震的对比研究显示(Hao,2012),下地壳粘弹松弛机制较之余滑能够更好地解释共和地震后的垂直形变观测。应力松弛过程受主震破裂后下地壳介质的脆性蠕滑及流变性质的共同影响(Tse et al.,1986;Scholz,1990),在实验室岩石物理实验、震后形变及余震活动解释方面有较多的观测或实验证据(Royden,1997;Deng et al.,1999;Clark et al.,2000;Pollitz et al.,2001;Freed et al.,2001;Burgmann et al.,2008;Royden et al.,2008)。
因而,为简化模型,暂且仅考虑应力松弛过程的力学加载。假定主震破裂面上残余凹凸体的破裂导致余震,以岩石圈下部粘弹介质震后应力松弛作为导致残余凹凸体破裂的直接动力输入,以库仑破裂准则作为失稳判据,考虑凹凸体失稳对周边区域的应力加载,在不同的介质黏滞条件下,模拟余震发生过程,生成人工“余震”序列目录。通过G-R关系及修改的大森公式,检测模拟输出与实际余震活动统计特征的吻合程度,以此作为进一步调整模型参数的依据。在此基础上,探讨余震活动与粘弹介质物理属性之间的关系,重点讨论黏滞系数对余震活动的影响。
1 模型构建及参数设置
地震活动过程的数值模拟,是地震过程复杂性研究的重要手段,一般可分为2类具有不同特点的方法:1)一类试图尽可能真实地模拟实际的断层状况及断层运动过程,有限元及类似方法是这一类数值模拟的典型代表,其模拟结果的合理性,除算法本身外,强烈依赖于模型初始条件、边界条件与实际情况的吻合程度;2)另一类则主要从物理概念出发,利用高度概括的物理概念模型及演化规则,模拟实际地震活动过程的本质特征,其特点是着重于地震活动过程中最显著的统计特征,抓住最可能的物理本质,模拟复杂的地震现象及群体地震活动过程,这一类方法有利于表现统计特征突出、但介质、几何及力学加载等各种条件不清晰的动力学过程模拟,细胞自动机是该类模拟方法的成功范例。就本文研究内容而言,一方面,主震破裂面物理构成及震后应力状态均十分复杂,初始状态及余震物理演化过程不清晰,甚至是知之甚少,但另一方面,余震活动又具有非常突出、一致的统计特性,即余震活动在强度分布上遵循G-R关系,在时间分布上遵循修改的大森公式,余震被认为是统计规律最为清晰的地震活动,因而采用第2类数值模拟方法开展研究。
1.1残余凹凸体几何尺度分布
作为描述介质强度差异的重要概念,凹凸体在地震破裂过程研究中经常被提及(Kanamo-ri,1981;Somerville et al.,1999;Yamanaka et al.,2004)。关于大地震破裂面内主震滑移与余震分布之间的关系,Mendoza等(1988a,b;1989)早期的工作显示,余震常常发生于大滑移区之外或靠近其边缘,近期的研究进一步证实了这一观点,余震主要分布于主震滑移终止区域、高滑移区边缘、高低滑移区转换部位、主震时未破裂部位及低滑移区(Das et al.,2003;Yamada et al.,2010),这些区域的显著特征是主震后明显的应力增长及相对高的介质强度。这意味着,余震是主震破裂面内残余凹凸体的破裂。作为余震模拟研究的基础,假定主震破裂面内残余凹凸体在空间上随机分布,残余凹凸体尺度满足自相似的分形分布(Zeng et al.,1994):

上式中:p为常数,D为分形维数,N为尺度≥r的凹凸体数量。
1.2残余凹凸体破裂/失稳强度分布
主震破裂面的不均匀性由其上残余凹凸体的破裂/失稳强度的不均匀性来体现,在现有观测及理论条件下,其具体数值难以直接测量或计算。但从观测的角度,现有实际地震的测定结果显示,地震应力降在0.03~30MPa均有分布,众数为3MPa,此即常应力降模型的最重要观测证据(Scholz,1990),因而若地震符合完全应力降模型(Zúiga,1993),这意味着残余凹凸破裂/失稳强度最大可达到30MPa;另一方面,从应力触发的角度,能够触发地震活动的库仑应力变化至少应>0.01MPa(Harris et al.,1998;Stein et al.,1999),因而0.01MPa可作为残余凹凸体破裂/失稳强度的下限。同时已有研究还显示,能够触发地震的典型的库仑破裂应力大多分布在0.1~1MPa(Stein et al.,1997),而同震库仑应力直接触发的余震约占全部余震的50%左右(Perfettini et al.,2004;贾若等,2014),因而残余凹凸体破裂/失稳强度分布于0.1~1MPa应占相当大的比例。据此,模拟过程中,假定残余凹凸体初始破裂/失稳强度为0.01~30MPa,以具有偏态分布特征的对数正态分布为其概率密度函数,对数正态分布具有非轴对称特点,在概率密度峰值右侧拖尾较长;分布函数参数σ控制着概率密度函数向两侧不对称衰减的快慢,σ越小,概率密度分布函数越“瘦”,测量样本分布于峰值附近的概率越高。
1.3应力松弛及参数选择
根据周期性地震活动的模拟研究结果,岩石圈上部脆性层与下部软流层之间的差异运动是上地壳余震活动的根本动力来源(Tse et al.,1986;Scholz,1990),软流圈长期、持续、匀速、缓慢的稳态流动,对上覆岩石圈产生明显的拖拽作用。当岩石圈上部脆弹性层积累的应力超过断层强度或断层静摩擦时,断层突然失稳,瞬间发生明显的位移,上部积累的大部分应力得以释放;断层失稳的瞬间,由于相对较强的黏滞特性及由此产生的反向拖拽,岩石圈下部位移显著滞后于上部,这一明显的位移滞后,将在主震后较长时间内由缓慢的蠕变恢复过程而得以逐渐恢复,与此相对应的应力调整过程,在力学上可由粘弹介质的应力松弛过程来表达,此即导致岩石圈上部主震破裂面上余震活动的直接动力来源。当粘弹松弛过程逐渐结束之后,断层面逐渐转向重新耦合并趋于闭锁,余震活动随之结束。
对于双层粘弹性岩石圈模型,上层(岩石圈上部)代表具有弹性变形和脆性破裂的上地壳,下层(岩石圈下部)为塑性流动的下地壳和上地幔,上、下层厚度分别为l1和l2,两层具有相同的弹性模量k及不同的黏滞系数η1和η2。假定整个岩石圈全部深度上均受相同的水平应力σtot作用,则岩石圈内部存在如下应力关系(Kusznir et al.,1977):

式(1)中:l=l1+l2。采用Maxwell粘弹性体的应力应变关系来描述模型应力随时间的变化,在每一层内的应变率为

假定上下两层紧密耦合,则可得到上、下层应力σ1(t)和σ2(t)随时间的变化(Kusznir,1977):式(3,4)中:。由于上层为纯弹性变形,因此η1=∞,σ1和σ2可进一步简化为
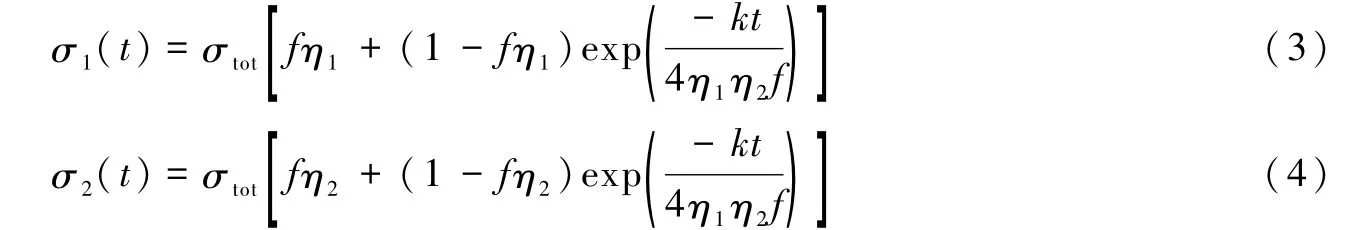
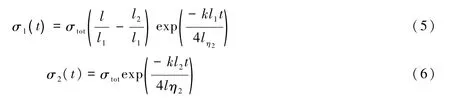
上层应力随时间按指数增加,达到岩石极限强度或断层静摩擦时,岩石破裂或断层突然失稳,积累的大部分应力得以释放。假定上层应力在岩石破裂或断层滑动后降低了,根据式(1)可得相应的下层应力变化为因而,震后松弛过程中,岩石圈下部t时刻的应力为

式(7)中:k、η2为岩石圈下部弹性模量和黏滞系数,k取值范围为1010~1011Pa,η2在1016~1021Pa·s之间变化(Kanamori,1981;Beaumont et al.,2001;Gourmelen et al.,2005;石耀霖等,2008)。l1和l2分别为岩石圈的厚度和岩石圈下部的厚度,根据区域的不同有所差异。σ0=σ2+为震后应力松弛的初始应力,等于岩石圈下部长时间积累的应力σ2加上主震时刻造成的下部韧性层的应力增加(于泳,2002)。σ0目前只能粗略估计其量级,例如根据出露的韧性剪切带内采集的花岗岩样品的变形温度,直接估算的韧脆转化带塑性流动的应力范围为15~80MPa(Stipp et al.,2003;韩亮,2012)。从另一个方面来看,在上、下地壳长期的应力积累过程中,由于下地壳粘弹介质的黏滞特性,其所累积的应力应低于上地壳。而已有研究表明,上地壳断层面内累积的剪应力大小一般分布为3~22MPa(Wyss et al.,1992;Spudich et al.,1998;Hasegawa et al.,2011),据此推测下地壳的应力亦应低于上述范围,暂且假定主震后初始应力σ0为3~20MPa。
1.4应力加载及破裂/失稳准则
(2)当残余凹凸体所承受的累积应力小于其破裂/失稳强度时,不发生失稳,也无应力降产生,该残余凹凸体所承受累积应力较之此前增加Δσ(t),该次加载过程结束;
(3)当残余凹凸体承受的累积应力大于或等于其破裂/失稳强度时,破裂或失稳发生,该凹凸体在后续余震序列演化过程中不再承受力学作用。若加载应力尚有剩余,则重复上述加载过程,直至破裂或失稳不再发生,该次加载过程结束;
(4)上述(3)中,当残余凹凸体发生失稳,应力降的一小部分转化为与其余凹凸体之间的相互作用,促使序列进一步演化。重复上述(2)~(3)加载过程,直至失稳不再发生,该次加载过程结束;
(5)令t=t+Δt,重复上述(1)~(4)加载过程,直至Δt时段内,不足以继续触发地震为止,整个序列演化结束。
需要指出的是,此处凹凸体失稳包括岩石破裂及断层粘滑两种形式。
1.5残余凹凸体破裂对附近区域的应力扰动
由于应力增加超过0.01MPa即可触发余震(Harris et al.,1998;Stein et al.,1999),而任何一次残余凹凸体的失稳均有其自身的应力降产生,因而必须考虑残余凹凸体破裂对其附近区域的应力扰动。假定残余凹凸体破裂或失稳符合完全应力降模型(Zúiga,1993),依据实际地震观测结果(Scholz,1990),残余凹凸体应力降在0.03~30MPa内随机分配,总体上符合众数为3MPa的对数正态分布。简化条件下,残余凹凸体破裂所释放的应力降有部分转化为单元内的摩擦损耗,部分以地震波的形式辐射,还有部分转化为对附近区域未破裂残余凹凸体的应力加载。假定震源辐射各向同性,且围绕震源呈半径对称分布,则均匀弹性介质中点源产生的应力在空间上的传递按距离立方的倒数进行分配(Ouillon et al.,2004)。

1.6“余震”震级计算
由于余震破裂尺度远小于主震断层长度及宽度,因而其破裂可由圆盘模型进行描述。对于圆盘形的位错面,地震矩(Keilis-Borok,1959)。参考矩震级与地震矩之间统计关系(Kanamori,1977),模拟过程中基于残余凹凸体几何尺度及其破裂应力降即可估计所产生“余震”的震级。需要指出的是,由于进行了一系列的简化假设,该处的“震级”仅具有相对大小的概念,不宜与实际震级严格挂钩。
2 黏滞系数对余震活动影响的初步研究
本文模拟过程以岩石圈下部粘弹介质的应力松弛作为岩石圈上部余震活动的应力加载,由式(7)可见,加载应力大小与粘弹介质的黏滞系数η2有关。介质黏滞系数是岩石圈的重要物性参数之一,不同地区黏度差异较大,一般在1016~1021Pa·s区间变化(Kanamori,1981;Beaumont et al.,2001;Gourmelen et al.,2005;石耀霖等,2008),本文主要选取比较普遍的黏度区间1017~1019Pa·s探讨黏滞系数对余震活动的影响。
2.1余震活动基本特征模拟
本文模拟7.0级主震产生的余震序列,假定主震破裂面内残余凹凸体数量为10 000,残余凹凸体尺度上符合自相似的分形分布,分形维数为可调参数,在空间上随机分布,残余凹凸体初始破裂/失稳强度符合对数正态分布。主震之后的余震演化过程中,加载应力随时间变化符合应力松弛的负指数衰减方式,由岩石圈下部粘弹介质的黏滞系数、弹性模量等物理参数控制;残余凹凸体的破裂/失稳遵循库仑破裂准则,每个凹凸体的破裂或失稳相当于1次地震事件,并产生对附近区域的应力相互作用。经由上述过程模拟生成余震序列。在模拟参数固定的情况下,模拟结果稳定。
作为例子,图1给出η2=9×10¹⁷Pa·s条件下一次模拟结果的M-t图,可见序列整体呈衰减态势,序列活动持续时间约480d,包含几个密集起伏过程,显示序列在时间上的不均匀丛集特性;较强余震主要出现在震后早期阶段,大约90d之后余震活动频次、强度均逐渐降低;最大余震震级为5.0级,发生在震后第41d,4级以上余震10余次。该余震序列G-R关系b值为1.05(图2a),修改的大森公式衰减系数p值为0.93(图2b),总体上与实际余震序列的统计特征非常相像。
2.2黏滞系数与余震活动持续时间
当应力松弛加载应力不足以触发余震活动时,余震停止活动,因而余震活动持续时间在理论上等同于松弛加载应力降低至0.01MPa以下的时间。模拟结果显示,黏滞系数在1×10¹⁷~3×10¹⁹Pa·s区间变化时,随着黏滞系数的降低,余震活动持续时间从15 000多天递减到50多天,黏滞系数每降低一个量级,余震持续时间大约降低10倍左右。以黏滞系数η2=1×10¹⁸Pa·s和η2=1×10¹⁷Pa·s为例,在其他参数不变的情况下,η2=1×10¹⁸Pa·s时,余震数目从最初第1天117次2级以上余震,迅速衰减到每天平均约20次的余震,余震持续时间约为500d;η2=1×10¹⁷Pa·s时,余震数目第1天为320多次,但衰减迅速,持续时间仅约为50d。由此可见,黏滞系数越低,序列衰减越快,余震活动持续时间越短。

图1 模拟得到的余震序列M-t图Fig.1 M-t plot of simulated aftershock sequence.

图2 余震序列的G-R关系(a)及2级以上余震日频次随时间的衰减(b)Fig.2 G-R relationship of aftershock sequence(a)and the frequency attenuation with time(b).
2.3黏滞系数与余震序列衰减
修改的大森公式n(t)=K(t+c)-p是余震序列频次衰减的经典描述,其中t是以主震发生时刻为起点的流逝时间,p为衰减系数,表征序列频次衰减的快慢,p大则序列衰减快、p小则序列衰减慢。K和c为常数,c值较小,一般认为与主震后记录不完备的时间有关(Kagan et al.,2005;Lolli et al.,2006)。Utsu(1995)在纪念大森公式发表100周年的综述性文章中,对1962—1995年间全球发表的200多个p值计算结果进行分析和总结,指出p值分布在0.6~2.5,均值为1.1。近期进一步的研究与Ustu的上述认识相一致(Rabinowitz et al.,1998;Husen et al.,2004)。在中国大陆地区,32个序列的计算结果也显示,p值在0.63~1.54变化,均值为0.95(赵志新等,1992)。本文对黏滞系数研究区间内(1×10¹⁷~3×10¹⁹Pa·s)生成的余震数据进行修改的大森公式拟合,结果显示p值主要集中在0.6~1.2之间变化(表1),与真实余震序列的p值范围基本一致。
由表1可见,在模型其他参数不变的情况下,黏滞系数η2越低,p值越大、余震活动衰减越快。事实上,已有研究表明(Mogi,1962a;Kisslinger et al.,1991)余震序列衰减的快慢,与地下热流正相关,地下热流值越高,序列衰减越快。根据温度与岩石黏滞系数的关系,温度越高,岩石黏滞系数越低,二者呈反相关关系。因而,热流值越高的区域,粘滞系数越低,序列衰减的越快,余震活动持续时间越短,与本文结论相一致。就本文模型参数条件而言,黏滞系数η2与余震序列衰减系数p值似乎具有负指数形式的相关关系(图3):p=0.64+0.5exp(-5×10-19η)。由于本文序列衰减系数p值仅仅通过对模拟余震数据的拟合直接求得,并未预先假定p值与模型黏滞系数η2之间存在何种联系,因而图3所示的p值随η2变化这一特性表明,作为岩石圈物性参数的黏滞系数,可能控制着余震序列衰减的快慢。

表1 不同黏滞系数对应拟合得到的衰减系数、b值Table 1 Attenuation coefficients,b values fitted according to different viscosity coefficients

图3 衰减系数p值随黏滞系数的变化Fig.3 Fitted plot of viscosity coefficient and attenuation rate.
2.4黏滞系数与序列G-R的关系
作为一个完整的地震序列集合,余震序列的震级、频度遵循G-R关系,G-R关系系数b值表征序列大、小地震之间的比例关系,多数情况下b值在0.6~1.1变化(Utsu,2002)。图4给出取不同的凹凸体尺度分布分形分维D值条件下,余震序列的G-R关系,图4a中D=2,b=0.99,调整黏滞系数,b值几乎未变(表1);而当改变凹凸体尺度分布分形维数D时,b值变化明显,图4b中D为1.7,b值降低至0.83。由此可见,在本文模型参数条件下,黏滞系数对余震序列的震级-频度关系影响不大,b值更多的受主震断层面上残余凹凸体尺度分布的影响,与构造不均匀性的关系更为密切(Mogi,1962b;Pacheco et al.,1992)。
3 结论与讨论
假定主震破裂面上残余凹凸体的破裂导致余震,以岩石圈下部粘弹介质震后应力松弛作为导致残余凹凸体破裂的直接动力输入,以库仑破裂准则作为失稳判据,考虑凹凸体失稳对周边单元的库仑应力加载,在不同条件下模拟生成包含时、空、强三要素的人工“余震”序列,在此基础上重点讨论介质黏滞性质对余震活动的影响。研究结果显示:
(1)表征岩石圈下部物质流变性质的黏滞系数对余震活动持续时间具有重要的控制作用。岩石圈下部黏滞系数控制着余震活动的持续时间,黏滞系数越低,岩石圈下部应力松弛越快,据式(1),其对岩石圈上层的加载速率就越快,余震持续时间越短;相反,黏滞系数越高,对岩石圈上层的加载速率越慢,余震持续时间越长。这一模拟结论与实际观测相吻合,实际观测结果显示(Stein et al.,2009),余震活动持续时间与断层加载速率反相关,断层加载速率越慢、余震持续时间越长,断层加载速率越快、余震的持续时间越短。例如,板块边缘加载速率较快,余震活动一般持续1~2a,板块内部加载速率较慢,余震活动则可持续上千年。
(2)作为岩石圈重要物性参数之一的黏滞系数,控制着余震序列衰减的快慢。在本文模型条件下,衰减系数p与黏滞系数存在负指数形式的相关关系,黏滞系数越低,余震序列衰减得越快,这一关系为研究余震衰减主要影响因素提供了参考,与此前余震序列衰减快慢与地下热流成正相关的观测结果(Mogi,1962a;Kisslinger et al.,1991)可以相互印证。
(3)余震序列G-R关系b值表征了序列大、小地震之间的比例关系,本文模拟研究显示,黏滞系数对余震序列的G-R关系影响不大,地震活动的强度分布特征可能更多的受制于主震破裂面上残余凹凸体的尺度分布,即主要与构造的不均匀性有关。
(4)由于简化研究的需要,式(7)中的弹性模量k及岩石圈下部厚度与整个岩石圈厚度之比l2/l等参数在本文中被赋予固定值。而事实上,除黏滞系数外,弹性模量k及岩石圈下部厚度与整个岩石圈厚度之比l2/l等也可能是影响应力松弛过程的重要物理因素。限于篇幅,该部分内容将另文叙述。

图4 不同凹凸体分布分形维数条件下余震序列的G-R关系Fig.4 G-R relation of aftershock sequence with different fractal dimensions of asperities.
致谢感谢马胜利研究员、陈棋福研究员在本文第一作者博士论文开题过程中给予的指导,感谢周永胜研究员在模型构建过程中的具体指导,感谢陈时军研究员、葛伟鹏博士、程佳、刘少卓、崔鑫等同学的帮助及有益的讨论。感谢审稿人的修改建议。
韩亮.2012.龙门山断裂脆塑性转化带内花岗岩的流体特征与裂缝愈合的实验模拟研究[D]:[学位论文].北京:中国地震局地质研究所.
HAN Liang.2012.Fluid characters of granite in the brittle-plastic transition zone of the Longmenshan Fault and experimental simulationofcrackshealing[D].Dissertation.InstituteofGeology,ChinaEarthquake Administration,Beijing(in Chinese).
贾若,蒋海昆.2014.基于同震库仑应力变化的汶川地震地震余震频次研究[J].中国地震,30(1):74—90.
JIA Ruo,JIANG Hai-kun.2014.Aftershock sequence frequency research on the Wenchuan aftershock sequence based on the coseismic coulomb stress changes[J].Earthquake Research in China,30(1):74—90(in Chinese).
刘桂萍,石耀霖,马丽.1995.地震活动性的细胞自动机模型[J].西北地震学报,17(2):20—25.
降低蚊媒数量是控制病毒扩散最简单有效的手段,然而传统的喷洒杀虫剂不仅造成环境污染,长期使用也会因蚊虫产生抗药性而失效,因此“以蚊治蚊”的方法备受科学家的青睐,其中有两种比较有应用前景的方法,一种为通过释放携带显性致死基因的雄蚊,其与野生雌蚊交配所产生的后代因显性致死基因而无法存活,另一种利用沃尔巴克体感染雄蚊并释放,当自然界的雌蚊与其交配时所产的卵因胞质不相容而无法存活[42]。我国科学家奚志勇团队已经在广州建立了全球最大的蚊子生产基地,随着项目的顺利进展,控制寨卡疫情指日可待。
LIU Gui-ping,SHI Yao-lin,MA Li.1995.A cellular automation model of seismicity[J].Northwestern Seismological Journal,17(2):20—25(in Chinese).
刘杰,刘桂萍,李丽,等.1999.基于大陆地震活动特点建立的简化动力学模型:细胞自动机模型[J].地震,19(3):230—238.
LIU Jie,LIU Gui-ping,LI Li,et al.1999.Simplified dynamic model based on the characteristics of continental seismicity-cell automat model[J].Earthquake,19(3):230—238(in Chinese).
李锰,杨峰,胡伟华.2011.利用非均匀细胞自动机模拟震级与应力降关系[J].地震,31(2):129—136.
LI Meng,YANG Feng,HU Wei-hua.2011.Simulation of the relation between magnitude and stress drop using heterogeneous cellular[J].Earthquake,31(2):129—136(in Chinese).
石耀霖,曹建玲.2008.中国大陆岩石圈等效黏滞系数的计算和讨论[J].地学前缘,15(3):83—95.
SHI Yao-lin,CAO Jian-ling.2008.Effective viscosity of China continental lithosphere[J].Earth Science Frontiers,15(3):83—95(in Chinese).
于泳.2002.地块变形与断层地震的藕合数值模拟[D]:[学位论文].北京:中国地震局地质研究所.
YU Yong.2002.Numerical simulation of crustal block’s deformation coupled with earthquake events of spring-block model[D].Dissertation.Institute of Geology,China Earthquake Administration,Beijing(in Chinese).
朱守彪,蔡永恩,刘杰,等.2006.利用三维细胞自动机模拟地震活动性[J].北京大学学报(自然科学版),42(2):206—210.
ZHU Shou-biao,CAI Yong-en,LIU Jie,et al.2006.Modeling seismicity by 3-D cellular automata[J].Acta Scientiarum Naturalium Universitatis Pekinensis,42(2):206—210(in Chinese).
赵志新,尾池和夫,松村一男,等.1992.中国大陆地震余震活动的P值[J].地震学报,l4(1):9—16.
ZHAO Zhi-xin,Matsumura K,Oike K,et al.1992.The p value of aftershock activity in Chinese mainland[J].Acta Seismologica Sinica,14(1):9—16(in Chinese).
Beaumont C,Jamieson R A,Nguyen M H,et al.2001.Himalayan tectonics explained by extrusion of a low viscosity crustal channel coupled to focused surface denudation[J].Nature,414:738—742.
Burgmann R,Dresen G.2008.Rheology of the lower crust and upper mantle:Evidence from rock mechanics,geodesy,and field observations[J].Annu Rev Earth Planet,36:531—567.
Clark M K,Royden L H.2000.Topographic ooze:Building the eastern margin of Tibet by lower crustal flow[J].Geology,28:703—706.
Das S,Henry C.2003.Spatial relation between main earthquake slip and its aftershock distribution[J].Reviews of Geophysics,41(3):1013—1023.
Deng J S,Hudnut K,Gurnis M,et al.1999.Stress loading from viscous flow in the lower crust and triggering of aftershocks following the 1994 Northridge California,earthquake[J].Geophys Res Lett,26(21):3209—3212.Dieterich J.1994.A constitutive law for rate of earthquake production and its application to earthquake clustering[J].J Geophys Res,99(B2):2601—2618.
Felzer K R.2010.Aftershock triggering is a multi-step process[D].Dissertation.U S Geological Survey,Pasadena.
Freed A M,Lin J.2001.Delayed triggering of the 1999 Hector Mine earthquake by viscoelastic stress transfer[J].Nature,411(6834):180—183.
Gasperini P,Mulargia F.1989.A statistical analysis of seismicity in Italy:The clustering properties[J].Bull Seism Soc Am,79:973—988.
Gourmelen N,Amelung F.2005.Postseismic mantle relaxation in the Central Nevada Seismic Belt[J].Science,310:1473—1476.
Harris R A,Simpson R W.1998.Suppression of large earthquake by stress shadows:A comparison of Coulomb and rate-and-state failure[J].J Geophys Res,13:24439—24451.
Hao M,Shen Z K,Wang Q,et al.2012.Postseismic deformation mechanisms of the 1990 MW6.4 Gonghe,China earthquake constrained using leveling measurements[J].Tectonophysics,532-535:205—214.
Hasegawa A,Yoshida K,Okada T,et al.2011.Nearly complete stress drop in the 2011 MW9.0 off the Pacific coast of Tohoku earthquake[J].Earth Planets Space,63:703—707.
Helmstetter A,Didier S.2003.Importance of direct and indirect triggered seismicity in ETAS model of seismicity[J].Geophys Res Lett,30(11):1576—1580.
Hirata T.1987.Omori’s power law aftershock sequences of microfracturing in rock fracture experiment[J].J Geophys Res,92:6215—6221.
Hsu Y J,Simons M,Avouac J P,et al.2006.Frictional afterslip following the 2005 Nias-Simeulue earthquake,Sumatra[J].Science,312:1921—1926.
Husen S,Smith R B.2004.Probabilistic earthquake relocation in three-dimensional velocity models for the Yellowstone National Park region,Wyoming[J].Bull Seism Soc Am,94(3):880—896.
Huc M,Main I G.2003.Anomalous stress diffusion in earthquake triggering:Correlation length,time-dependence and directionality[J].J Geophys Res,18:2324—2332.
Kanamori H.1977.The energy release in great earthquakes[J].J Geophys Res,82:2981—2987.
Kanamori H.1981.The nature of seismicity patterns before large earthquake[A].In:Ewing M(ed).Series(4):Earthquake prediction—An international review,1—19.
Kanamori H,Brodsky E E.2004.The physics of earthquakes[J].Rep Prog Phys,67(8):1429—1496.
Kagan Y Y,Houston H.2005.Relation between mainshock rupture process and Omori’s law for aftershock moment release rate[J].Geophys J Int,163(3):1039—1048.
Kisslinger C,Jones L M.1991.Properties of aftershocks in southern California[J].J Geophys Res,96:11947—11958.
King G C P,Stein R S,Lin J.1994.Static stress changes and the triggering of earthquakes[J].Bull Seism Soc Am,84,935—953.
Keylis-Borok V I.1959.On estimation of the displacement in an earthquake source and of source dimensions[J].Ann Geofis,12:205—214.
Kusznir N J,Bott M H P.1977.Stress concentration in the upper lithosphere caused by underlying visco-elastic creep[J].Tectonophysics,43:247—256.
Lolli B,Gasperini P.2006.Comparing different models of aftershock decay:The role of catalog incompleteness in the first times after main shock[J].Tectonophysics,423:43—59.
Marone C J,Scholz C H,Bilham R.1991.On the mechanics of earthquake afterslip[J].J Geophys Res,96:8441—8452.
Mendoza C,Hartzell S H.1988a.Aftershock patterns and mainshock faulting[J].Bull Seism Soc Am,78:1438—1449.
Mendoza C,Hartzell S H.1988b.Inversion for slip distribution using teleseismic P waveforms,North Palm Springs,Borah Peak,and Michoacan earthquakes[J].Bull Seism Soc Am,78:1092—1111.
Mendoza C,Hartzell S H.1989.Slip distribution of the 19 September 1985 Michoacan,Mexicl earthquake:Near-source and teleseismic constraints[J].Bull Seism Soc Am,79:655—669.
Mogi K.1962a.On the time distribution of aftershocks accompanying the recent major earthquake in and near Japan[J].Bull Earthquake Res Inst,40:107—124.
Mogi K.1962b.Study of elastic shocks caused by the fracture of heterogonous materials,and its relation to the earthquake phenomena[J].Bull Earthquake Res Inst,40:10—31.
Nur A,Booker J R.1972.Aftershocks caused by pore fluid flow?[J].Science,175:885—888.
Ouillon G,Sornette D.2004.Search for direct empirical spatial correlation signatures of the critical triggering earthquake model[J].Geophys J Int,157(3):1233—1246.
Pacheco J F,Scholz C H,Syke L R.1992.Changes in frequency-size relation from small to large earthquake[J].Nature,355:71—73.
Peng Z,Zhao P.2009.Migration of early aftershocks following the 2004 Parkfield earthquake[J].Nature Geoscience,2:877—881.
Perfettini H,Abouac J P.2004.Postseismic relaxation driven by brittle creep:A possible mechanism to reconcile geodetic measurements and the decay rate of aftershocks,application to the Chi-Chi earthquake,Taiwan[J].J Geophys Res,109(B2):B02304.
Perfettini H,Avouac J P.2007.Modeling afterslip and aftershocks following the 1992 Landers earthquake[J].J Geophys Res,112(B7):B07409.
Pollitz F F,Wicks C,Thatcher W.2001.Mantle flow beneath a continental strike-slip fault:Postseismic deformation after the 1999 Hector Mine earthquake[J].Science,293:1814—1817.
Royden L H.1997.Surface deformation and lower crustal flow in eastern Tibet[J].Science,276:788—790.
Rabinowitz N,Steinberg D M.1998.Aftershock decay of three recent strong earthquakes in the Levant[J].Bull Seism Soc Am,88(6):1580—1587.
Royden L H,Burchfiel B C,Robert D.2008.The geological evolution of the Tibetan plateau[J].Science,321:1054—1058.
Savage J C,Svarc J L.1997.Postseismic deformation associated with the 1992 MW=7.3 Landers earthquake,southern California[J].J Geophys Res,12:7565—7577.
Scholz C H.1968a.Microfractures,aftershocks and seismicity[J].Bull Seism Soc Am,58:1117—1130.
Scholz C H.1968b.An experimental study of the fracturing process in brittle rock[J].J Geophys Res,73:1447—1454.
Scholz C H.1968c.Microfractures and the inelastic deformation of rock in compression[J].J Geophys Res,73:1417—1432.
Scholz C H.1990.The Mechanics of Earthquakes and Faulting[M].Cambrige University Press,London.
Somerville P,Irikula K,Graver R.1999.Characterizing crustal earthquake slip models for the prediction of strong ground motion[J].Seism Res Lett,70(1):59—80.
Spudich P,Guatteri M,Otsuki K,et al.1998.Use of fault striations and dislocation models to infer tectonic shear stress during the 1995 Hyogo-Ken Nanbu(Kobe)earthquake[J].Bull Seism Soc Am,88(2):413—427.
Stein R S.1999.The role of stress transfer in earthquake occurrence[J].Nature,402:605—609.
Stein S,Liu M.2009.Long aftershock sequences within continents and implications for earthquake hazard assessment[J].Nature,462:97—89.
Stein R S,Barka A A,Dieterich J H.1997.Progressive failure on the North Anatolian Fault since 1939 by earthquake stress triggering[J].Geophys J Int,128:594—604.
Stipp M,Tullis J.2003.The recrystallized grain size piezometer for quartz[J].Geophys Res Lett,30(21):2088.doi:10.1029/2003GL018444.
Tse S T,Rice J R.1986.Crustal earthquake instability in relation to the depth variation of frictional slip properties[J].J Geophys Res,91:9452—9472.
Toda S,Stein R S,Richards-Dinger K,et al.2005.Forecasting the evolution of seismicity in southern California:Animations built on earthquake stress transfer[J].J Geophys Res,110:B05S16.doi:10.1029/2004JB003415.
Utsu T,Ogata Y,Matsuura R S,et al.1995.The centenary of the Omori formula for a decay law of aftershock activity[J].J Phys Earth,43(1):1—33.
Utsu T.2002.Statistical features of seismicity[A].In:International Handbook of Earthquake and Engineering Seismology,81:719—731.
Wyss M,Gilard D,Liang B.1992.An estimate of the absolute stress tensor in Kaoiki,Hawaii[J].J Geophys Res,97:4763—4768.
Yamanaka Y,Masayuki K.2004.Asperity map along the subduction zone in northeastern Japan inferred from regional seismic data[J].J Geophys Res,109:B07307.
Yamada T,Okubo P G,Wolfe C J,et al.2010.Kīholo Bay,Hawaii,earthquake sequence of 2006:Relationship of the main shock slip with locations and source parameters of aftershocks[J].J Geophys Res,115:B08304.
Zeng Y H,Anderson J G,Yu G.1994.A composite source model for computing realistic synthetic strong ground motions[J].Geophys Res Lett,21(8):725—728.
Zúiga F R.1993.Fractional overshoot and partial stress drop.Which one?[J].Bull Seismol Soc Am,3(3):939—944.
Abstract
After a large earthquake,more seismic activities are observed in the focal region and its adjacent area.The obvious increased earthquakes are called the aftershocks.Generally speaking,aftershock sequence gradually weakens and sometimes has ups and downs.The time when the aftershock activity begins to be confused with background seismic activity is known as the aftershock activity duration.Aftershock sequence is one of the enduring research fields in seismology.Aftershocks accord with two important statistical relationships,one is the G-R relationship describing the relation between the magnitude and frequency,the other is the modified Omori formula describing the characteristics of aftershock decay with time.On this basis,a number of studies from different angles explain the mechanism of aftershock activity.From the perspective of the medium heterogeneity,it is universally accepted that aftershock is a result of further rupture of residual asperities.From the perspective of stress,these models,e.g.rate-state dependence,subcritical crack growth,creep or afterslip and so on,think that the fault stress change caused by mainshock is the main cause for aftershock.But other researchers,by studying real aftershock observations,think that the fault stress change caused by mainshock is not the main cause or has very weak control over the aftershocks.Pore pressure diffusion caused by mainshock fault slip is also considered as an important incentive for aftershocks.There is a relationship between the frequency of aftershocks and pore pressure changes.Dry rock pressurized in physical experiment can produce acoustic emission sequence similar to mainshock-aftershock sequence type earthquake.Though fluid plays an important role in aftershock activities,it is not the essential element for aftershock.Overall,there is no single model which can fully explain the phenomenon of aftershock activity.
Assuming the rupture of the residual asperities inside the mainshock rupture plane randomly leads to the aftershocks,the size of the residual asperities conforms to fractal distribution,and the rupture or instability strength of the residual asperities accords with the lognormal distribution.Taking the postseismic stress relaxation as the mechanical load,the loading stress attenuates according to negative exponential law.Taking the Coulomb failure as the judgment criterion of the instability,combining the mechanical interactions amongtheresidual asperities,theartificial aftershock sequence,including occurring time,location and magnitude,is simulated under different conditions.The agreement between output and the actual statistical characteristics of aftershock activities is detected by G-R relationship and modified Omori formula as a basis for further adjustments to the model parameters.On this basis,the influences of the medium viscosity properties on aftershock activities have been discussed.
The results show that viscosity coefficient of rheological properties of the lower part of the lithosphere has an important effect on the duration of aftershock activity.The viscosity coefficient of the lower part of the lithosphere controls the duration of the aftershock activity,the lower the viscosity coefficient,the sooner the stress relaxation of the lower lithosphere,and the faster the loading rate to the upper part of the lithosphere,the shorter the duration of the aftershock activity.On the contrary,the higher the viscosity coefficient,the slower the loading rate to the upper part of the lithosphere,and the longer the duration of the aftershock activity.This simulation conclusion is consistent with the observed result.The viscosity coefficient as one of the important lithosphere physical parameters controls the decay rate of aftershock activity.Under this model conditions,p value,the decay rate of modified Omori law,changes with the viscosity coefficients in a negative exponential function.The relationship that the viscosity coefficient is lower and the decay of aftershock sequence is faster provides a reference for the study of the main influence factors of aftershock decay.The relationship corresponds to the observation that the decay rate of the aftershock sequence shows a good positive correlation.The b value of the G-R relationship of aftershock sequence characterizes the ratio relationship of large to small earthquakes.The modeling studies suggest that the G-R relationship of the aftershock sequence is irrelevant with the viscosity coefficient,but mainly controlled by the size distribution of the residual asperities.In another word,it is mostly correlative to the heterogeneity of tectonics and medium.
SIMULATION STUDY OF THE INFLUENCE OF MEDIUM VISCOSITY ON AFTERSHOCK ACTIVITIES
QU Jun-hao1,2)JIANG Hai-kun3)SONG Jin3)LI Jin4)
1)Institute of Geology,China Earthquake Administration,Beijing100029,China
2)Earthquake Administration of Shandong Province,Jinan250014,China
3)China Earthquake Networks Center,Beijing100045,China
4)Earthquake Administration of Xinjiang Uygur Autonomous Region,Urumqi830011,China
mainshock rupture plane,aftershock activity,residual asperities,stress relaxation,viscosity coefficient
P315.3+3
A文献标识码:0253-4967(2015)01-0053-15
10.3969/j.issn.0253-4967.2015.01.005
曲均浩,男,1981年生,工程师,中国地震局地质研究所在读博士研究生,主要从事数字地震学应用及地震序列研究,E-mail:gisqjh@126.com。
2013-11-27收稿,2014-02-10改回。
山东省自然科学基金(ZR2014DQ019)和山东省地震局青年基金(JJ1308Y)共同资助。
蒋海昆,男,研究员,E-mail:jianghaikun@sohu.com。
猜你喜欢
数学年刊A辑(中文版)(2022年3期)2023-01-05
小学科学(学生版)(2021年6期)2021-07-21
小天使·六年级语数英综合(2018年6期)2018-10-08
地震研究(2017年3期)2017-11-06
地震研究(2017年3期)2017-11-06
哈尔滨工程大学学报(2016年12期)2017-01-17
Coco薇(2015年5期)2016-03-29
地球与行星物理论评(中英文)(2015年2期)2015-12-24
中国地震(2015年2期)2015-09-04
中国自行车·骑行风尚(2014年2期)2014-05-07
