中国东北地区北部上地幔各向异性及其动力学意义
强正阳, 吴庆举
中国地震局地球物理研究所, 北京 100081
中国东北地区北部上地幔各向异性及其动力学意义
强正阳, 吴庆举*
中国地震局地球物理研究所, 北京 100081
中国东北地区广泛发育新生代板内火山,晚中生代以来岩石圈遭受过多期拉张作用.作为中国唯一的深震孕育区,中国东北地区受到太平洋板块的西向俯冲,使得其成为研究岩石圈变形、板块俯冲和板内火山成因及其相互作用关系的天然实验室.通过分析架设在中国东北地区北部的147个流动和固定台站的SKS波形数据,共计得到了377对各向异性参数和251个无效分裂结果.结果表明,中国东北地区东西两侧具有不同的各向异性分布:西部地区各向异性方向变化范围为N143-199°E,平均N169°E,与晚中生代岩石圈伸展方向一致;其各向异性延迟时间平均值约为0.8 s,说明来自地幔的各向异性比较微弱,主要由残留在岩石圈中的古老变形所引起.同时,在松辽盆地和佳木斯地块部分区域,观测到延迟时间较小的各向异性(~0.4 s),可能是由于岩石圈的拆沉和热地幔物质的上涌侵蚀了保留在岩石圈的古老形变所致.在研究区东部,NNW-SSE朝向的各向异性被观测到,并伴随较大的延迟时间(大于1.0 s),可能与太平洋板块撕裂回撤而产生的地幔流动有关.此外,近W-E方向的各向异性只在佳木斯地块被观测到,而太平洋板块在地幔过渡带中的俯冲可能是其产生的主要成因.
中国东北; 剪切波分裂; 地震各向异性; SKS震相
1 引言
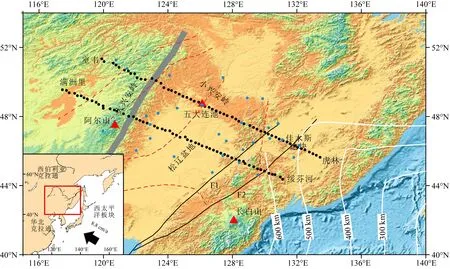
中国东北地区位于中亚造山带的东缘,被西伯利亚板块、华北板块、西太平洋板块所夹持(engör et al.,1993).区域上由一系列古代增生楔和微陆块拼接而成(张兴洲等,2006),主要包括兴安陆块、松辽陆块和佳木斯陆块,并被嫩江—贺根山缝合带和牡丹江缝合带所分割(Wu et al., 2002)(图1).普遍认为该区域经历过两个时期的构造演化:在古生代,构造演化主要受到了位于西伯利亚克拉通和华北克拉通之间的古亚洲洋的影响;然而自侏罗纪以来,太平洋板块的俯冲则成为控制该区域构造演化的主要因素.研究区广泛发育NNE-SSW向盆地构造单元,并在大兴安岭、小兴安岭和长白山形成三条火山带.目前对盆地和板内火山的形成机制仍不明确.一些学者认为板块内部断裂是软流圈上涌和太平洋板块、欧亚板块和印度板块综合作用的结果(Ren et al., 2002).通过高分辨率地震波成像研究,Zhao等(2009)提出大地幔楔模型,认为太平洋滞留板块对于板内火山的形成具有重要作用.而最新接收函数研究结果表明,长白山火山的成因主要受到地幔柱控制,而与滞留在地幔过渡带中的太平洋板块可能没有直接关系(Liu et al., 2015).
地震各向异性是研究岩石圈变形和地幔流动最直接有效的方法之一(Silver, 1996; Savage, 1999; Long and Silver, 2009).地震各向异性主要通过两个分裂参数来描述:快波极化方向(φ)和快慢波延迟时间(δt),它们分别描述了各向异性的方向和程度,是解释各向异性的关键.研究表明,由SKS分裂所测到的各向异性主要是由上地幔中橄榄石或是其他易变形的矿物晶轴优势排列(lattice preferred orientations, LPO)所引起(Christensen, 1984; Nicolas and Christensen, 1987).岩石圈中的各向异性通常被认为与岩石圈遭受的最后一次形变有关(Silver and Chan, 1991; Silver et al., 2001),而软流圈中的各向异性则常常受到地幔流动影响(Vinnik et al., 1992).前人在俯冲带及弧后环境利用剪切波分裂手段开展了众多各向异性的研究工作.但是由于俯冲板块形态及地幔流类型的复杂性,平行于海沟或是垂直于海沟等多种方向的各向异性均被观测到,并且各向异性的时间也不稳定(Long and Silver, 2008).为了解释各向异性成因机制,前人提出多种俯冲带上地幔各向异性模型,例如各向异性存在于地幔楔中由于板块俯冲而产生的地幔回流(Fischer et al., 2000),各向异性平行于海沟的B型橄榄石结构(Jung and Karato, 2001; Jung et al., 2009),亦或是存在于俯冲板片内的结构(Sandvol and Ni, 1997)等.
受到地震资料的限制,前人在中国东北地区开展的各向异性研究工作较少,对于上地幔各向异性成因的认识还不够全面.有学者认为,中国东北地区东部W-E朝向的各向异性来源于太平洋俯冲板块中亚稳定橄榄石晶体的定向排列,西部地区近N-S朝向的各向异性还可能受到地幔流动的影响(Liu et al., 2008).Li和Niu(2010)的研究结果表明,中国东北地区NW-SE向的各向异性是由残留在岩石圈中的古老拉张变形所引起.
本次研究中,我们使用了密集的流动地震台阵资料,横穿了大兴安岭、松辽盆地和佳木斯地块三个主要的构造单元(图1),为我们更为精细地描画该区域上地幔各向异性结构提供了绝好的机会.同时,我们将所得到剪切波测量结果与前人的研究做了对比,并从岩石圈和软流圈的角度讨论了上地幔各向异性的可能成因,为建立研究区上地幔结构模型提供必要约束.

图1 研究区域周边情况及台站分布图流动和固定地震台的位置分别用黑色和蓝色的圆点表示,而新生代火山的位置用红色三角表示.灰色粗线是南北重力梯度带,白色实线是太平洋俯冲板块等深线,红色的虚线是缝合线的位置.断层F1和F2是郯庐断裂的两个分支.Fig.1 Map showing geology of the study area and surrounding regions and distribution of seismic stationsThe black and blue dots indicate stations associated with our temporary seismic stations and Chinses national and regional seismic networks, respectively. The red triangles denote the Holocene volcanoes.The grey wide line represents the North South Gravity lineament, and the red dash lines represent the suture zone. Faults F1 and F2 are the two branches of the Tanlu fault. The white lines denote the isobaths curve of the subducting Pacific plate.
2 数据与方法
2009年6月至2011年8月,受到国家自然基金委和国土资源部实验专项的资助,我们在中国东北地区布设了2条北西—南东方向的流动测线,台站间距约20km,共计116套宽频带地震计.同时,还收集了测线周边国家和区域地震台网中30个固定台站同期波形数据(郑秀芬等,2009).此外,我们还从美国地震学联合研究会(IRIS)下载了MDJ台(44.62°N,129.59°E,位于牡丹江)1997年1月到2013年5月的波形数据,用于研究资料的补充.

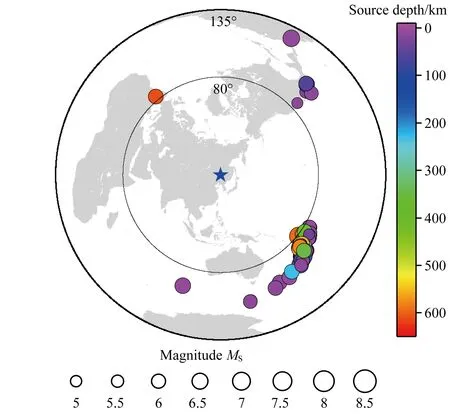
图2 事件震中分布图Fig. 2 The distribution map of the epicenters
在本次研究中,远震SKS震相被用来测量台站下方的各向异性.虽然所用事件绝大部分来自南太平洋地区,反方位角集中分布在120°~150°之间,但是加之其他区域也有部分事件分布,所以事件方位分布总体上满足研究的要求.我们挑选震中距大于80°,震级大于5.0的地震事件,以期获得高信噪比的SKS震相.我们所使用的地震事件目录来源于美国地质调查局(USGS),IASP91地球参考模型(Kennett and Engdahl, 1991)则用于计算波形的到时.最终我们选取了132个地震事件(图2),用于地震各向异性的测量.
为了更加有效地处理大批量剪切波数据,我们使用SplitLab软件(Wüstefeld et al., 2008)来获取剪切波分裂参数.它的优点是结合了旋转相关(RC)的方法(Bowman and Ando, 2007)和切向最小能量(SC)的方法(Silver and Chan, 1991),从而不仅可以验证分裂结果的有效性,而且还可以判断出无效分裂(null)的结果(Wüstefeld et al., 2008).无效分裂结果可能来源于以下三个方面的原因(Savage, 1999):(1)不存在明显的水平各向异性;(2)存在水平单层各向异性结构,但是快波方向平行或垂直于事件反方位角方向;(3)存在多层或是直立倾斜各向异性层位等复杂各向异性结构.对于每一个事件,我们在测量各向异性参数之前进行滤波处理(0.02~1 Hz),同时对于数据质量比较好的事件直接使用原始数据,保证分裂结果的可靠性.图3中所展示的是我们使用上述方法所得到的一个事件的处理结果,可以看出不同方法所得到的剪切波分裂参数还是非常一致的.
参照Wüstefeld等(2008)对分裂结果的判别标准,我们同时考虑以下三个方面对所得分裂结果进行质量评级(good,fair和poor):(1)原始波形的信噪比;(2)校正前后质子的运动轨迹;(3)等值线极值的收敛程度.最终我们只保留good和fair的处理结果,并且考虑到测量误差的影响,将延迟时间小于0.4 s的分裂结果认为是无效分裂.在所有147个台站中,129个台站得到了测量结果.其中有40个台站只得到了无效分裂,47个台站只得到了有效分裂.在结果分析中,考虑到结果的稳定性,我们采用SC方法得出的分裂参数,而RC方法所得结果只会被用做最终结果的质量评定.
3 剪切波分裂结果
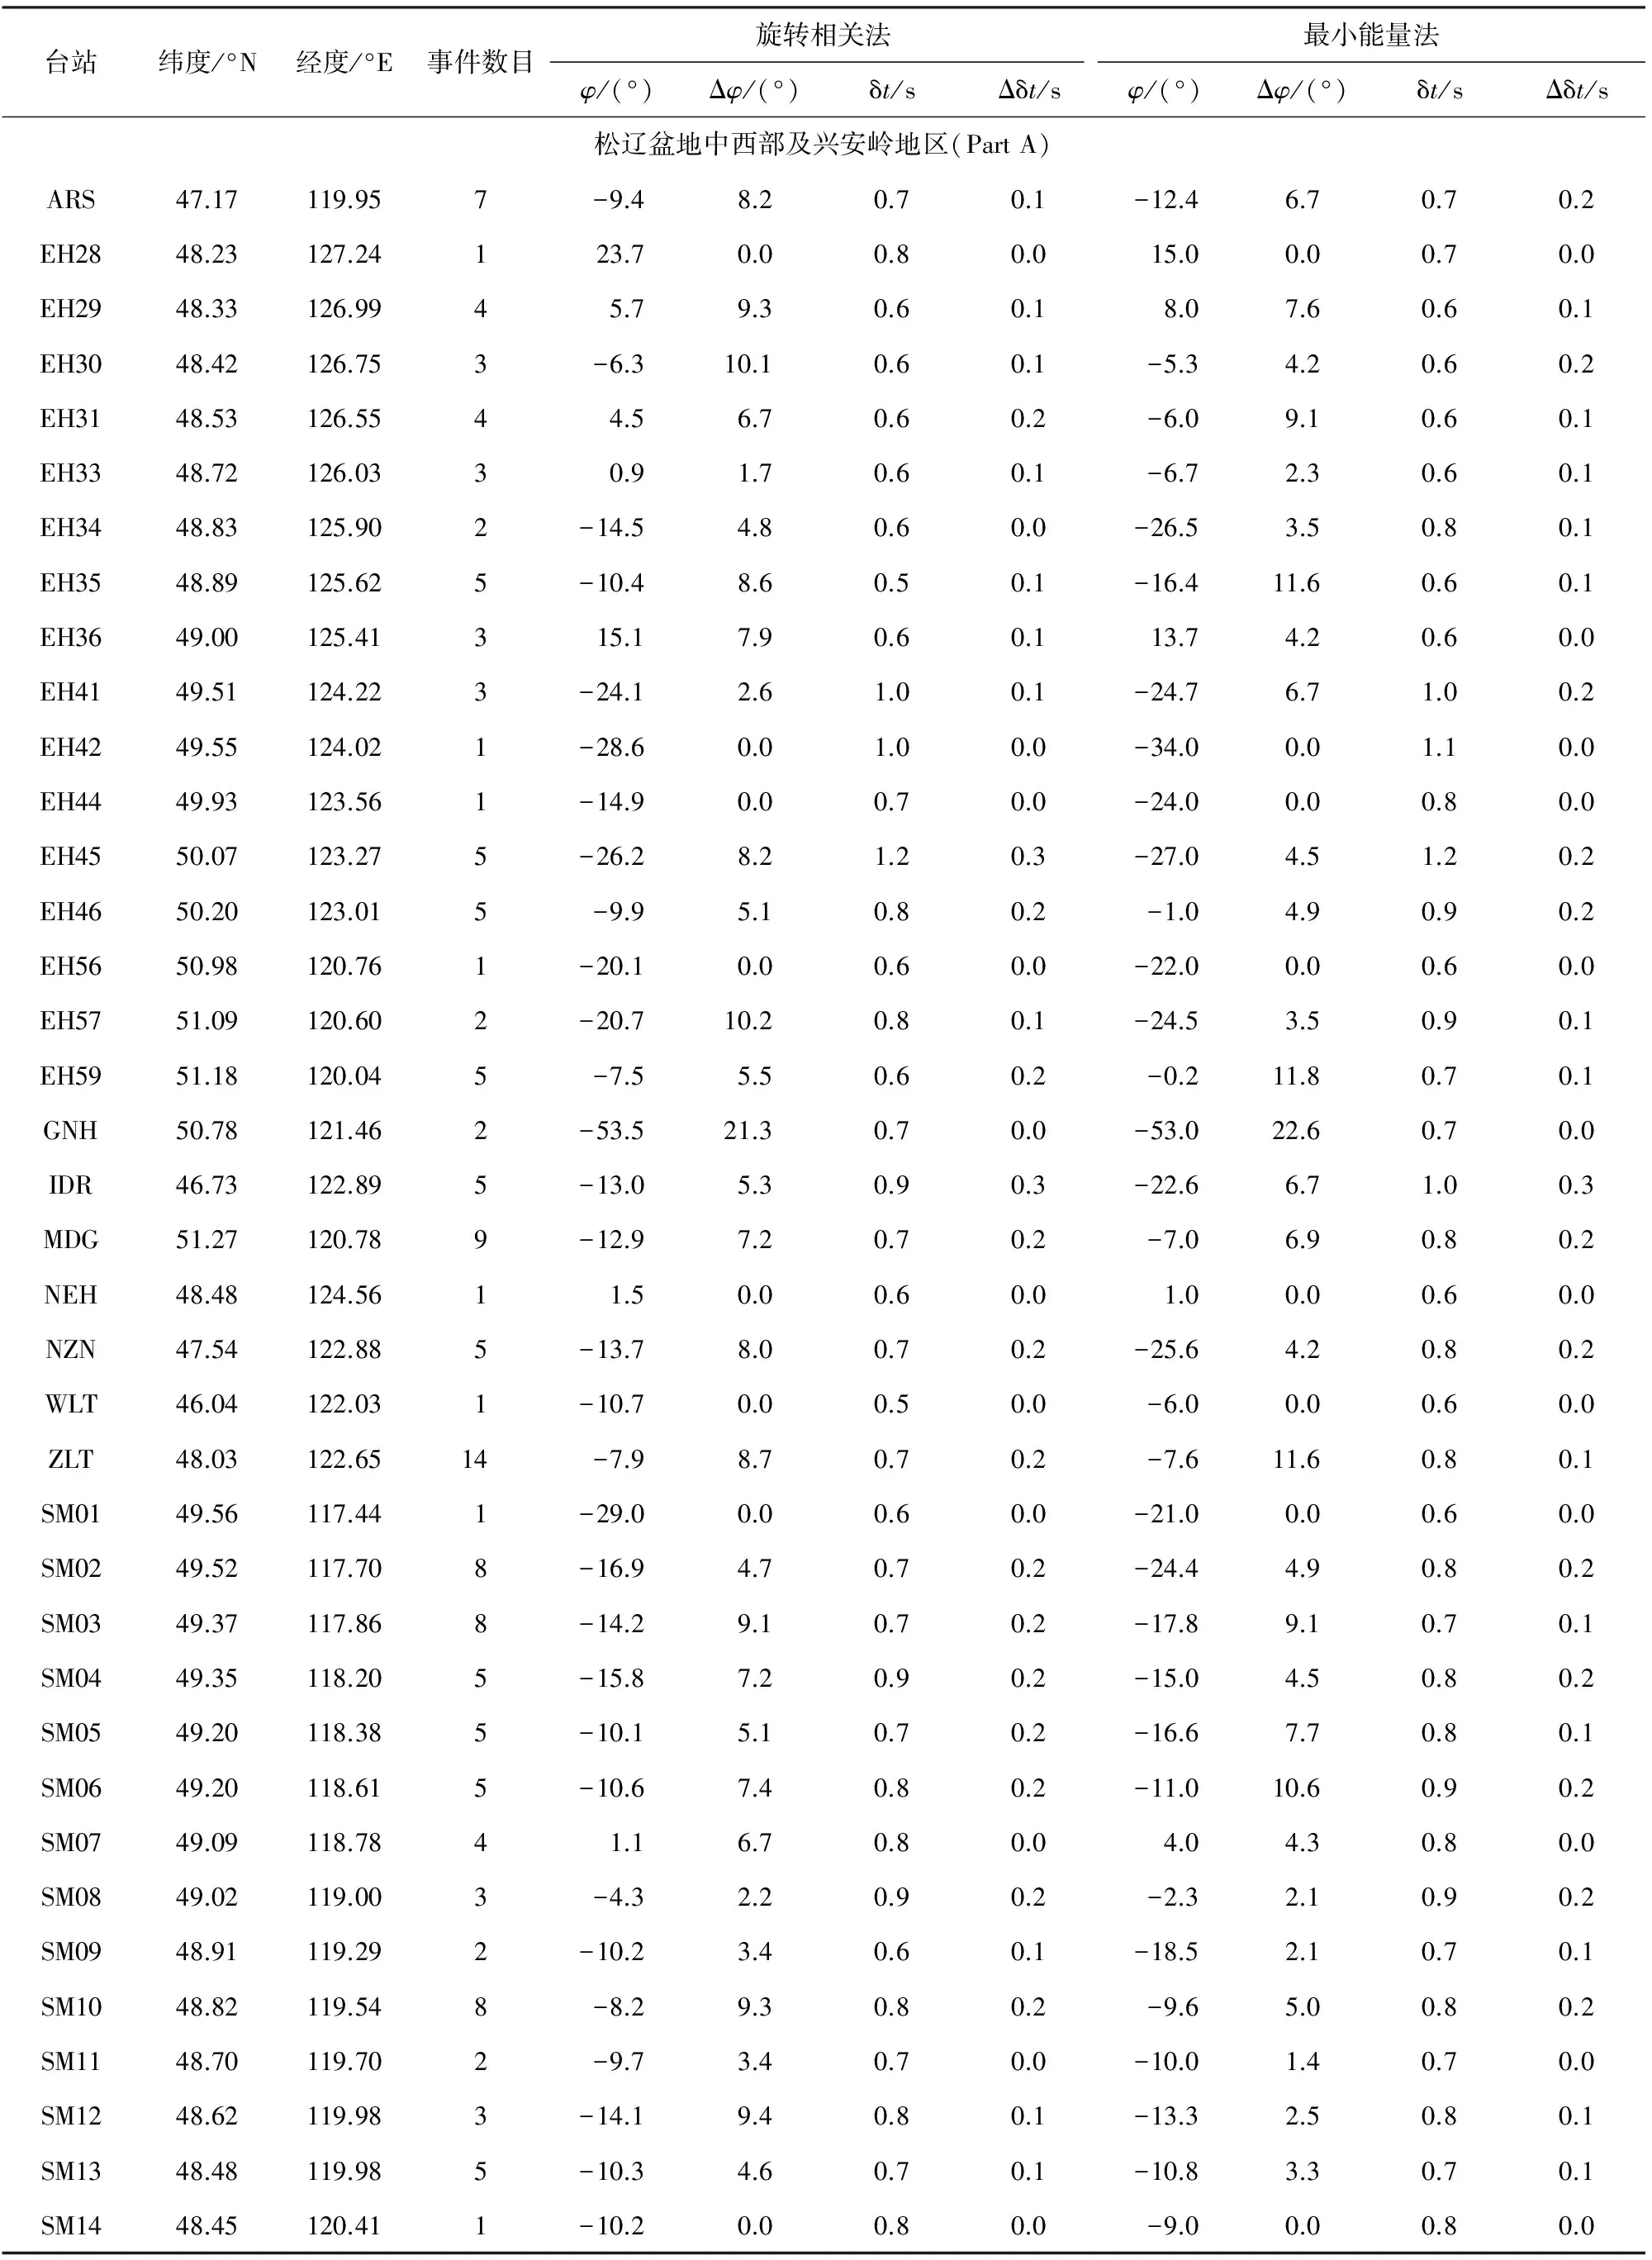
本次研究在90个台站得到了共计377对各向异性参数,在88个台站获得了251个null的结果.有效分裂的各向异性结果被展示在表1中,其中包含RC和SC方法的详细测量参数.为了便于分析和讨论,我们将每一组各向异性参数绘制在图4a中,将所有null的结果绘制在图4b中.
同时,我们还将测量结果与前人剪切波分裂研究结果进行了对比.即我们分别和Li和Niu(2010) 与Huang等(2011) 在相同的14个和6个台站上取得分裂结果(图5).在GNH台,我的测量到的各向异性方向虽然与Li和Niu(2010)较为一致,相差只有8°,但是与Huang等(2011)的结果相差66°;在JMS台,我的测量到的各向异性方向和Li和Niu(2010)的结果有48°的差异.除去这2个台的结果,在其他相同台站上,我们测量到的快波偏振方向与Li和Niu(2010)的结果平均只有9°的偏差,与Huang等(2011)的结果平均有14°的差异.前人在MDJ台测量所得结果较多,快波方向平均最大值为118°(Zheng and Gao, 1994), 最小值为78°±8°(Li and Niu, 2010), 而本研究得到的快波平均方向为99°±29°.总体上来说,我们得到的结果与前人的基本一致,说明了本次研究所得各向异性参数的可靠性.
为了更好地阐明研究区各向异性的特点,我们根据各向异性参数所表现出来的区域性特点将研究区划分为两个部分:第一部分包含松辽盆地中西部及大兴安岭地区(Part A);第二部分包含松辽盆地东部区域及佳木斯地块(Part B).

图3 使用SplitLab软件获取SKS震相分裂参数的示例左上方显示的是各向异性校正之前的初始地震波形:实线代表切向分量,虚线代表径向分量;垂直的虚线是理论震相到时,阴影区域为计算时窗.右上角显示的是结果的水平投影.上方中间显示事件信息以及三种方法所得的分裂参数.中间一行是旋转相关法(RC)所得结果:(a)快波和慢波波形对比图;(b)经过校正的径向分量和切向分量;(c)校正前后的质子运动轨迹;(d)相关系数随延迟时间和快波方向变化的极值图.最后一行展示的是最小能量法(SC)的结果:(e)快波和慢波波形对比图;(f)经过校正的径向分量和切向分量;(g)校正前后的质子运动轨迹;(h)切向分量最小能量图.Fig.3 Example of a SKS splitting measurement using the SplitLab packageThe upper left panel shows the initial seismograms before anisotropy correction: solid line is transverse component, dashed line is radial component, vertical dashed lines are theoretical phase arrival times and the shaded area represents the selected calculation window. The upper right panel represents a stereoplot of the result. Header shows the specification of teleseismic event as well as splitting parameters resulting from the three techniques. Center panels display the results from the Rotation-Correlation (RC) technique: (a) normalized components after rotation in RC anisotropy system; (b) corrected radial (dashed) and transverse (solid) components; (c) particle motion before (dashed) and after (solid) RC correction and (d) contour plot for the maximum value of correlation coefficient as function of delay time and fast polarization angle. Lower panel displays the results from the minimum energy (SC) technique: (e) normalized components after rotation in SC anisotropy system; (f) corrected radial (dashed) and transverse (solid) components; (g) SC particle motion before and after correction and (h) map of minimum energy on transverse component.
从图4a中我们可以看到,在Part A中,除去在GNH台站测量到一组N111°E的快波方向,所有台站下方的各向异性方向都集中在N143°E—N199°E范围内,平均值接近N169°E.此外可以明显看出,在松辽盆地西侧边缘,各向异性方向发生了偏转(图6),这种情况也在EH测线中表现出来(例如,EH42和EH43).在盆地中央,各向异性的方向则发生短暂的顺时针旋转,之后又变为逆时针旋转(从ZLT到SM37).另一方面,各向异性的延迟时间从0.4 s变化至1.6 s,平均值为0.85±0.23 s.如果假设各向异性程度为4%,那么该区域平均延迟时间对应着98±26 km的各向异性层厚度(Silver, 1996).值得注意的是在松辽盆地内(例如SM32等)和佳木斯地块部分台站(例如 EH24、YIL和SM47等),各向异性的延迟时间达到最小0.4 s左右,而位于松辽盆地西侧台站的各向异性延迟时间都比较稳定,维持在0.9±0.2 s.
相比较Part A中一致的NNE-SSE各向异性朝向,Part B中的各向异性就显得十分杂乱,NNW-SSE和W-E方向被同时观测到.NNW-SSE方向的各向异性方向变化范围为N155°E—N196°E,平均N172°E±11°.而其延迟时间的差异则十分明显,最小0.4 s,最大可达1.7 s.在相距80 km的LBE台站和EH13台站,延迟时间从1.7 s骤变为0.8 s,这可能暗示着该区域存在多种各向异性的成因.另一方面,我们在15个台站得到了W-E方向的各向异性,变化范围是N63°E—N113°E,平均值为N91°E.

表1 中国东北地区北部台站SKS震相分裂测量结果Table 1 The SKS splitting parameters for stations beneath the north of northeast China

续表1

续表1

图4 (a) 各向异性方向和延迟时间展示图,短线的方向与长短分别代表各向异性方向和延迟时间,黑色圆点表示台站的位置;(b)无效分裂结果展示图,平行或垂直于事件的反方位角的方向用十字线来表示,而红色的十字线代表只有无效分裂结果的台站Fig.4 (a) Individual splitting measurement plotted at each temporary station is characterized by their azimuths and the delay time (orientation and length of the segment, respectively). Location of each station is represented by black dot. (b) Null measurements plotted at the station location as crosses whose bars parallel and perpendicular to the back-azimuth of the analyzed events. The red crosses represent the results of solely null measurements. Black dots are the location of each station
其快慢波延迟时间从0.5 s变化至1.4 s,平均值为0.85±0.25 s.其中有4个台站(BAQ、HEG、MIH和SM47)同时观测到了2个不同方向的各向异性.遗憾的是,由于事件数目较少且分布范围集中,没能归纳出双层各向异性的模型.
既然我们在两个相距较近的台站得到了完全相反的各向异性结果,那么为了检验这个差异是否真实地反映了上地幔结构的差异,我们以MDJ和SM58台为例进行具体分析(图7).在MDJ台,有35个事件反方位角范围在N134—147°E之间,得到各向异性方向为N72—105°E.而在距MDJ台以东不足70 km的SM58台,有四个来自N133—141°E反方位角的事件,最终的到快波方向为N9—15°E.这说明来自同一个方向的地震事件在两个台站下方所得到的各向异性方向有显著变化,类似的结果同样也在HEG和JMS台被观察到,暗示该区域复杂的上地幔结构.
此外,在松辽盆地及佳木斯块体区域,null结果的地震事件反方位角与剪切波分裂方向既不平行也不垂直,说明存在多重复杂的各向异性成因;而在松辽盆地以西的区域,所有快波方向(除EH59和EH46)都被null结果所验证,表明该区域各向异性成因相对单调.
4 讨论
众所周知,由于剪切波分裂所得到的各向异性是整个传播路径上的各向异性的积累,所以确定各向异性的深度就显得十分困难.利用莫霍面Ps转换波对研究区地壳各向异性的研究表明(张广成等, 2013),地壳介质各向异性快慢波延迟时间约为0.15~0.3 s,相较SKS各向异性延迟小.吴晶等(2007)通过分析近震S波发现,中国北方的地壳各向异性变化范围只有0.1~0.3 s,因此我们认为中国东北地区地壳各向异性程度较弱,所测量到的各向异性主要来自于上地幔的贡献.
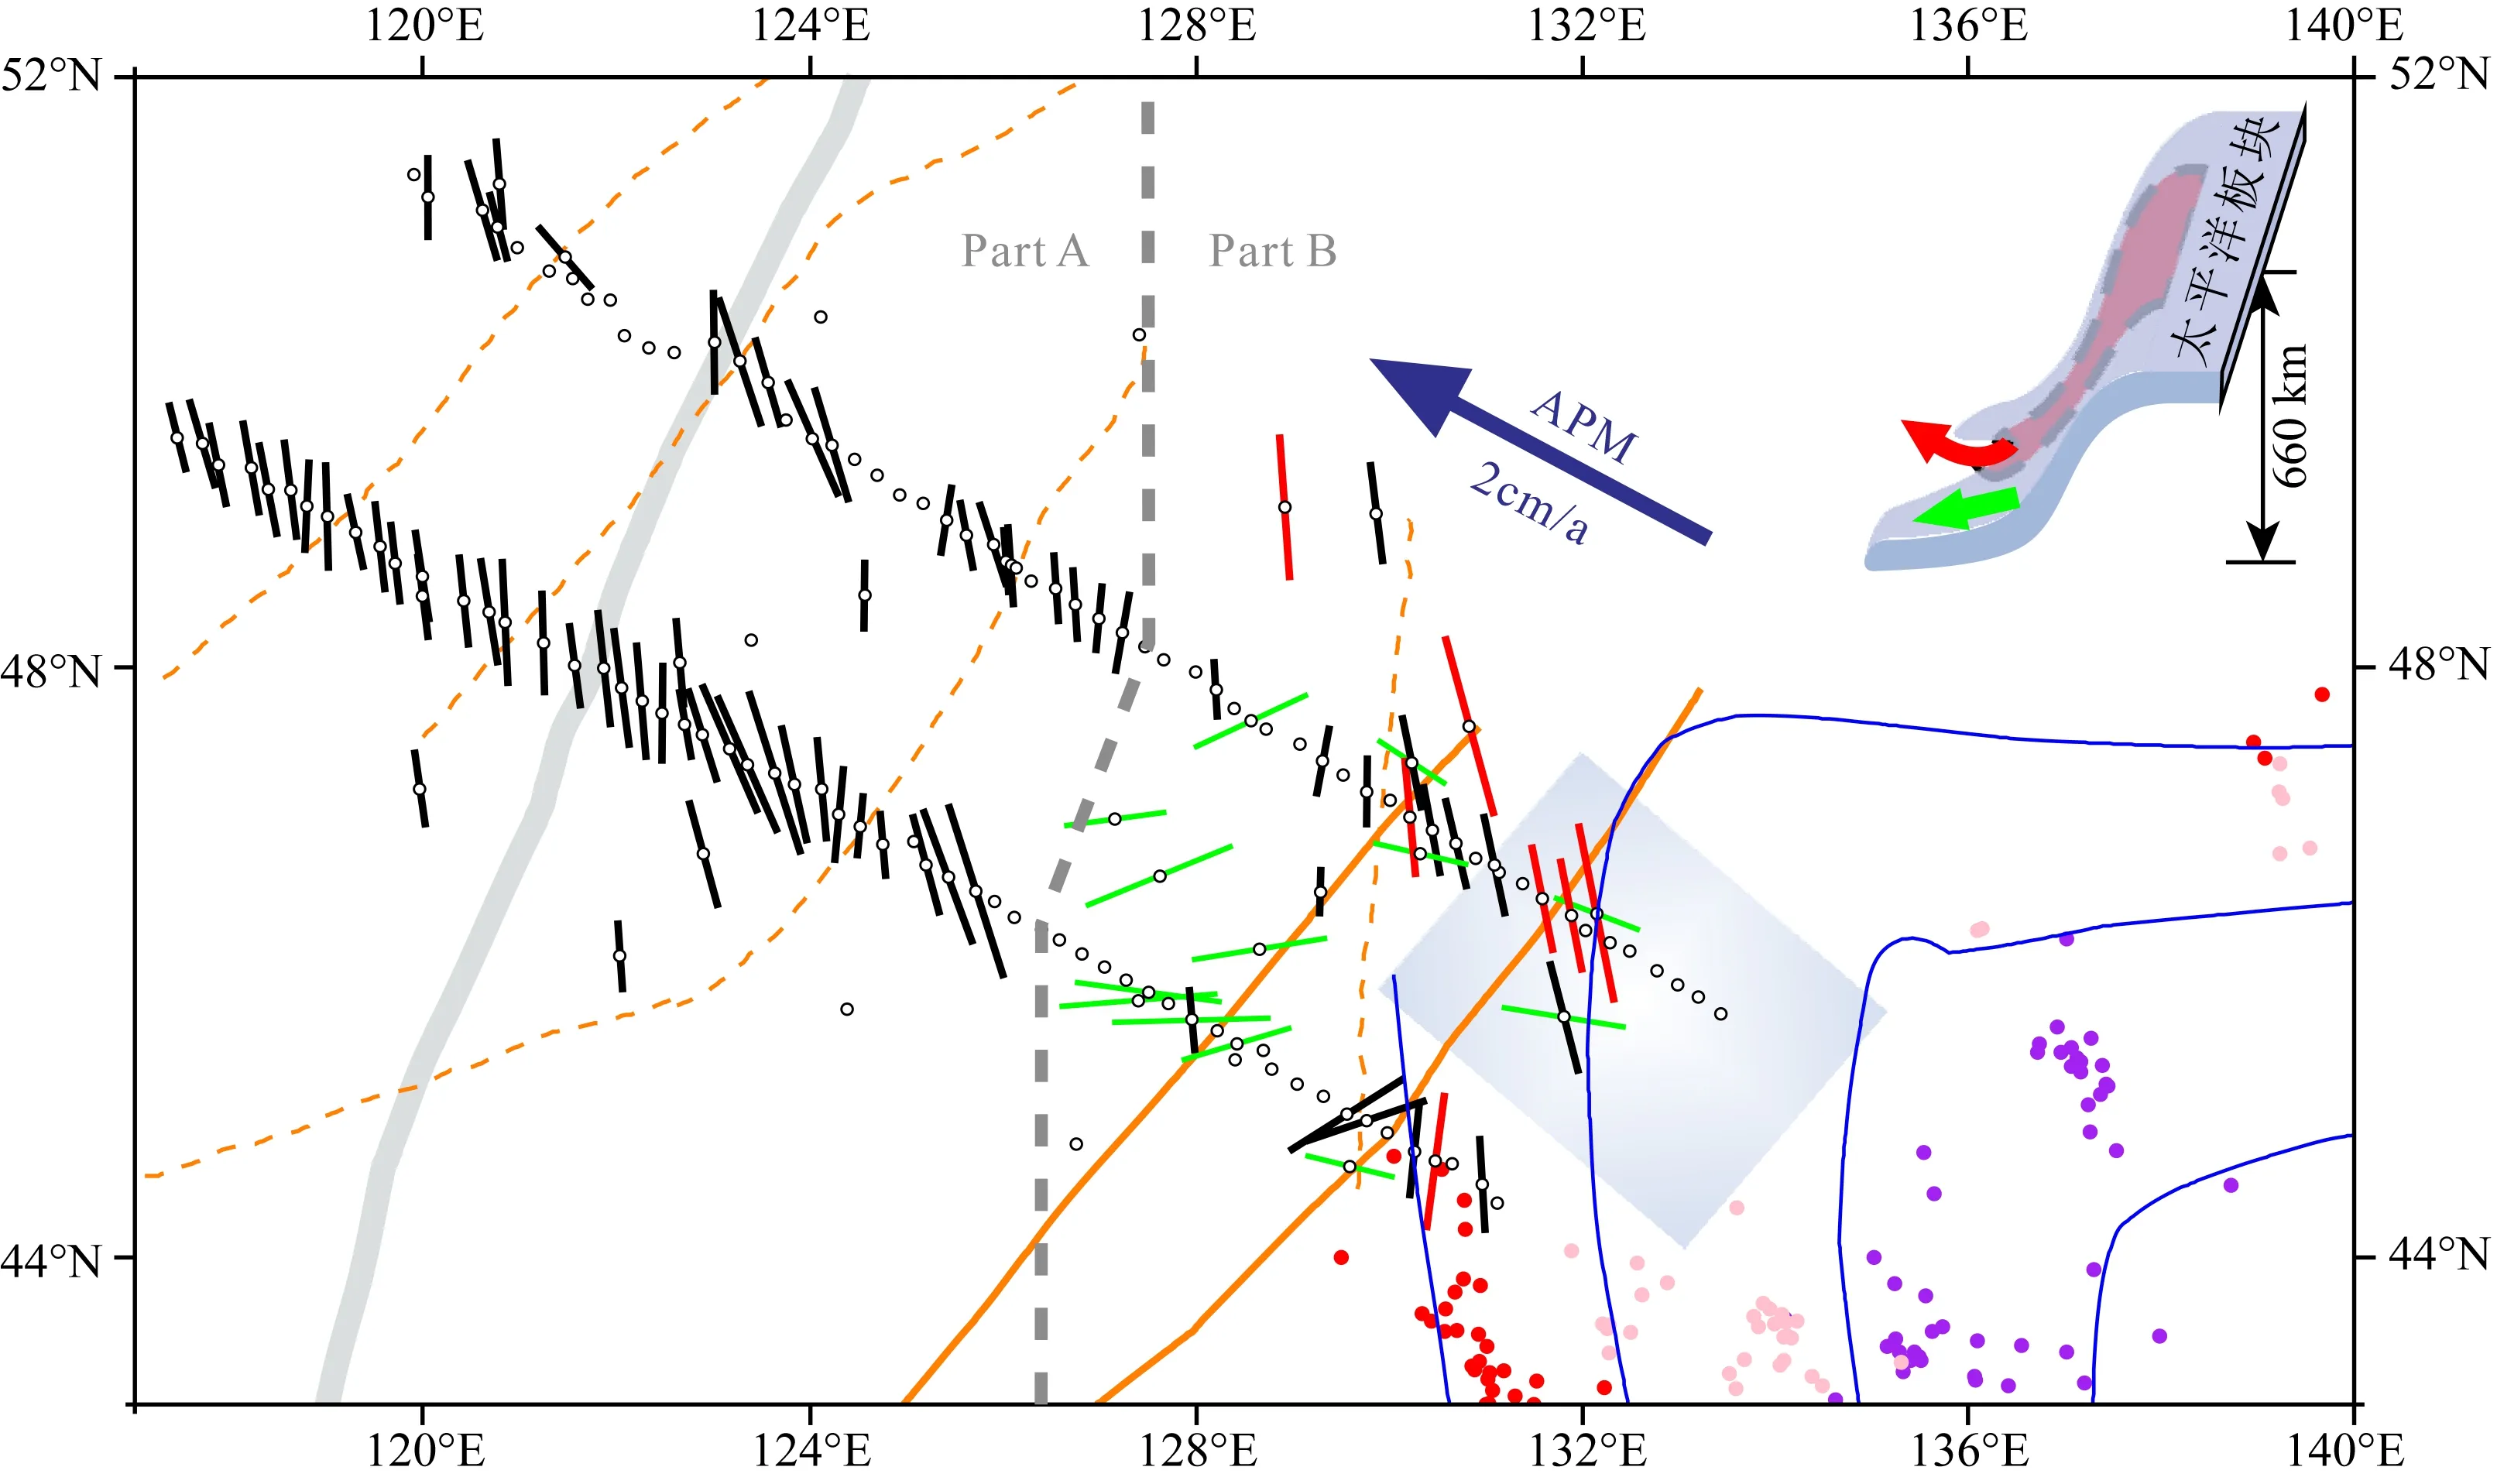
此外,刚性的岩石圈通常被认为漂浮在软流圈之上,由于岩石圈的运动拖曳软流圈地幔而产生的各向异性通常会平行于板块运动的方向(Vinnik et al., 1992).基于HS3-Nuvel1A板块运动模型所得出的研究区欧亚板块运动速度(相对于热点参考系)为2 cm·a-1,方向N62°W(Gripp and Gordon, 2002)(图8).显然,绝对板块运动方向(APM)与我们测量所得到的绝大多数各向异性方向有较大差别,所以这种机制也可能不是产生各向异性的主要因素.
4.1 各向异性与岩石圈中的古老形变
通常认为各向异性会记录岩石圈最后一次构造变形,无论这次变形发生在远古或是现今(Silver, 1996).从晚中生代以来,中国东北地区岩石圈经历了多期拉张作用(Ren et al., 2002).在侏罗纪时期,太平洋板块向西的持续俯冲,导致中国东北地区岩石圈挤压增厚.而在早白垩纪时期,由于俯冲板块的转向,岩石圈从挤压转为拉张并伴随着岩石圈地幔的拆沉(Wang et al., 2006; Zhang et al., 2010).中国东北地区这一时期的拉伸环境得到了岩石年代学研究的支持(Wu et al., 2005).此外,变质核杂岩的研究也表明,早白垩纪时期的岩石圈有NW-SE向的拉伸构造(Allen et al., 1997).前人通过实验和地质调查发现,在伸展构造区域,矿物的定向排列往往平行于构造伸展方向,从而使得各向异性的方向与伸展方向一致(Savage, 1999).另一方面,各向异性层位的厚度是影响各向异性延迟时间的主要因素.中国东北地区岩石圈的拆沉以及活跃的热地幔物质上涌都会破坏保留在岩石圈中的古老形变,可能是造成松辽盆地部分台站和佳木斯地块NW-SE或NNW-SSE朝向各向异性延迟时间明显小于研究区平均水平的原因.体波成像结果显示,松辽盆地下方呈现以高速为主、高低速异常的混合,可能存在岩石圈拆沉过程;而佳木斯地块岩石圈下方表现为局部低速区,说明有热地幔物质上涌(张风雪等, 2013,2014).接收函数的研究结果表明,松辽盆地下方的岩石圈比兴安地块减薄近50 km (Zhang et al., 2014).如果假设4%的各向异性程度,那么这将对应着各向异性延迟时间减少约0.4 s,与我们观测的结果所吻合.因此我们认为,中国东北上地幔各向异性反映了岩石圈拉张形变,这种古老形变自晚中生代以来就一直被保存在岩石圈内,并在后期经历了不同程度的改造.

图5 各向异性方向与前人研究结果对照图Fig.5 Comparison diagram of mean anisotropy directions against with previous studies

图7 MDJ和SM58台剪切波偏振方向玫瑰图(6°分割)Fig.7 Rose diagrams of fast directions beneath MDJ and SM58, plotted in bins of 6°

图6 SM测线部分台站下方各向异性参数随经度的变化趋势(a) 各向异性延迟时间; (b) 快波极化方向.Fig. 6 Variations of the mean anisotropy parameters obtained along the latitude beneath several stations from SM seismic line(a) The delay times; (b) Fast polarization directions.
4.2 各向异性与太平洋俯冲板块
中生代以来,日本海沟的持续东移(Miller et al., 2006),造成了太平洋俯冲板块的回撤,并可能会导致俯冲板块下方地幔呈现平行于海沟方向的各向异性(Peyton et al., 2001).这种现象与实验室所观察到的俯冲模型结果一致(Kincaid and Griffiths, 2003).另一方面,俯冲板片的形态会对地幔流产生显著影响(Long and van der Hilst, 2005; Kneller and van Keken, 2007).Li和Niu(2010)认为太平洋俯冲板块可能在地震活动性缺失的区域存在撕裂,其向东的回撤会引起地幔北西向的流动,从而解释该区域出现的NNW-SSE方向且延迟时间较大的各向异性.而Karato(2003)认为俯冲带各向异性的变化与含水量和压力条件有关.在距离海沟比较近的地方,由于俯冲板块含水量高或是受到压力大,会产生“B型”橄榄石矿物晶体的定向排列(Jung and Karato, 2001),从而产生平行于海沟方向的各向异性;在远离海沟区域,随着地幔物质的脱水或是压力减小,“A型”橄榄石矿物晶体定向排列,产生方向与海沟垂直的各向异性.这种模型也很好解释了Part B区域中所观察到的两组方向近乎正交的各向异性.

图8 研究区台站下方各向异性参数综合分析图小圆圈代表台站的位置.黑色、绿色和红色的短棒代表各向异性参数,其中红色的短棒是NNW-SSE朝向的并且延迟时间大于1.0 s的各向异性,而绿色的短棒则代表近W-E向的各向异性.紫色的箭头为绝对板块运动速度.橙色的实线和虚线分别代表断层与缝合带的位置.灰色宽线代表南北重力梯度带.实心圆点代表了深部地震活动性(紫色: 300~400 km; 粉红色: 400~500 km; 红色:>500 km).蓝色阴影区域是太平洋俯冲板块可能存在撕裂的地方.右上角的图是我们提出的太平洋板块撕裂模型:蓝色和红色分别表示太平洋俯冲板块和地幔流.绿色的箭头表明了俯冲板块的移动方向,而红色的箭头表明了地幔可能流动的方向.Fig.8 Comprehensive analysis diagram of the measured fast directions and splitting timesLocations of stations are represented by little circles.Black, green and red bars represent the anisotropy parameters, of which the red bars represent the NNW-SSE trending anisotropy with delay time lager than 1.0s and the green bars represent the nearly W-E trending anisotropy. The purple arrow represents the absolute plate motion vector of the Eurasian plate (Gripp and Gordon, 2002).The orange solid and dash line indicate branches of the Tanlu fault and the suture zone, respectively.The grey wide line represents the North South Gravity lineament. Deep seismicity is shown as solid dots (purple: 300~400 km; pink: 400~500 km; red:>500 km).The shaded area indicates a speculative slab tear. The upper right shows our proposed slab-tear model for the origin of anisotropy under this area:the subducting Pacific slab and the mantle flow are shown in blue and red, respectively.The green arrow indicates the subduction of the Pacific slab and the red arrow indicates the possible direction of the mantle flow.
另一方面,我们认为只出现在佳木斯地块中的近W-E向的各向异性,可能是太平洋板块在地幔过渡带中俯冲所留下的痕迹.Liu等(2008)在分析SKS分裂的基础上通过对比近震S波分裂时间与事件震源深度的关系,认为MDJ台下方的各向异性主要来源于地幔过渡带.而数值模拟和岩石物理实验表明,地幔过渡带中两种主要矿物(瓦兹利石和尖晶橄榄石)都不能在SKS路径上产生明显的各向异性(Tommasi et al., 2004; Li et al., 2006).因此,我们所观察到的近W-E向的各向异性就很可能来自于太平洋俯冲板块中的橄榄石.橄榄石—瓦兹利石相变的数值模拟研究发现,在俯冲板块中其相变发生的深度可以超过地幔过渡带深度上百公里(Devaux et al., 1997; Schubert et al., 2001).接收函数研究结果表明(Liu et al., 2015),在纬度40°N—46°N之间,660 km间断面产生下沉,暗示着太平洋俯冲板块在地幔过渡带的滞留,这与我们所观测到的W-E方向的各向异性区域相符合.因此,我们认为太平洋板块的西向俯冲,造成了板块中亚稳定状态的橄榄石矿物晶体定向排列,从而产生W-E向的各向异性.
5 结论
我们测量了位于中国东北地区共计147个地震台站的剪切波分裂数据,从中获取的大量各向异性参数为我们了解该区域上地幔结构提供了很好的约束.我们所得结果与前人具有很好的一致性,其表明中国东北地区上地幔各向异性十分复杂,可能与多种成因机制有关.整个研究区内,NW-SE朝向的各向异性与研究区晚中生代岩石圈拉张变形方向一致,平均延迟时间约0.8 s,我们认为岩石圈中残存的古老形变是产生各向异性的原因.同时,由于岩石圈拆沉或是地幔热物质的上涌,使得残留在岩石圈中的古老形变减弱,可能是松辽盆地和佳木斯地块部分区域各向异性延迟时间较小的原因.研究区东部(Part B),NNW-SSE向的延迟时间较大的各向异性可能与太平洋板块撕裂回撤而产生的地幔流动有关,而太平洋板块在地幔过渡带中的俯冲则可能是W-E向的各向异性产生的主要成因.此外由于太平洋板块俯冲而产生的橄榄石矿物含水量和压力环境的变化也是造成研究区上地幔各向异性的可能因素.致谢 感谢所有参与到中国东北流动地震观测工作中的同志,感谢中国地震局地球物理研究所“国家数字测震台网数据备份中心”提供的固定台地震波形数据.与张瑞青副研究员和李永华研究员的讨论对本文十分有益.匿名审稿专家的宝贵修改意见使得本文更加严谨、流畅.文章大部分图件使用GMT软件绘制(Wessel and Smith, 1998).
Allen M B, Macdonald D I M, Xun Z, et al. 1997. Early Cenozoic two-phase extension and late Cenozoic thermal subsidence and inversion of the Bohai Basin, northern China.MarineandPetroleumGeology, 14(7-8): 951-972.
Bowman J R, Ando M. 2007. Shear-wave splitting in the upper-mantle wedge above the Tonga subduction zone.GeophysicalJournalInternational,88(1):25-41.
Christensen N I. 1984. The magnitude, symmetry and origin of upper mantle anisotropy based on fabric analyses of ultramafic tectonites.GeophysicalJournalInternational, 76(1): 89-111. Devaux J P, Schubert G, Anderson C. 1997. Formation of a metastable olivine wedge in a descending slab.JournalofGeophysicalResearch:SolidEarth(1978—2012), 102(B11): 24627-24637. Fischer K M, Parmentier E M, Stine A R, et al. 2000. Modeling anisotropy and plate-driven flow in the Tonga subduction zone back arc.JournalofGeophysicalResearchSolidEarth, 105(B7): 16181-16191. Gripp A E, Gordon R G. 2002. Young tracks of hotspots and current plate velocities.GeophysicalJournalInternational, 150(2): 321-361.Huang Z C, Wang L S, Zhao D P, et al. 2011. Seismic anisotropy and mantle dynamics beneath China.EarthandPlanetaryScienceLetters, 306(1-2): 105-117.
Jung H, Karato S. 2001. Water-induced fabric transitions in olivine.Science, 293(5534): 1460-1463.
Jung H, Mo W, Green H W. 2009. Upper mantle seismic anisotropy resulting from pressure-induced slip transition in olivine.NatureGeoscience, 2(1): 73-77.
Karato S. 2003. Mapping water content in the upper mantle.∥ Geophysical Monograph Series. Washington, DC: American Geophysical Union, 138: 135-152.
Kennett B L N, Engdahl E R. 1991. Traveltimes for global earthquake location and phase identification.GeophysicalJournalInternational, 105(2): 429-465.
Kincaid C, Griffiths R W. 2003. Laboratory models of the thermal evolution of the mantle during rollback subduction.Nature, 425(6953): 58-62.
Kneller E A, van Keken P E. 2007. Trench-parallel flow and seismic anisotropy in the Mariana and Andean subduction systems.Nature, 450(7173): 1222-1225.
Li J, Niu F L. 2010. Seismic anisotropy and mantle flow beneath northeast China inferred from regional seismic networks.JournalofGeophysicalResearch:SolidEarth(1978—2012), 115(B12).
Li L, Weidner D J, Brodholt J, et al. 2006. Elasticity of Mg2SiO4ringwoodite at mantle conditions.PhysicsoftheEarthandPlanetaryInteriors, 157(3): 181-187.
Liu K H, Gao S S, Gao Y, et al. 2008. Shear wave splitting and mantle flow associated with the deflected Pacific slab beneath northeast Asia.JournalofGeophysicalResearch:SolidEarth(1978—2012), 113(B1).
Liu Z, Niu F L, Chen Y J, et al. 2015. Receiver function images of the mantle transition zone beneath NE China: New constraints on intraplate volcanism, deep subduction and their potential link.EarthandPlanetaryScienceLetters, 412: 101-111.
Long M D, van der Hilst R D. 2005. Upper mantle anisotropy beneath Japan from shear wave splitting.PhysicsoftheEarthandPlanetaryInteriors, 151(3-4): 206-222.
Long M D, Silver P G. 2008. The subduction zone flow field from seismic anisotropy: A global view.Science, 319(5861): 315-318. Long M D, Silver P G. 2009. Shear wave splitting and mantle anisotropy: measurements, interpretations, and new directions.SurveysinGeophysics, 30(4-5): 407-461.
Miller M S, Kennett B L N, Toy V G. 2006. Spatial and temporal evolution of the subducting Pacific plate structure along the western Pacific margin.JournalofGeophysicalResearch:SolidEarth(1978—2012), 111(B2).
Nicolas A, Christensen N I. 1987. Formation of anisotropy in upper mantle peridotites—a review. ∥ Composition, Structure and Dynamics of the Lithosphere-Asthenosphere System. Washington DC: AGU, 111-123. Peyton V, Levin V, Park J, et al. 2001. Mantle flow at a slab edge: Seismic anisotropy in the Kamchatka region.Geophys.Res.Lett., 28(2): 379-382.
Ren J Y, Tamaki K, Li S T, et al. 2002. Late Mesozoic and Cenozoic rifting and its dynamic setting in Eastern China and adjacent areas.Tectonophysics, 344(3-4): 175-205.
Sandvol E, Ni J. 1997. Deep azimuthal seismic anisotropy in the southern Kurile and Japan subduction zones.JournalofGeophysicalResearch:SolidEarth(1978—2012), 102(B5): 9911-9922.Savage M K. 1999. Seismic anisotropy and mantle deformation: what have we learned from shear wave splitting?.ReviewsofGeophysics, 37(1): 65-106. Schubert G, Turcotte D L, Olson P. 2001. Mantle Convection in the Earth and Planets 2 Volume Set. Cambridge: Cambridge University Press.engör A M C, Natal'In B A, Burtman V S. 1993. Evolution of the Altaid tectonic collage and Palaeozoic crustal growth in Eurasia.Nature, 364(6435): 299-307. Silver P G, Chan W W. 1991. Shear wave splitting and subcontinental mantle deformation.J.Geophys.Res., 96(B10): 16429-16454. Silver P G. 1996. Seismic anisotropy beneath the continents: Probing the depths of geology.Annu.Rev.EarthPlanet.Sci., 24(1): 385-432.
Silver P G, Gao S S, Liu K H. 2001. Mantle deformation beneath southern Africa.Geophys.Res.Lett., 28(13): 2493-2496.
Tommasi A, Mainprice D, Cordier P, et al. 2004. Strain-induced seismic anisotropy of wadsleyite polycrystals and flow patterns in the mantle transition zone.JournalofGeophysicalResearch:SolidEarth(1978—2012), 109(B12): B12405.
Vinnik L P, Makeyeva L I, Milev A, et al. 1992. Global patterns of azimuthal anisotropy and deformations in the continental mantle.GeophysicalJournalInternational, 111(3): 433-447.
Wang F, Zhou X H, Zhang L C, et al. 2006. Late Mesozoic volcanism in the Great Xing′an Range (NE China): Timing and implications for the dynamic setting of NE Asia.Earth&PlanetaryScienceLetters, 251(1-2): 179-198.
Wessel P, Smith W H F. 1998. New, improved version of generic mapping tools released.EosTransactions, 79(47): 579-579.
Wu F Y, Sun D Y, Li H M, et al. 2002. A-type granites in northeastern China: age and geochemical constraints on their petrogenesis.ChemicalGeology, 187(1-2): 143-173.
Wu F Y, Lin J Q, Wilde S A, et al. 2005. Nature and significance of the Early Cretaceous giant igneous event in eastern China.EarthandPlanetaryScienceLetters, 233(1-2): 103-119.
Wu J, Gao Y, Chen Y T, et al. 2007. Seismic anisotropy in the crust in northwestern capital area of China.ChineseJournalofGeophysics(in Chinese), 50(1): 209-220, doi: 10.3321/j.issn:0001-5733.2007.01.027.
Wüstefeld A, Bokelmann G, Zaroli C, et al. 2008. SplitLab: A shear-wave splitting environment in Matlab.Computers&Geosciences, 34(5): 515-528.
Zhang F X, Wu Q J, Li Y H. 2013. The traveltime tomography study by teleseismic P wave data in the Northeast China area.ChineseJournalofGeophysics(in Chinese), 56(8): 2690-2700, doi: 10.6038/cjg20130818.
Zhang F X, Wu Q J, Li Y H. 2014. A traveltime tomography study by teleseismic S wave data in the Northeast China area.ChineseJournalofGeophysics(in Chinese), 57(1): 88-101, doi: 10.6038/cjg20140109.
Zhang G C, Wu Q J, Li Y H, et al. 2013. An investigation on crustal anisotropy of Northeast China using Moho Ps converted phase.ActaSeismologicaSinica(in Chinese), 35(4): 485-497.
Zhang J H, Gao S, Ge W C, et al. 2010. Geochronology of the Mesozoic volcanic rocks in the Great Xing′an Range, northeastern China: implications for subduction-induced delamination.ChemicalGeology, 276(3-4): 144-165.Zhang R Q, Wu Q J, Sun L, et al. 2014. Crustal and lithospheric structure of Northeast China from S-wave receiver functions.EarthandPlanetaryScienceLetters, 401: 196-205. Zhang X Z, Yang B J, Wu F Y, et al. 2006. The lithosphere structure in the Hingmong-Jihei (Hinggan-Mongolia-Jilin-Heilongjiang) region, northeastern China.GeologyinChina(in Chinese), 33(4): 816-823, doi: 10.3969/j.issn.1000-3657.2006.04.011.
Zhao D P, Tian Y, Lei J S, et al. 2009. Seismic image and origin of the Changbai intraplate volcano in East Asia: role of big mantle wedge above the stagnant Pacific slab.PhysicsoftheEarthandPlanetaryInteriors, 173(3-4): 197-206.
Zheng S H, Gao Y. 1994. Azimuthal anisotropy in lithosphere on the Chinese mainland from observations of SKS at CDSN.ActaSeismologicaSinica, 7(2): 177-186.
Zheng X F, Ouyang B, Zhang D N, et al. 2009. Technical system construction of Data Backup Centre for China Seismograph Network and the data support to researches on the Wenchuan earthquake.ChineseJournalofGeophysics(in Chinese), 52(5): 1412-1417, doi: 10.3969/j.issn.0001-5733.2009.05.031.
附中文参考文献
吴晶, 高原, 陈运泰等. 2007. 首都圈西北部地区地壳介质地震各向异性特征初步研究. 地球物理学报, 50(1): 209-220, doi: 10.3321/j.issn:0001-5733.2007.01.027.
张风雪, 吴庆举, 李永华. 2013. 中国东北地区远震P波走时层析成像研究. 地球物理学报, 56(8): 2690-2700, doi: 10.6038/cjg20130818.
张风雪, 吴庆举, 李永华. 2014. 中国东北地区远震S波走时层析成像研究. 地球物理学报, 57(1): 88-101, doi: 10.6038/cjg20140109.
张广成, 吴庆举, 李永华等. 2013. 利用莫霍面PS震相研究中国东北地区地壳各向异性. 地震学报, 35(4): 485-497.
张兴洲, 杨宝俊, 吴福元等. 2006. 中国兴蒙—吉黑地区岩石圈结构基本特征. 中国地质, 33(4): 816-823, doi: 10.3969/j.issn.1000-3657.2006.04.011.
郑秀芬, 欧阳飚, 张东宁等. 2009. “国家数字测震台网数据备份中心”技术系统建设及其对汶川大地震研究的数据支撑. 地球物理学报, 52(5): 1412-1417, doi: 10.3969/j.issn.0001-5733.2009.05.031.
(本文编辑 胡素芳)
Upper mantle anisotropy beneath the north of northeast China and its dynamic significance
QIANG Zheng-Yang, WU Qing-Ju*
InstituteofGeophysics,ChineseEarthquakeAdministration,Beijing100081,China
Northeast China located in the eastern part of the Central Asian Orogenic Belt (CAOB), one of the largest Paleozoic orogens on Earth. Surrounded by the Siberian craton, North China plate and the Pacific plate, northeast China is characterized by widespread Cenozoic intraplate volcanism and lithospheric deformation caused by multiepisode extension since Late Mesozoic.As the only area developing deep earthquake in China, northeast China has suffered the subduction of the Pacific plate, which makes it become the natural laboratory of studying the lithospheric deformation, subduction and intraplate volcanos and also their interaction relationship.Seismic anisotropy determined by the splitting of shear waves, especially the core-refracted phases like SKS, is one of the most direct and effective ways to image the structure and deformation in the interior of the Earth. We measure the shear wave splitting parameters,the fast polarization direction (φ) and the splitting time between the fast and slow waves (δt), using the SplitLab analysis software package which combine both the rotation-correlation (RC) method and the transverse minimum energy (SC) method. A quality factor (good, fair, or poor) is assigned to all the shear wave splitting measurements,according to the signal to noise ratio of the initial phase, the rectilinear polarization of the particle motion after correction, and well-defined extreme value of contour plot.Only the measurements marked as ‘good’ or ‘fair’ are retained in the subsequent analysis and discussion, and the delay times less than 0.4 s will be marked as null measurements based on measurement error consideration.A total of 377 pair of SKS splitting measurements obtained at 147 temporary and permanent seismic stations in northeast China are used to infer the upper mantle structure of this area. The shear wave splitting results at most of stations in western part of our study area are characterized by homogeneously oriented fast directions trending N143°E to N199°E with an average close to N169°E, in agreement with the extensional orientation of the Late Mesozoic lithosphere. Additionally, the delay times vary from 0.4 s to 1.6 s with a mean value of 0.85±0.23 s and correspond to a 98±26 km thick layer if 4% anisotropy is assumed, suggesting the anisotropy mainly reside in the lithosphere. Several anisotropy with small delay times (~0.4 s) are observed in the Songliao basin and Jiamusi massif which are probably caused by the lithosphere delamination or the hot mantle upwelling that partially eroded the ancient deformation frozen within lithosphere.While in the eastern part, NNW-SSE trending fast directions with large delay times (larger than 1.0 s) are observed. As the missing of the deep seismicity of this area, we speculate that there exist a slab tear at the end of Pacific plate, whose roll-back may induce NW trending mantle flow. In addition, nearly W-E fast splitting directions are observed in Jiamusi massif only, which can be best explain by the LPO of metastable olivine within the Pacific slab.
Northeast China; Shear-wave splitting; Seismic anisotropy; SKS phase
10.6038/cjg20151010.
Qiang Z Y, Wu Q J. 2015. Upper mantle anisotropy beneath the north of northeast China and its dynamic significance.ChineseJ.Geophys. (in Chinese),58(10):3540-3552,doi:10.6038/cjg20151010.
国家自然科学基金(41474074、90814013)和国土资源部探测技术与实验研究专项(SinoProb-02-03)联合资助.
强正阳,男1988年生,在读博士生,主要从事地震各向异性及动力学方面的研究. E-mail:qmail@aliyun.com
*通讯作者 吴庆举,男,1966年生,研究员,主要从事地震学、地球内部结构以及动力学研究.E-mail:wuqj@cea-igp.ac.cn
10.6038/cjg20151010
P315
2015-08-11,2015-09-18收修定稿
强正阳, 吴庆举. 2015. 中国东北地区北部上地幔各向异性及其动力学意义.地球物理学报,58(10):3540-3552,

