
Effect of experimental parameters on the micro hardness of plasma sprayed alumina coatings on AZ31B magnesium alloy
2015-02-16 01:44:18ThirumalaikumarasamyShanmugamKamalamoorthyBalasubramanianVisvalingam
Journal of Magnesium and Alloys 2015年3期
D.Thirumalaikumarasamy*,K.Shanmugam Kamalamoorthy,V.Balasubramanian Visvalingam
Department of Manufacturing Engineering,Annamalai University,Annamalainagar,Chidambaram,Tamil Nadu 608 002,India
Effect of experimental parameters on the micro hardness of plasma sprayed alumina coatings on AZ31B magnesium alloy
D.Thirumalaikumarasamy*,K.Shanmugam Kamalamoorthy,V.Balasubramanian Visvalingam
Department of Manufacturing Engineering,Annamalai University,Annamalainagar,Chidambaram,Tamil Nadu 608 002,India
Surface treatment of engineering materials has recently become important for serviceable engineering components.Many techniques such as thermal and thermo chemical surface treatments have been used to develop surface characteristics of materials.Hardness is the most important property,which infuences considerably service life characteristics of coatings.In this investigation,alumina coatings were deposited by atmospheric plasma spray technique under different levels of power,stand-off distances and powder feed rates.Empirical relationship was developed to predict the micro hardness of alumina coatings by incorporating the plasma spray process parameters.The input power and the stand-off distance appeared to be the most signifcant two parameters affecting the hardness of the coating among the three investigated process parameters.Further,correlating the spray parameters with coating properties enables the identifcation of characteristics regime to achieve desired quality of coatings.
Hardness;Plasma spraying;Alumina coating;Mg alloy
1.Introduction
Magnesium alloys are considered as good candidates for many structural components of automobile,aerospace and military industries to satisfy the demand for weight reduction, improving fuel effciency and reducing greenhouse gas emissions[1].In addition,magnesium alloys(AZ31)are attractive increasingly for their combination of outstanding properties such as low density,high specifc strength and stiffness and high mechanical damping capability[2,3].Magnesium has good castability,machinability and easy recycling ability. Furthermore,it can also be used in the communication and electronics industry for good electromagnetic shielding characteristics[4].More recently the usage of magnesium alloy has increased gradually as magnesium alloy has the potential to replace aluminum and some plastics in a variety of applications in the automotive and aerospace industries.However,the application of magnesium alloy has been restricted because of poor surface property.In order to further expand the application of magnesium alloys,surface modifcation processes such as chemical conversion coatings[5],plasma electrolytic oxidation (PEO)[6,7],physical vapor deposition(PVD)[8]and laser surface treatment[9,10]have been applied to improve surface properties of Mg alloy.
Among these techniques,atmospheric plasma spraying is one of the most commonly used thermal spraying processes because of its fexibility,high deposition rates and multifunction.Plasma spraying is employed to deposit coatings of almost all materials including metal alloys,ceramics and cermet with a congruent melting point onto the substrate.It is known that the properties of plasma spraying coating is related to many parameters of plasma spraying process such as the powder feed rate, the spraying power and the spraying distance.These parameters directly infuence the heat and mass transfer between particles and plasma jet,and then affect the degree of melting of particles,the temperature and in-fight velocity of droplets before they impact on the substrate[11].
Ceramic coatings are commonly employed for thermal and environmental protection of metal components operating at severe working conditions[12].Their application is able to improve the resistance and the durability of the underlying components,thus reducing their placement of worn out partsand the relative idle times.Among them Al2O3coatings are good candidates for anti-wear and anti-corrosion applications, due to their high hardness,chemical inertness and high melting point,as well as to their high resistance to abrasion and erosion [13].
The microstructure and the mechanical properties of the coating are infuenced by the spraying parameters,such as the spraying power,stand-off distance,powder feed rate,etc.These parameters affect the thermal energy and kinetic energy of particles.If particles are subjected to an excess of thermal energy,they can be vaporized in the plasma jet rather than arriving at the substrate in the fully molten condition[14]. However,if the particles receive too little thermal energy,they arrive at the substrate in an unmelted condition.In the last decades,the importance of the link between the spraying parameters and coating quality has been appreciated.As for all materials,the hardness of a coating is a measure of the resistance to plastic deformation.It is widely recognized that the hardness increases with the increasing coating density,i.e. decreasing number of pores and microcracks[15].
Venkataraman et al.[16]studied the infuence of porosity, pore size,spatial and topological distribution of pores on microhardness of plasma sprayed ceramic coatings and reported that among several microstructural features,porosity seems to have a stronger infuence on mechanical property such as micro hardness.Prystay et al.[17]studied the correlation between the particle temperature and velocity and the structure of plasma sprayed zirconia coatings,to determine which parameter most strongly infuences the coating structure.They inferred that the temperature of the sprayed particles has a larger effect on the coating properties than the velocity.Ruiz-Luna et al.[18]investigated the effect of HVOF processing parameters on the properties of NiCoCrAlY coatings by design of experiments.The results of their investigation showed that the response surface,the empirical relationships among the variables,and the response parameters allowed the selection of optimum deposition parameters and the improvement of coating properties.Saravanan et al.[19]reported that the coating quality is directly related to the corresponding coating microstructure,which is signifcantly infuenced by the spray parameters employed.A study byYongYang et al.[20]opined that the coating prepared by applying spraying power of 30 kW had the maximum microhardness,which was attributed to the maximum Al2O3content present in the coating and the most uniform microstructure of the coating.A factorial designed experiment was used by Jandin et al.[21]to analyze the correlation between operating conditions and the microstructure and mechanical properties of twin wire arc sprayed steel coatings. Results show that direct relationships do exist between spray conditions,oxide content in the coating,and microhardness.
Conversely,role of spraying parameters such as power, stand-off distance,and powder feed rate on the micro hardness of plasma sprayed ceramic coatings on magnesium alloy has not yet been reported in the literature.Hence,the present investigation was carried out to develop an empirical relationship to predict the hardness of plasma sprayed alumina coatings.The effect of input power,stand-off distance and powder feed rate on micro hardness of alumina coating is reported in this paper.
Abbreviations
APS Atmospheric plasma spraying
P Power
S Stand-off distance
F Powder feed rate
RSM Response surface methodology
HV0.3 Hardness
2.Methodology
2.1.Identifying the important process parameters
An initial step in the design of experiments is to select independently controllable process parameters.It has been widely recognized in the thermal spray community that there are many hundreds of parameters,which can potentially infuence the properties of the coatings.For economic(time requirements) and theoretical reasons (interdependence of parameters),it is not possible to control all possible parameter variations.According to the literatures[16–21]and our laboratory experiences[22],the predominant factors which are having more infuence on coating characteristic in plasma spraying process were identifed.They are as follows:
(i)input power(kW);
(ii)stand-off distance(mm);
(iii)powder feed rate(mm).
These are the primary operational parameters contributing to the melting and fattening of the powder particles,subsequently, infuencing the coating characteristics of plasma sprayed coatings.
2.2.Finding the working limits of the parameters
A large number of spraying trials were conducted on gritblasted 16-mm-thick AZ31B alloy substrate coupons to determine the feasible working range of the above factors by varying one of theAPS spray parameters and keeping the rest of them at constant value.The chemical compositions of the AZ31B alloy used in this study are as follows(in wt.%):Al 3.0,Zn 0.1,Mn 0.2 and Mg balance.Plasma spraying of the alumina powder was carried out using an APS system 40 kW IGBT-based Plasmatron(Make:IonArcTechnologies,India;Model:APSSII).Before spraying,the substrate was grit blasted with corundum at a pressure of 4.2 bars and cleaned with ethanol to remove any remaining dust or grease from the surface.Deposition was performed using argon and nitrogen as plasmaforming gases.The necessary number of spraying passes was carried out to obtain a ceramic layer thickness of 240µm.The working limits of the spraying parameters were discussed elaborately in our previously published paper[22].
2.3.Metallographic preparation
Metallographic cross sections of the coatings were prepared for the porosity and microhardness measurements.The sampleswere frst carefully cut to the specifc dimensions (10×10×2 mm3).They were then mounted with low viscosity epoxy resin under vacuum environment.The mounted samples were successively ground with 600,800,1000 and 1500 grit SiC papers and eventually polished using diamond slurries of 10–8,8–5,5–2,2–0.5,0.5–0 mm during 5,5,7,10 and 10 min, respectively.Because of pullouts in brittle materials,it is diffcult to establish and evaluate true porosity in a metallographically prepared spray coating.As metallographic grinding and polishing,if not carried out correctly,can introduce artifacts which are not part of the coating structure.Ceramic coatings are brittle and particles break out of the surface during grinding. If not polished thoroughly,these break out sleave an incorrect impression of a high porosity.Similar procedures were followed by the other investigators[23,24].
2.4.Developing the design matrix
With a view to study the effects of the considered process parameters on the micro hardness,statistically designed experiments,based on a factorial technique,were used to reduce the cost and time and to obtain the required information pertaining to the main and the interaction effects of the parameters on the response.Table 1 presents the process factors with their corresponding levels and Table 2 presents the design matrix according to coded levels.
2.5.Recording responses
In this present investigation,the plasma spraying was carried out according to the design of experiments,at each condition, three specimens were coated as prescribed by the design matrix. The experiments were conducted in a random order to prevent systematic errors infltrating the system.
2.5.1.Porosity analysis
As per the procedure laid out inASTM B 276 standard[25], the porosity measurement was carried out on the well-polished cross-sectional area of the coating,using an optical microscope (Make:Meiji,Japan;Model:MIL-7100)equipped with an image analyzing software(MetalVisonVersion 6).In this study, the images captured under 1000×magnifcation by optical microscopy were chosen for porosity analysis as desired features like open pores and network of cracks were properly revealed.Initially,a 400×400µm square area was selected on the polished cross-section of the coating and the image was analyzed.The same procedure was repeated at fve random locations to fnd out the average percentage volume of porosity. It was explained in Fig.1.
2.5.2.Microhardness measurements
Microhardness measurements were operated by indenting on the metallographic cross sections under 300 g load for 15 s using a Vickers microhardness tester(Make:Shimadzu,Japan; Model:HMV-2T).For each coating sample,the measurement series comprised 20 random indentations.Distance between indentations was kept three times longer than the indentation diagonal to prevent the effects of the stress feld of nearby indentations.
The Scanning Electron Microscope(Make:Jeol,Japan; Model:6410-LV)was used to analyze the size and morphology of the parent materials.The powder is fused and then crushed,which gives its characteristic angular shape as shown in Fig.2. SEM micrographs of the plasma-sprayed alumina coating are shown in Fig.3a,b.A number of microcracks were observed on the surface of the coating.Fig.4a,b shows the optical microstructure and SEM images of the alumina coating.From these micro-graphs,it can be seen that the coating microstructure consists of completely melted splat structures,unmelted particulate regions,pores between the splats and cracks within the splats.EDS analysis of the interface area(Fig.5)detected the presence of Al and O in the coating.
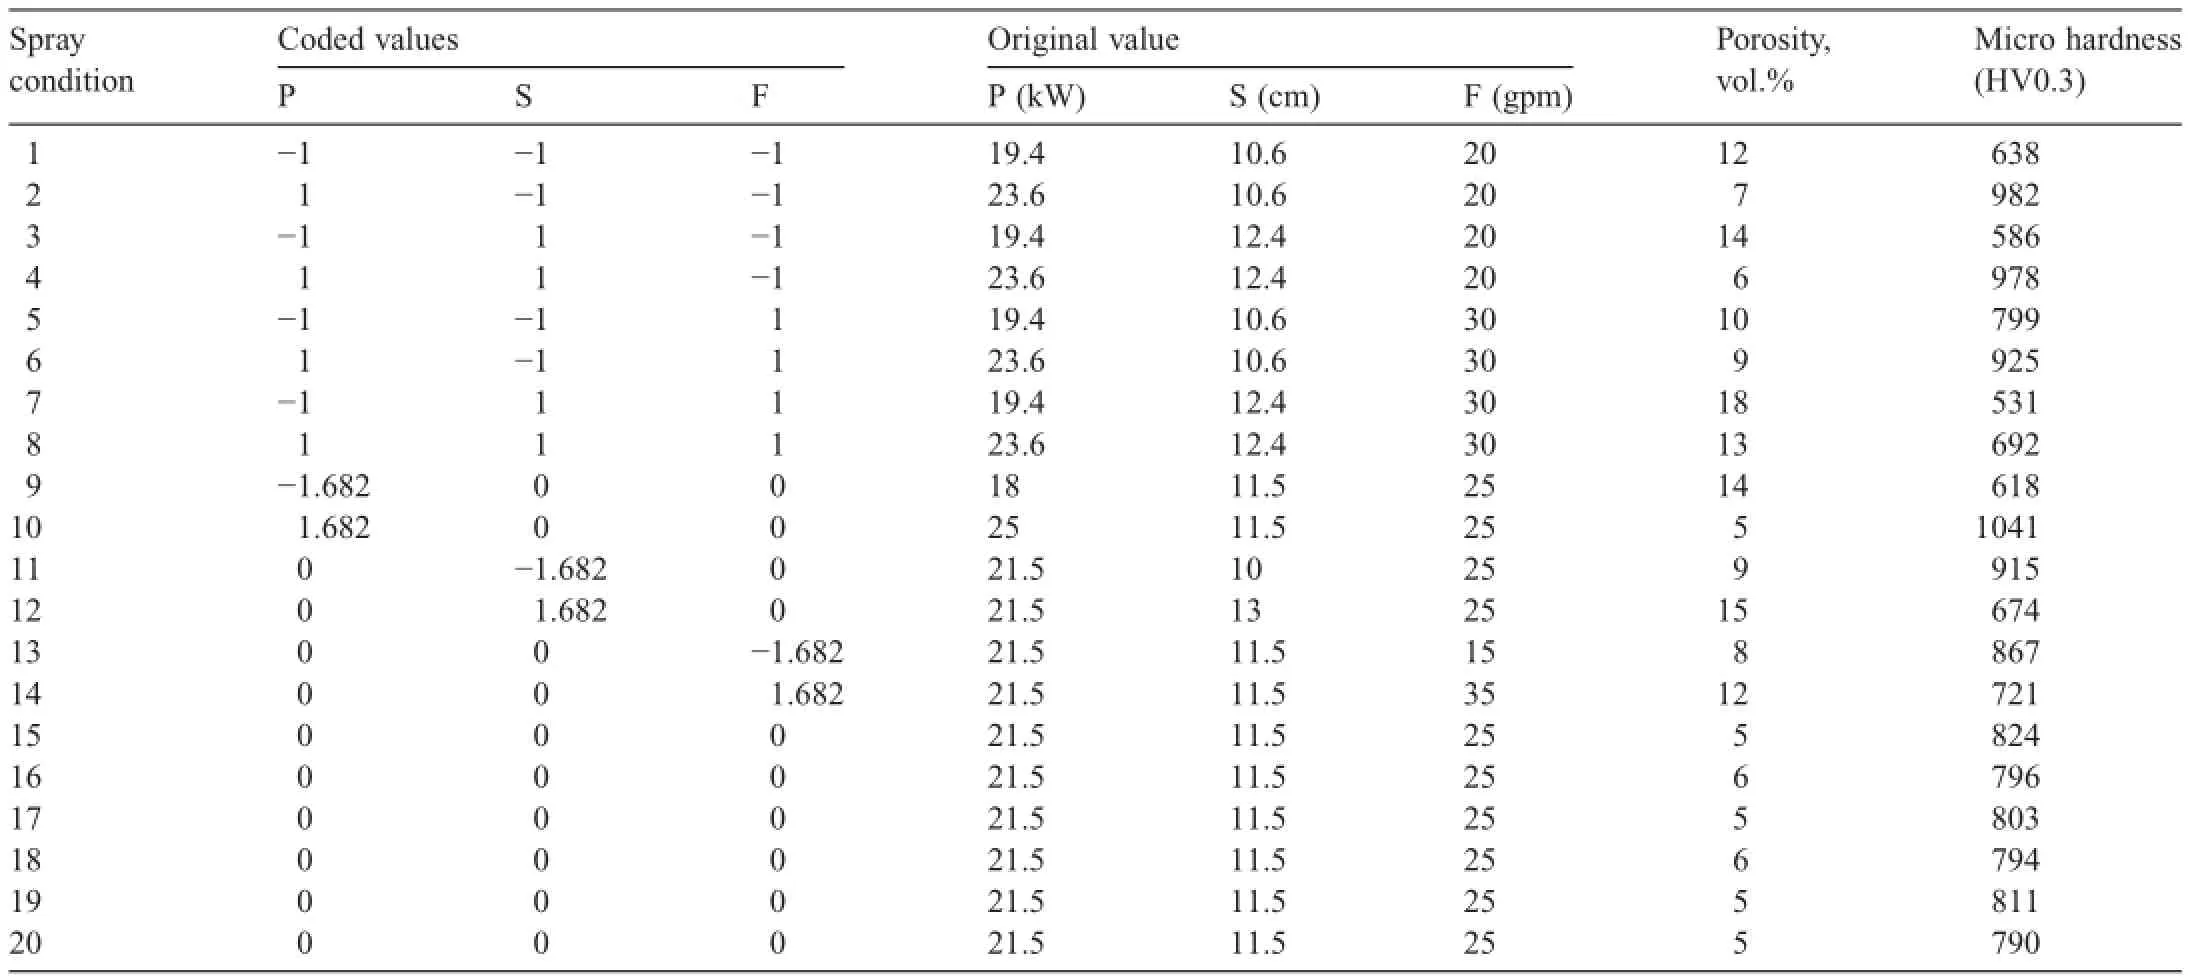
Table 2Design matrix and experimental results.
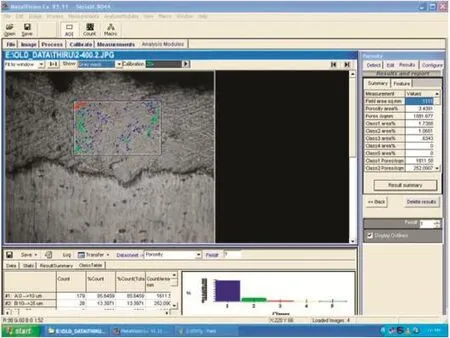
Fig.1.Measure the porosity level using computer image analyzing software.
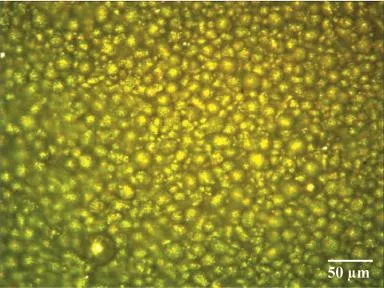
Fig.2.Optical micrograph of the Al2O3powder.
3.Predictive statistical model for microhardness
In this study,a response surface model-building technique was utilized to predict the microhardness in terms of the input power,the stand-off distance and the powder feed rate.Details of the model building technique are discussed below.
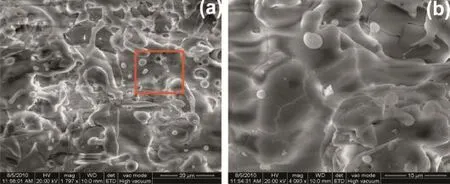
Fig.3.SEM surface morphology of alumina coating.
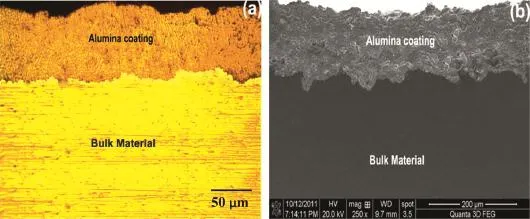
Fig.4.Optical microstructure and SEM image of the coating.
3.1.Response surface methodology(RSM)
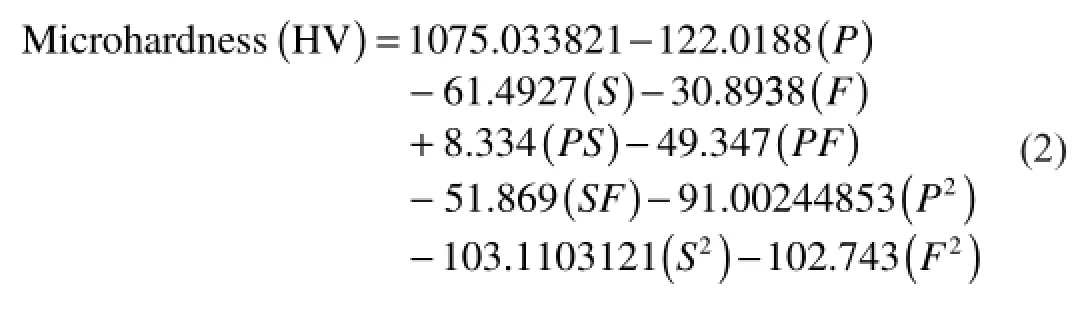
RSM is an experimental strategy that explores the space of the process independent variables,and an empirical statistical modeling,to develop an appropriate relationship between the responses(output)and the process variables or factors(input). In the present investigation,to correlate the process parameters and the micro hardness,an empirical relationship was developed to predict the responses based on experimentally measured values.The response is a function of power(P),stand-off distance(S),powder feed rate(F)and hence it can be expressed as

The empirical relationship chosen includes the effects of the main and interaction effect of all factors.The construction of empirical relationship and the procedure to calculate the values of the regression coeffcients can be referred elsewhere[26].In this work,the regression coeffcients were calculated with the help of Design Expert V 8.1 statistical software.After determining the coeffcients(at a 95%confdence level),the fnal empirical relationship was developed using these coeffcients. The fnal empirical relationship to estimate the response is given below:
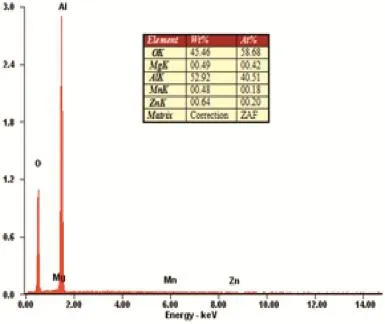
Fig.5.EDAX analysis.
3.2.Checking the adequacy of the model
In this investigation,analysis of variance(ANOVA)is used to check the adequacy of the developed empirical relationship. ANOVA test results are presented in Table 3.The adequacy of the model was tested using theANOVA technique.In this study, the modelFvalue and the associated probability values are checked to confrm the signifcance of the empirical relationships.Further,using theF-values,the predominant factors which have the major and minor effects on the responses could be assessed.From theFvalue assessment,it was found that the predominant factors which have direct infuence on the responses as per hierarchy are power,stand-off distance and powder feed rate.The determination coeffcient(R2)indicates the goodness of ft for the model.In all the cases,the value of the determination coeffcient(R2>0.99)indicates that less than 1%of the total variations are not explained by the empirical relationships.The value of the adjusted determination coeffcient is also high,which indicates the high signifcance of the empirical relationships.The predictedR2values also show good agreement with the adjustedR2values.Adequate precision compares the range of the predicted values at the design points with the average prediction error.At the same time,a relatively low value of the coeffcient of variation indicates the improved precision and the reliability of the conducted experiments.The value of probability>Fin Table 3 for the empirical relationship are less than 0.05,which indicates that the empirical relationships are signifcant.Lack of ft was not signifcant for the developed empirical relationship as desired[27].The normal probability plots for the response are shown in Fig.6.From the fgure,it could be inferred that the residuals fall on the straightline,which shows that the errors were distributed normally. Collectively,these results indicate the excellent capability of the regression model.Further,correlation graphs were drawn relating experimental values and predicted values as shown in Fig.7 and it is found that the developed empirical relationships can be effectively used for prediction purpose.
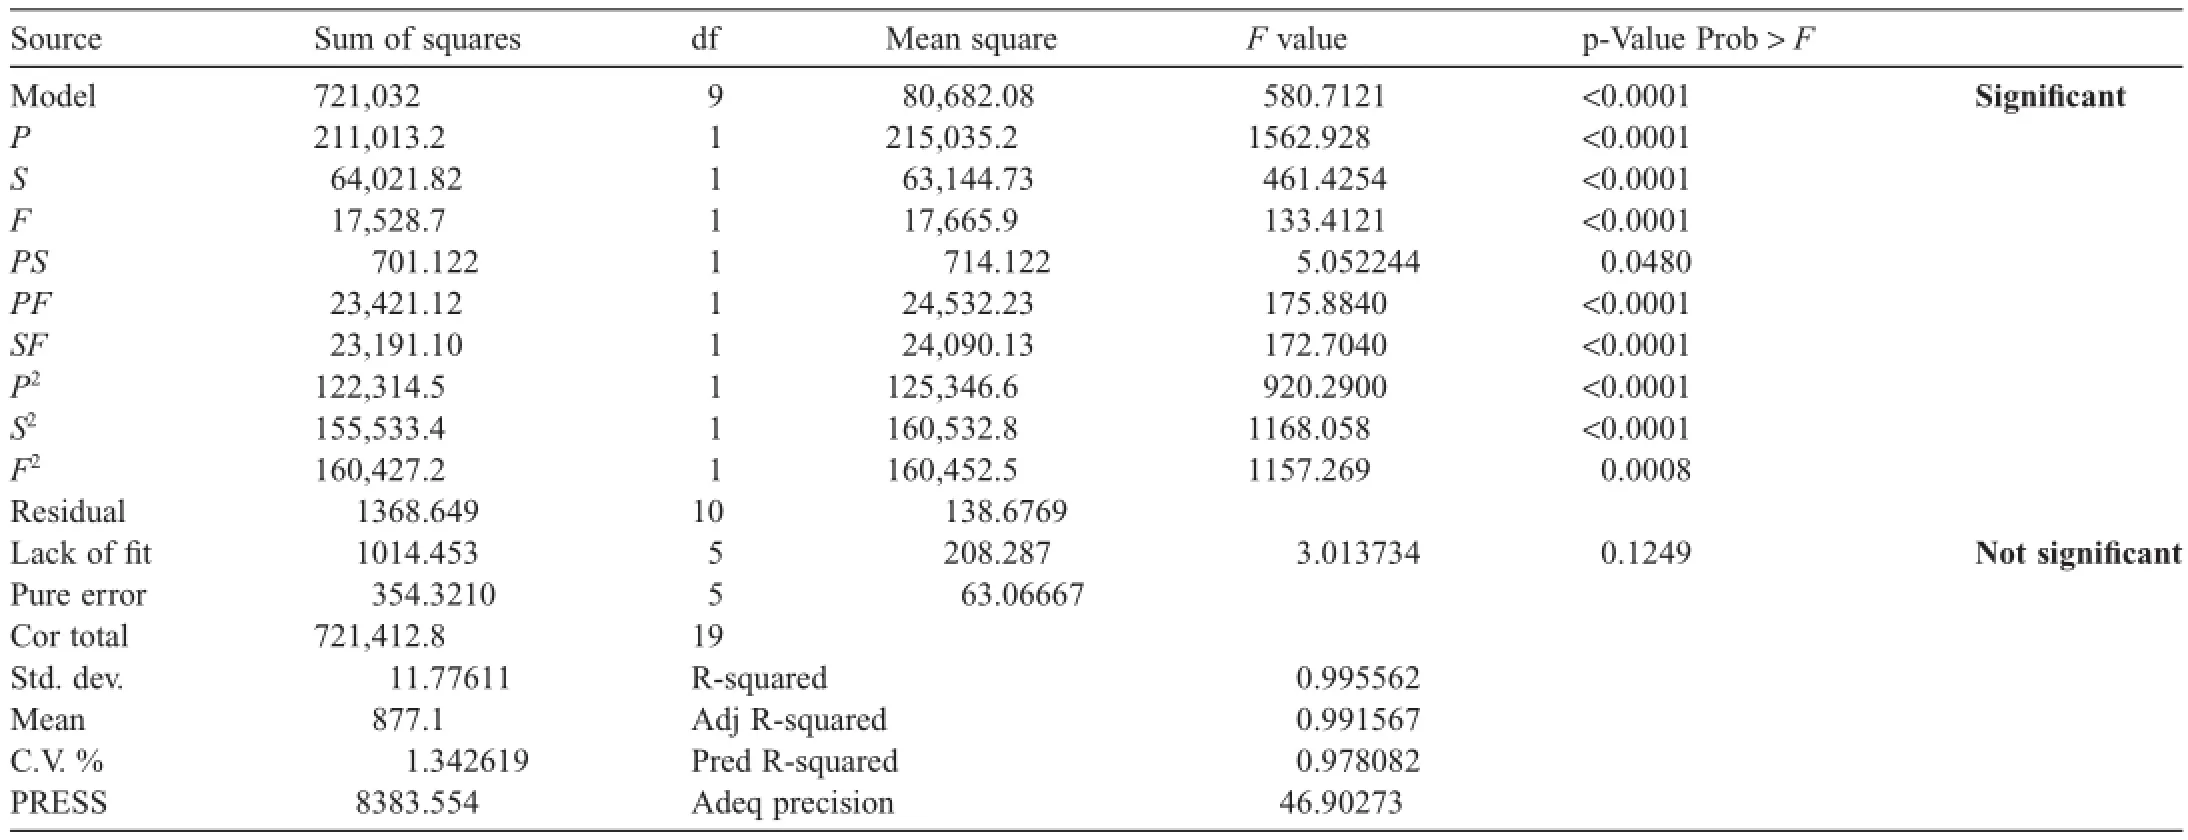
Table 3ANOVA test results.
4.Results and discussion
4.1.Effect of input power on microhardness
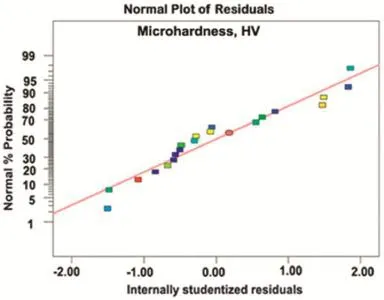
Fig.6.Normal probability plot for the response.
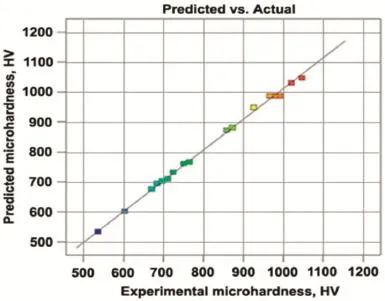
Fig.7.Correlation plot for the response.
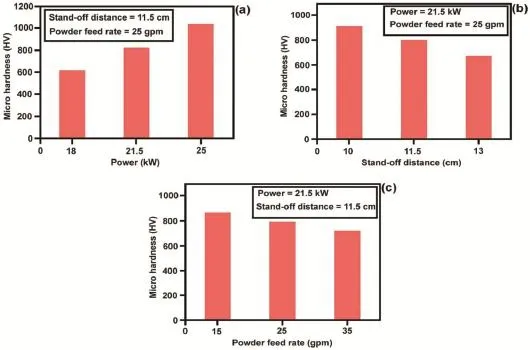
Fig.8.Effect of(a)power,(b)stand-off distance and(c)powder feed rate on micro hardness.
In the plasma spray process,the input power is controlled by variation of arc current.It indicates higher arc current leads to higher input power and conversely.The variation of response with input power levels are displayed in Fig.8a.Lower power levels offered improper melting quality coatings in terms of higher porosity.With low spraying powers,the powder particles are poorly melted.When they impact on the substrate or the already formed coating,they are not able to spread out completely to form splats and therefore,could not conform to the surface[28].In such a case,the interlamellar pores and cracks will be formed due to the solidifcation of the splats.Moreover, when the spraying power is relatively low,numerous unmelted and partially melted particles existed in the coating.As the arc current increases,the total and the net available energies in the plasma increase.This condition leads to a better in-fight particle molten state and higher velocities.It is well known that during plasma spraying,an electric arc is initiated between the two electrodes using a high frequency discharge and then sustained using power.The arc ionizes the gas,creating highpressure gas plasma containing higher heat content.The resulting increase in gas temperature,which may exceed 30,000°C,in turn increases the volume of the gas.The coatings are formed by spreading of melted droplets.Complete melting of the powders and higher velocity will yield lesser porosity coatings and make the melted droplets spread adequately.The optical micrograph of the coated specimens Fig.9a reveals the at lower power levels,the alumina coated specimen shows extensive cracking of the coating due to the applied indentation load.Increasing the power level which increases the enthalpy in the plasma fame is likely to melt the particles,which in turn increases particle-melting ratio subsequently enhancing good compaction of the coating obtained during the coating buildup. Further,effective fattening and solidifcation of the particles over the deposited layers will lead to reduction in porosity[29] and increasing microhardness values.Porosity decreases under high power levels because the particles are more likely to melt at high plasma energy levels,thereby enhancing fow and compaction of the coating during its build up.If the velocity of the particles is increased and/or the viscosity is decreased,then particle spreading tends to increase.The presence of nonmolten particles will also increase the roughness of the coating and will lower the values of hardness because of low particle cohesion.This also should increase the porosity of the coatings. An increase in porosity will lower the coating stiffness,producing a decrease in the values of hardness.Under very high power levels,gas entrapment upon impact occurs because of the high pressure in the gas layer just prior to impact.During the rapid spreading and quenching of splats,gas escape can be suppressed resulting in escalating gas pressure in the splat center, which can create the thin cap of a gas bubble,leaving behind a residual hole causing an increase in porosity level and the reduction of hardness values[30].In the case of the coating produced under high power levels(Fig.9b),the cracks are very few.During the indentation process,a complex elastic-plastic feld is formed beneath the indentation.When porosity or an equivalent defect is present under the indentation,it creates a multiaxial stress state and causes a local strain concentration in its vicinity.Porosity tends to reduce the effective area supporting the load and is detrimental to the strength of the coating. Pores present in the coating accommodate deformation without resistance and thus decrease the hardness of the coating.Splat separation together with multiple cracks were consistently found throughout the coating deposited under the lower power levels(Fig.9a).This can be seen in the spreading of the indent as the splats separate.Splat separation and multiple cracks also suggest that weak bonds are formed at the splat interfaces. These weak bonds allow the splats to separate easily under the shear stresses imposed by the indenter[31].The low level of splat interaction is most likely caused by low particle velocities and lower particle temperatures.Splat separation is still visible in the coating sprayed under higher power level(Fig.9b),but only pore separated splats are affected.Both the experimental and the predicted results agree in describing these effects.
4.2.Effect of stand-off distance on microhardness
The effects of stand-off distance on microhardness of the coatings are displayed in Fig.8b.According to the fgure,it is seen that the hardness has an inversely proportional relationship with the stand-off distance.The stand-off distance mainly controls the cohesion between splats because the temperature and velocity of particles in the plasma fame signifcantly change with stand-off distance.Therefore,better spreading and cohesion would be achieved with shorter spraying distances.At smaller stand-off distance,possibilities of splashing of molten particles and quench cracks end up with increased level of porosity[32].Stand-off distance is of substantial importance because adequate distance must be provided for heating and accelerating the powder,but too great a distance will allow the powder to cool and lose velocity,because the gas stream is rapidly expanding,cooling,and slowing will end up withmolten droplets land on substrate without enough kinetic energy to form splats.These droplets can stay on the substrate by themselves[33]and act as a stress concentrator which resulted in crack propagation in multiple directions.Lowering spray distance frstly increases deposition rate but problems appear by strongly increasing heat load.Coatings are dense but large cracks form in the coating due to internal stresses that arise during the deposition process.The optical micrograph of the coating exposure is shown in Fig.9c,where very few microcracks of the coating can be observed.
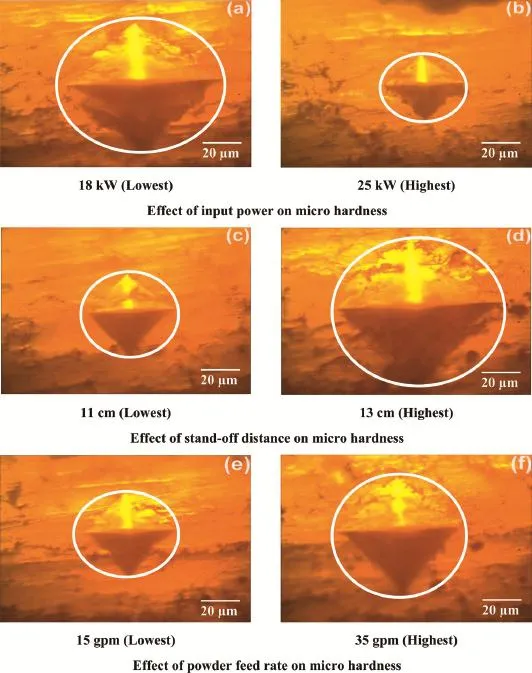
Fig.9.Effect of APS process parameters on micro hardness.
On the other hand,by increasing the spray distance coating compact is reduced and hardness signifcantly reduces due to a reduced particle temperature and a lower particle impact.Also by lowering the average impact temperatures of the droplets with the substrate surface,the lower kinetic energy and particle temperatures reduce the plastic deformation of the particles leading to a substantial decrease microhardness value[34].As explained,increase in stand-off distance causes prevention of splashing of material with possible fragmentation and quenching cracks.This condition reduces the porosity and has positive effect on hardness.With longer stand-off distance,the enthalpy of the molten ceramic particles is largely lost,and the particles are decelerated in a relatively longer fight path because of the interaction with the surrounding air.Under such conditions,the particles striking on the substrate will not be adequately fattened to overlap the layers,resulting in higher porosity and reduces the hardness values.It is clear from Fig.9d,cracks were observed on the surface of the material.
4.3.Effect of powder feed rate on microhardness
Fig.8c indicates the effect of powder feed rate on the response of the coatings.From the fgure,it can be inferred that the hardness decreased with the increase in powder feed rate.In plasma spray processing,the powder feed rate refers to a per-centage or number of particles which share the kinematic and thermal energies in the fame.The numbers of particles in the fame are infuential on particle velocity and their temperature. Too low a powder feed rate will result in vaporization,and over melting of the particles resulting in cracks(decreases hardness) [35],splashing,and high porosity levels,whereas too high a feed rate will end up in poor melting of the powder particles resulting in a decrease of the splat fattening ratio and an increase in the porosity[36].Inspection of the coating morphology produced under lower powder feed rate reveals the presence of micro cracks(Fig.9e).This suggests that a good contact between the oxide scales of different splats might have been caused by particle velocities and temperatures.
Increase in powder feed rate will lead to better vaporization andimprovethedepositioneffciency.Italsopreventsformation of quench cracks and splashing of molten particles.Hence,this phenomenon increases the hardness values.On the other hand, when the powder feed rate goes beyond 25 gpm,increase in the number of powder particles may lead to deviation of them from injection axis.Hence,it leads to a change in the powder inlet condition and increases particle collisions that change the trajectories of the colliding particles.Large or small number of particleswillalsofoatontopofthefameorpenetrateittoreach thelowerpart.Theseparticles,notattainingtosuffcientvelocity and temperature,however,either reach the coating or stick to it. Undersuchcondition,theporosityofsurfaceincreasesandleads tolowhardness[37].Butbyfurtherincreaseinpowderfeedrate, thekineticandthermalenergiesinthefameincreaseandleadto increaseintemperatureandvelocityofparticles.Italsoprevents formation of quench cracks and splashing of molten particles [38].Hence,the porosity decreases at high powder feed rate and hardness increases,subsequently.When the powder feed rate was increased to 35,the alumina coated specimen exhibited a higheramountofcracksobservedthanthoseinthelowerpowder feed rate(Fig.9f).
4.4.Relationship between porosity and microhardness of alumina coatings
The coating porosity and the microhardness obtained from the experimental results are related as shown in Fig.10.The experimental data points are ftted by a straight line.The straight line is governed by the following regression equation:
The slope of the estimated regression equation(−47.047)is negative,implying that as porosity decreases,microhardness increases.The coeffcient of determination is R2=94.6%.It can be interpreted as the percentage of the total sum of squares that can be explained by using the estimated regression equation. The coeffcient of determination R2is a measure of the goodness of ft of the estimated regression equation[39].
The ftted regression line(Eqn.3)may be used for two purposes:
(a)To estimate the mean value of microhardness for the given value of coating porosity.
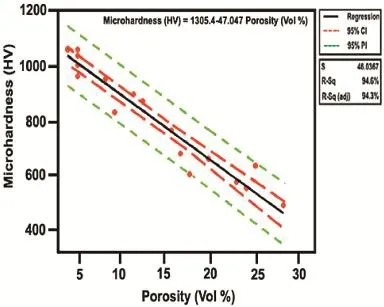
Fig.10.Relationship graph for porosity and micro hardness.
(b)Predicting an individual value of microhardness for a given value of coating porosity level.
The confdence interval and prediction interval show the precision of the regression results.Narrower intervals provide a higher degree of precision(Fig.10).Confdence interval(CI)is an interval estimate of the mean value of y for a given value of x.Prediction interval(PI)is an interval estimate of an individual value of y for a given value of x.The estimated regression equation provides a point estimate of the mean value of microhardness for a given value of porosity.The difference between CI and PI refects the fact that it is possible to estimate the mean value of microhardness more precisely than an individual value of microhardness.The greater width of the PI is refecting the added variability introduced by predicting a value of the random variable as opposed to estimating a mean value. From Fig.10,it is also inferred that the closer the value to“X”(15.21vol%)the narrower will be the interval.
5.Conclusions
The following important conclusions are obtained from this investigation
•Empirical relationship was established using RSM to predict the micro hardness of plasma sprayed alumina coatings, incorporating APS spray operational parameters.The developed relationship can be effectively used to predict the micro hardness of alumina coatings onAZ31B magnesium alloy at 95%confdence level.
•The input power was found to have greater infuence on the micro hardness of plasma sprayed alumina coatings followed by process parameters such as stand-off distance and powder feed rate.
•A regression equation has been developed incorporating coating porosity and microhardness of the coating.This equation can be effectively used to predict microhardness of alumina coating,if coating porosity is known.
[1]G.L.Song,J.Adv.Eng.Mater.7(2005)563.
[2]D.Thirumalaikumarasamy,K.Shanmugam,V.Balasubramanian,Trans. Indian Inst.Met.67(2014)19.
[3]J.E.Gray-Munro,B.Luan,L.Huntington,Appl.Surf.Sci.254(2008) 2871.
[4]W.A.Ferrando,J.Mater.Eng.11(1989)299.
[5]X.Wang,L.Zhu,X.He,F.Sun,Appl.Surf.Sci.280(2013)467.
[6]R.Arrabal,J.M.Mota,A.Criado,A.Pardo,M.Mohedano,E.Matykina, Surf.Coat.Technol.206(2012)4692–4703.
[7]F.Liu,D.Shan,Y.Song,E.Han,Trans.Nonferr.Met.Soc.China 21 (2011)943–948.
[8]M.-H.Lee,Y.-W.Kim,K.-M.Lim,S.-H.Lee,K.-M.Moon,Trans. Nonferr.Met.Soc.China 23(2013)876.
[9]Y.Ge,W.Wang,X.Wang,Z.Cui,B.Xu,Appl.Surf.Sci.273(2013)122.
[10]K.Huang,L.Yan,C.Wang,C.Xie,C.Zhou,Trans.Nonferr.Met.Soc. China 20(2010)1351.
[11]R.Suryanarayanan,Plasma Spraying:Theory and Applications,World Scientifc Publishing,New York,1993.
[12]S.T.Aruna,N.Balaji,J.Shedthi,V.K.William Grips,Surf.Coat.Technol. 208(2012)92.
[13]T.Lampke,D.Meyer,G.Alisch,D.Nickel,I.Scharf,L.Wagner,et al., Surf.Coat.Technol.206(2011)2012.
[14]H.Wang,J.Ma,G.Li,J.Kang,B.Xu,Appl.Surf.Sci.314(2014)468.
[15]D.Schwingel,R.Taylor,T.Haubold,J.Wigren,C.Gualco,Surf.Coat. Technol.10(1998)108.
[16]R.Venkataraman,G.Dasa,S.R.Singh,L.C.Pathak,R.N.Ghosha,B. Venkataraman,et al.,Mater.Sci.Eng.A 445(2007)269.
[17]M.Prystay,P.Gougeon,C.Moreau,J.Therm.Spray Technol.10(2001) 67.
[18]H.Ruiz-Luna,D.Lozano-Mandujano,J.M.Alvarado-Orozco,A. Valarezo,C.A.Poblano-Salas,L.G.Trapaga-Martinez,et al.,J.Therm. Spray Technol.23(2014)950.
[19]P.Saravanan,V.Selvarajan,M.P.Srivastava,D.S.Rao,S.V.Joshi,G. Sundararajan,J.Therm.Spray Technol.9(1999)505.
[20]Y.Yang,D.Yan,Y.Dong,X.Chen,L.Wang,Z.Chu,et al.,J.Therm. Spray Technol 22(2013)1002.
[21]G.Jandin,H.Liao,Z.Q.Feng,C.Coddet,Mater.Sci.Eng.A.349(2003) 298.
[22]D.Thirumalaikumarasamy,K.Shanmugam,V.Balasubramanian,J. Magnesium and Alloys 2(2014)140.
[23]J.F.Li,H.Liao,B.Normand,C.Cordier,G.Maurin,J.Foct,et al.,Surf. Coat.Technol.176(2003)1.
[24]S.Kuroda,T.W.Clyne,Thin Solid Films 200(1991)49.
[25]Book of Standards Volume:02.05,ASTM B 276-05,Standard Test Method for Apparent Porosity in Cemented Carbides,American Society for Testing and Materials,Pennsylvania,2010.
[26]C.S.Ramachandrana,V.Balasubramaniana,P.V.Ananthapadmanabhan, Ceram.Int.39(2013)649.
[27]S.Kumar,P.Kumar,H.S.Shan,J.Mat.Proc.Technol.182(2007) 615.
[28]G.Montavon,C.C.Berndt,C.Coddet,S.Sampath,H.Herman,J.Therm. Spray Technol.6(1997)153.
[29]A.H.Pakseresht,A.H.Javadi,M.Nejati,K.Shirvanimoghaddam,E. Ghasali,R.Teimouri,Int.J.Adv.Manuf.Technol.75(2014)739.
[30]S.Das,P.P.Bandyopadhyay,S.Ghosh,T.K.Bandyopadhyay,A.B. Chattopadhyay,Metall.Mater.Trans.A 34(2003)1919.
[31]R.Dal Maschio,V.M.Sglavo,L.Mattivi,L.Bertarnini,S.Sturlese,J. Therm.Spray Technol.3(1994)51.
[32]A.Kucuk,C.C.Berndt,U.Senturk,R.S.Lima,C.R.C.Lima,Mater.Sci. Eng.A 284(2000)29.
[33]S.Guessasma,Z.Salhi,G.Montavon,P.Gougeon,C.Coddet,Mater.Sci. Eng.B 110(2004)285.
[34]C.S.Ramachandran,V.Balasubramanian,P.V.Ananthapadmanabhan, Surf.Eng.27(2011)217.
[35]P.Fauchais,J.Phys.D Appl.Phys.37(2004)86.
[36]R.L.Williamson,J.R.Fincke,C.H.Chang,Plasma Chem.Plasma Process.20(2000)299.
[37]M.Vardelle,A.Vardelle,P.Fauchais,K.I.Li,B.Dussoubs,N.J.Themelis, J.Therm.Spray Technol.10(2001)267.
[38]N.H.N.Yussof,M.J.Ghazali,M.C.Isa,A.R.Daud,A.Muchtar,S.M. Forghani,Mater.Des.39(2012)504–508.
[39]S.Karthikeyan,V.Balasubramanian,R.Rajendran,Ceram.Int.40(2014) 3171.
Received 30 March 2015;revised 24 June 2015;accepted 30 June 2015 Available online 1 October 2015
*Corresponding author.DepartmentofManufacturing Engineering, Annamalai University,Annamalainagar,Chidambaram,Tamil Nadu 608 002, India.Tel.:+91 09894319865;fax:+91 4144 238080/238275.
E-mail addresses:tkumarasamy412@gmail.com,thirumalaikumarasamy.d .12750@annamalaiuniversity.ac.in(D.Thirumalaikumarasamy).
http://dx.doi.org/10.1016/j.jma.2015.06.002
2213-9567/©2015 Production and hosting by Elsevier B.V.on behalf of Chongqing University.
©2015 Production and hosting by Elsevier B.V.on behalf of Chongqing University.
 Journal of Magnesium and Alloys2015年3期
- Journal of Magnesium and Alloys的其它文章
- GUIDE FOR AUTHORS
- Infuence of sulfate ion concentration and pH on the corrosion of Mg-Al-Zn-Mn(GA9)magnesium alloy
- Research of growth mechanism of ceramic coatings fabricated by micro-arc oxidation on magnesium alloys at high current mode
- Infuence of solution treatment on microstructure,mechanical and corrosion properties of Mg-4Zn alloy
- Electrochemical deposition of Mg(OH)2/GO composite flms for corrosion protection of magnesium alloys
- Effect of temperature and strain rate on compressive response of extruded magnesium nano-composite