农业景观动态对林地地表节肢动物多样性的影响
侯笑云,宋 博,赵 爽,丁圣彦, 2, *,梁国付,董翠芳
1 河南大学环境与规划学院,开封 475004 2 河南大学生态科学与技术研究所,开封 475004
农业景观动态对林地地表节肢动物多样性的影响
侯笑云1,宋 博1,赵 爽1,丁圣彦1, 2, *,梁国付1,董翠芳1
1 河南大学环境与规划学院,开封 475004 2 河南大学生态科学与技术研究所,开封 475004
以黄河下游典型农区封丘县为研究区,在林地景观中进行地表节肢动物的观测。用物种丰富度和香农多样性指数代表物种多样性,选择代表景观背景的5个竞争模型:生境特性(H1, 2012)、基质特性(H2, 2012)、生境变化(H3, 1984—2012)、基质变化(H4, 1984—2012)和土壤-环境条件(H5, 2012)从4个空间尺度上(100, 250, 350和500m)进行分析,通过运用基于赤池信息量准则(Akaike information criterion, AIC)的多模型推理(Multi-model Inference, MMI)方法,在R软件里用广义线性模型(Generalized Linear Models, GLM)探究了研究区近30年(1984—2012年)景观背景变化对林地地表节肢动物多样性的影响。研究表明,不同景观背景模型对地表节肢动物多样性的影响具有尺度依赖性。在100m的尺度下,生境特性(H1)最能够解释香农多样性和物种丰富度,但是随着尺度的增加,生境特性变化(H3)在较大(250、350m和500m)的尺度对物种丰富度和香农多样性影响最大,而基质特性和土壤-环境条件(H2和H5)的作用不显著。景观背景对地表节肢动物多样性的解释量达到40%。在研究区域,生境特性是表征香农多样性指数和物种丰富度的指标。
多模型推理;赤池信息量准则;地表节肢动物;生物多样性;林地;农业景观
生物多样性是制约生态系统服务发挥的关键因素之一[1-3]。农业景观生态系统的持续发展离不开生物多样性早已成为共识[4-5],相当多非农物种的生存离不开农业景观所提供的食物和栖息地[6]。农业景观中的自然、半自然生境(如农田边界、林地、树篱、小溪等)对于栖息于该生境内的动物有很重要的影响。景观异质性对生物多样性的影响引起了国内外学者广泛关注,研究尺度从生境间、田块间一直扩展到区域,甚至跨国界的不同尺度上的比较研究[7-9]。地表节肢动物是农业景观生态系统中食物网的重要组成部分,相关研究多集中在农田[10-19]、草地[20-22]、森林[23-27]等不同生态系统类型的地表节肢动物,发现景观异质性对地表节肢动物的影响存在尺度效应,而且不同景观类型对地表节肢动物群落的影响也不同[10,28-31]。黄河下游地区是我国最重要的粮食主产区之一,对于保障国家粮食安全具有重要的战略地位。封丘县地处黄河下游黄淮海平原典型地区,以农业景观生态系统为主,农业景观异质性与生物多样性的关系研究,对于区域生态系统服务的发挥和生态系统稳定至关重要。近些年来,区内景观异质性、生物多样性和生态系统服务等研究逐渐受到重视[32-33],但是对于地表节肢动物的研究还比较少,特别是开展林地景观异质性和地表节肢动物多尺度关系的研究还很少。本研究以林地地表节肢动物为研究对象,运用多模型推理方法(MMI)[34],以期探究近30年(1984—2012年)景观动态变化对林地中地表节肢动物多样性的影响及其尺度效应,从而为该地区农业景观类型下林地中的生物多样性保护提供理论支持,使生态系统服务更好的发挥。
1 研究区域
封丘县位于河南省东北部,黄河北岸,是黄河下游农业区的典型地区之一(图1)。地处34°53′—35°14′ N,114°14′—114°46′ E之间,该区属暖温带大陆性季风气候,年平均气温在13.5—14.5 ℃之间,年平均降水量615.1 mm,土壤类型以潮土为主。地貌为黄河冲积平原,形态复杂,沙岗、平原、洼地兼有。是全国100个商品粮生产县之一。近年来,随着土地利用强度的加剧,景观类型发生了很大的变化。该区的农田是最主要的景观类型,总面积达81367.9 hm2,约占全县总面积的66.4%;居民点广泛散落在区域内,大小不一,约占总面积的11.6%;林地多呈斑块状散布在农田中和居民点周边,以人工种植的杨树(Populusspp.)林为主,间有极少量的混交林和次生林,总面积约8672.6 hm2[33]。

图1 研究区采样点分布示意图Fig.1 Distribution map of sampling sites in study area
2 数据来源与研究方法
2.1 数据采集与处理
研究数据为1984年(1∶5万)和2012年(1∶5万)封丘县土地利用现状数据。数据的处理和分析主要采用ArcGIS 10.0等软件,景观指数的计算借助于Fragstats4.1等软件。依据研究区实际情况,在野外调查的基础上,将研究区分为:农业用地、林地、道路、城镇用地、农村居民点、工矿用地、河流、湿地、坑塘、滩涂、沟渠和裸地,共12种景观类型。
在研究区选择一个典型样带,在该样带中选取了43片林地样地(图1),每片取样林地选取5个典型样点,相邻样点之间至少间隔10m。研究选取的43片林地中,最大的林地面积为231039.41 m2,最小的林地面积为2870.44 m2,标准差为46363.45 m2。地表节肢动物的调查采用陷阱捕获法。陷阱的具体布设为:将PP塑料杯(口径7.8 cm,底径6 cm,深17.5 cm,容积500mL)埋入土壤中,杯口与地表齐平,在杯中放置150—200mL 20%浓度乙二醇和1滴洗涤剂。取样时间为2013年5月16日至22日,在野外布设6 d后收回,立即将各陷阱中捕获到的物种按对应样点编号放入含75%酒精的10mL带盖离心管中保存,并尽快在实验室进行鉴定分类,物种的具体分类主要参照《中国土壤动物检索图鉴》、《昆虫分类》等分类系统[35-36]。在对地表节肢动物取样的同时,采集土壤分析样品。在每个样地内,按照蛇形采样法随机布设10个左右的采样点,每个样点采集100g左右的表层土壤样品(厚20cm),然后将其充分混合,按“四分法”舍弃多余土样,保留1 kg左右的分析样品。取回的土壤样品先带回实验室进行风干,挑出植物残体和砖瓦块,用研钵磨碎,全部通过孔径1 mm的土壤筛后备用。同时在每个样地对植被进行群落调查。
表1 竞争模型的相关解释变量
Table 1 Model set with the competing models under related predictors

模型景观因子解释变量时间特征ModelLandscapefactorsPredictorsTemporalcharacteristicsH1生境特性林地面积静态欧式最近邻近距离H2基质特性农田面积静态辛普森多样性指数H3生境变化林地面积变化动态H4基质变化欧式最近邻近距离变化动态辛普森多样性指数 连接度变化H5土壤-环境因子全氮含量静态有机质pH值 活性碳 香农多样性指数 植被覆盖度 路距
2.2 数据分析方法
2.2.1 多模型推理方法
研究采用多个假定的模型来代表生物的状态和进程,基于赤池信息量准则(AIC)的多模型推理(MMI)方法,对模型中每一个相关数据的强度进行评价[34]。MMI方法允许用户比较和排列多个竞争模型,定义最接近真实生态过程的模型,同时可以对所选模型进行定量分析[37-38]。MMI需要先定义一个多重假定竞争模型[34,38-39],假定竞争模型选取以下五个景观特性:生境特征(H1)、基质特性(H2)、生境变化(H3)、基质变化(H4)和土壤-环境条件(H5),每个景观特性均通过相对应的解释变量来代表一个特定的竞争模型(表1)。
2.2.2 解释变量
本文采用五个竞争模型相关的15个解释变量来分析与地表节肢动物的关系(表1)。根据地表节肢动物的生活习性,以每片林地采样点为中心,分别设置100、250、350m和500m等4个不同半径的缓冲区,从中提取出所需的景观指数。
其中,欧式最近邻近距离变异系数(Euclidean Nearest Neighbor Distance-Coefficient of Variation, ENN_CV)表征林地斑块之间平均最近相邻距离的变量系数,较大的变量系数指示林地斑块呈不规律和不均匀的分布。Simpson′s多样性指数(Simpson′s Diversity Index, SIDI)是用来表征景观多样性的指数,它的取值范围在0—1之间,越接近1表明研究区的景观多样性越高。
用1984年和2012年间景观指数的变化来计算生境变化和基质特性变化中的解释变量。其中,ENN_CV变化测定从1984到2012年间斑块分布的变化,这可能影响基质的特性。它代表了在景观水平上(包括所有土地覆盖类型)ENN_CV指数(ENN_CV2012—ENN_CV1984)的不同。若为负值指示后期景观中的斑块(土地覆盖类型)是低异质的或者不均衡的分布。路距是取样点和当地主干道之间的距离,距离的远近一定程度上代表了人类干扰的强弱。从取样点周围获得的土壤主要因子包括:全氮含量、有机质含量、pH值和活性碳(AOC)含量。用样点附近植物的Shannon′s多样性指数(SHDI)和覆盖度来代表植物的多样性。
2.2.3 响应变量
选取地表节肢动物群落物种丰富度和Shannon′s多样性指数作为响应变量。
物种丰富度指数
S=(R-1)/lnN
(1)
式中,R为群落的物种数目,N为群落所有物种个体数之和。
Shannon′s多样性指数:
(2)
式中,S为样方内物种数目,Pi为属于种i的个体在全部个体中的比例。
2.2.4 统计分析
本文对每个竞争模型中所有的解释变量分别进行了标准化,并用多元线性对解释变量之间进行Pearson相关性检验,每列变量的相关性检验结果都小于0.5。通过广义线性模型(GLM)来分析解释变量和响应变量之间的关系。物种丰富度采用Poisson误差分布和一个对数连接函数来对解释变量和响应变量的关系进行估算。对于香农多样性指数选用Gaussian误差分布和恒等连接函数来对解释变量和响应变量的关系进行估算。然后基于已定义的模型集合(表1),在每个空间尺度(100、250、350m和500m)用线性指示变量(没有考虑转换或者相互作用)来完成模型拟合。由于样本量较少,故使用修正后的AIC,即AICc来比较和排列模型。以上操作是在R统计软件中进行的[40]。
3 结果与分析
3.1 林地中地表节肢动物多样性分布格局
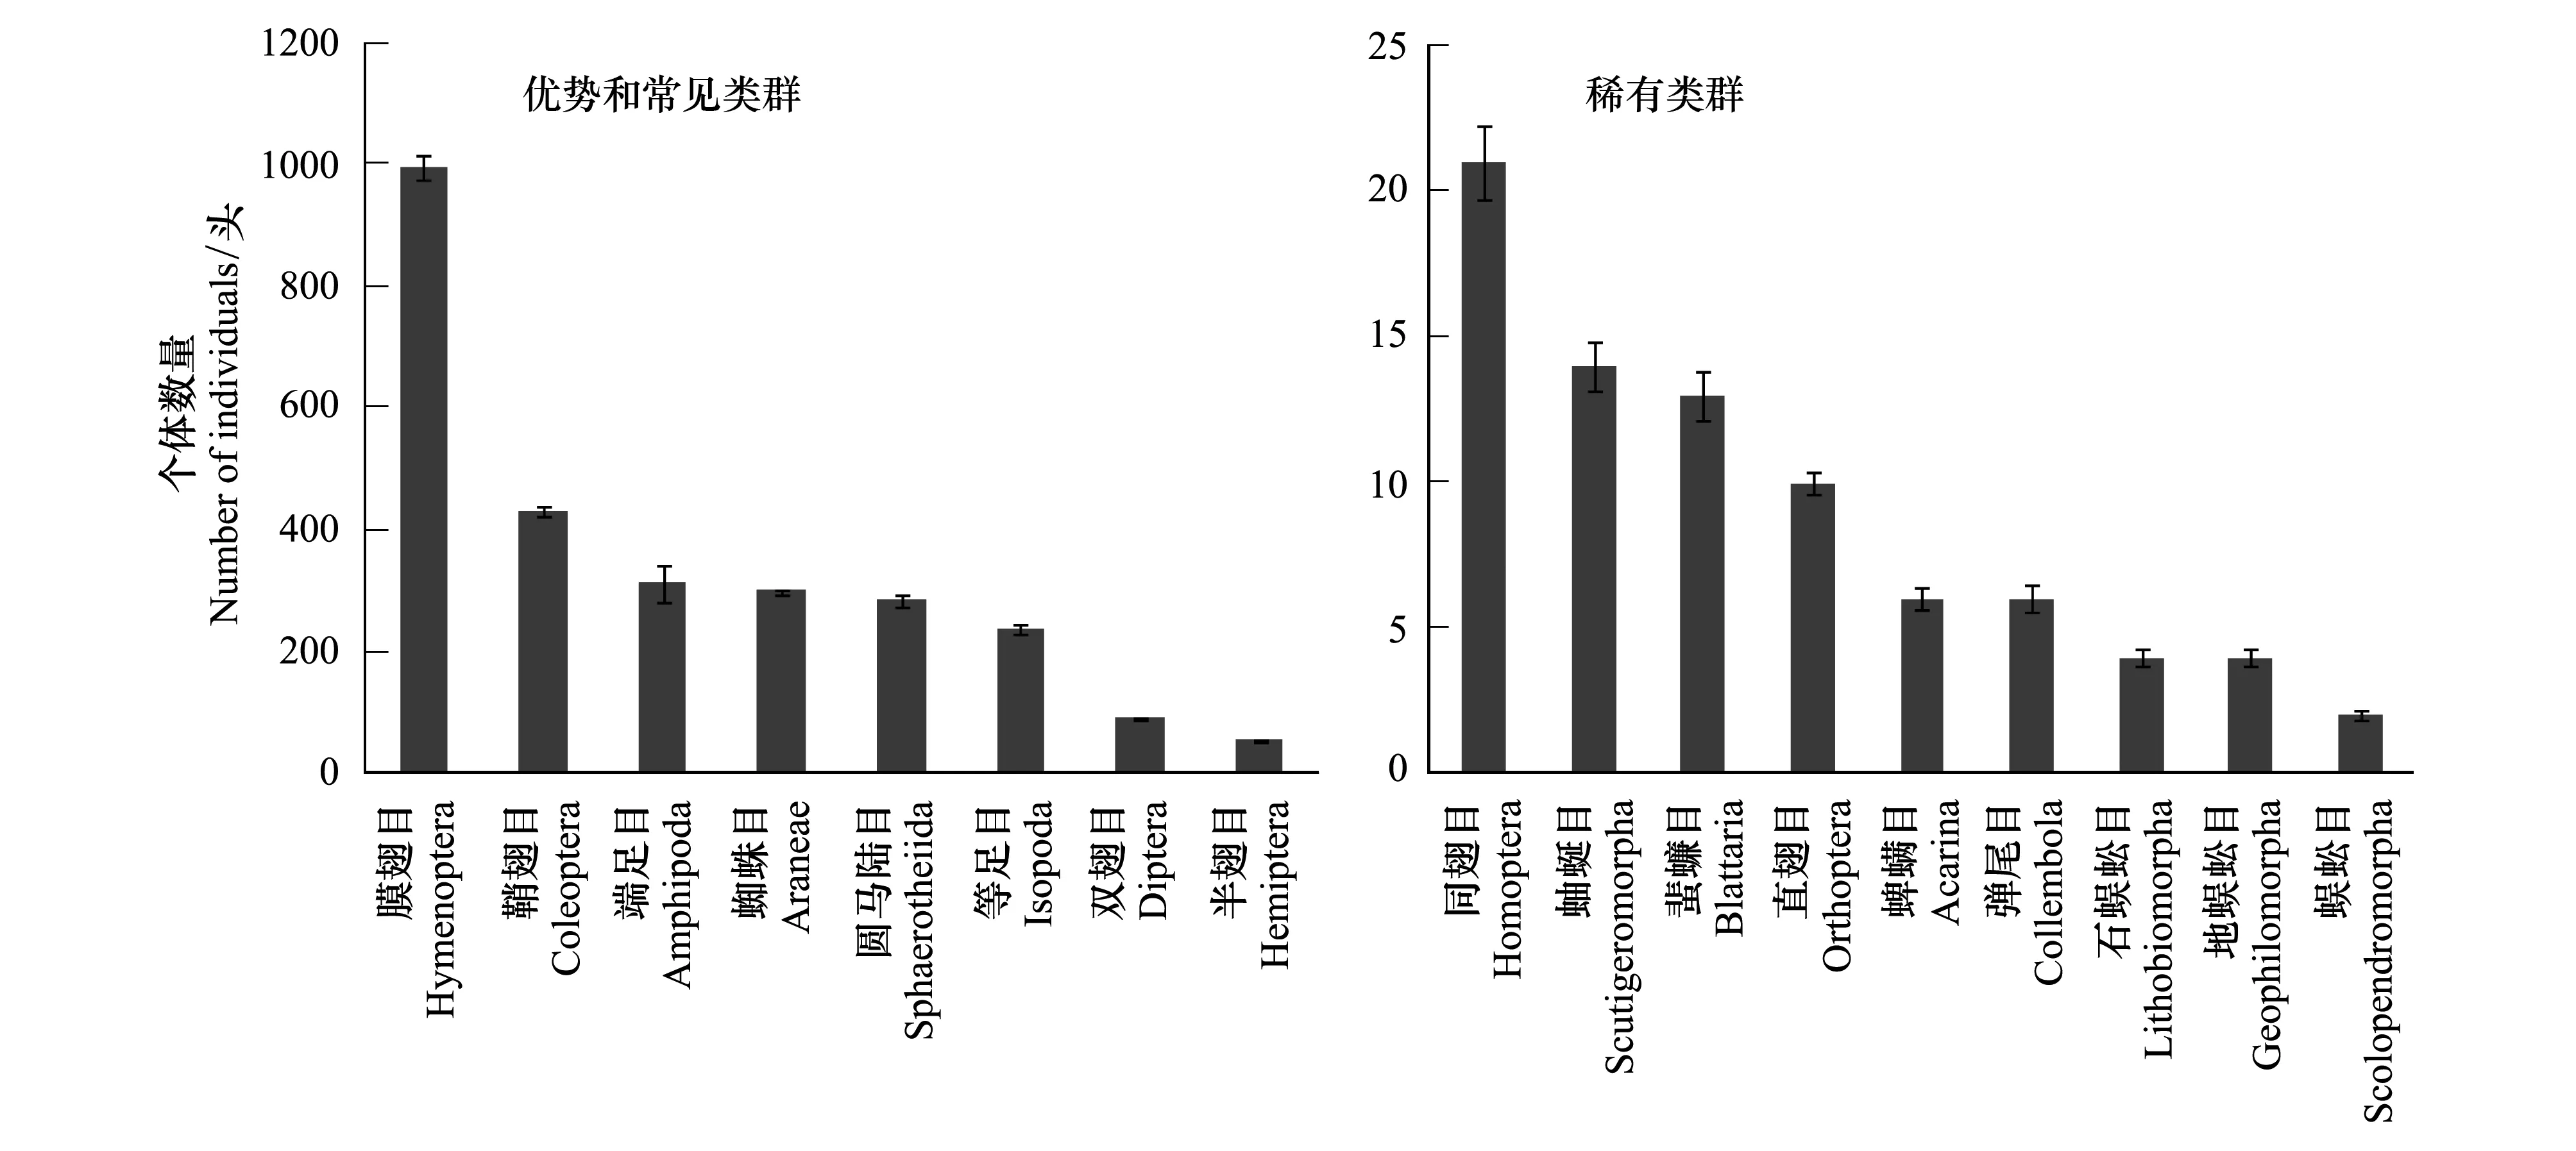
通过调查,研究区地表节肢动物共包括17个目、58个科,个体数量为2776头(图2)。膜翅目(Hymenoptera)、鞘翅目(Coleoptera)、端足目(Amphipoda)、蜘蛛目(Araneae)、圆马陆目(Sphaerotheiida)、等足目(Isopoda)、双翅目(Diptera)和半翅目(Hemiptera)的个体数量较多,分别占捕获的地表节肢动物总体个数的36%、16%、11%、10%、10%、8%、3%和2%,为研究区的优势和常见类群。同翅目(Homoptera)、蚰蜒目(Scutigeromorpha)、蜚蠊目(Blattaria)、直翅目(Orthoptera)、蜱螨目(Acarina)、弹尾目(Collembola)、石蜈蚣目(Lithobiomorpha)、地蜈蚣目(Geophilomorpha)和蜈蚣目(Scolopendromorpha)的个体数量均小于总体个数的1%,为该地区的稀有类群。图2显示了研究区林地景观中的优势和常见类群的多度和研究区林地景观中的稀有类群(多度小于总数1%的类群)的多度。物种丰富度和香农多样性指数呈显著的正相关(r= 0.51,P< 0.001)。

图2 地表节肢动物多度Fig.2 Abundance of ground arthropod
3.2 1984年到2012年间景观格局的变化
生境和基质特性从1984年到2012年发生了很大的变化(图3)。样点周围林地面积大幅度增加。研究表明,近30年间该区ENN_CV值的增加,代表了采样点附近的斑块异质性程度提高。在100m尺度上,1984年的ENN_CV值大部分都为0,因为在1984年采样点周围100m的范围内主要是大面积的农田景观,而2012年的ENN_CV值则普遍在30—50之间,说明研究区斑块的异质性显著提高。在100m范围内SIDI值呈现显著增加,原因是样点附近的景观在人类干扰下,大面积的农田转化为林地或者其他景观类型,其中林地面积大幅度增加。连接度(CONNECT)变化在100m尺度上的平均值在50左右,说明在该尺度斑块之间的连接度发生了很大的变化。而且随着尺度的增加,CONNECT变化的平均值逐渐减少。说明在较小的尺度范围内连接度受到的波动较大,随着尺度范围的增加,在较大的尺度范围内连接度受到的波动则较小。

图3 每个竞争模型在4个空间尺度相对应的解释变量Fig.3 The predictors associated to each competing models at four spatial extents模型:生境特性(H1, 2012);基质特性(H2, 2012);生境变化(H3, 1984—2012);基质变化(H4, 1984—2012)和土壤-环境条件(H5, 2012);尺度范围:100, 250, 350和500m Models:Habitat quality (H1, 2012); matrix quality (H2, 2012); habitat quality change (H3, 1984—2012); matrix quality change (H4, 1984—2012); soil-environmental conditions (H5, 2012); Spatial extents:100, 250, 350和500m
3.3 景观背景变化对林地地表节肢动物的影响
3.3.1 最优模型中景观背景对香农多样性指数和物种丰富度的影响
香农多样性指数和物种丰富度对景观背景的响应基本一致。生境特性(H1)是最能解释香农多样性和物种丰富度的,但是生境特性变化(H3)的影响也很明显。土壤-环境条件和基质特性(H5和H2)对地表节肢动物的解释量很小。
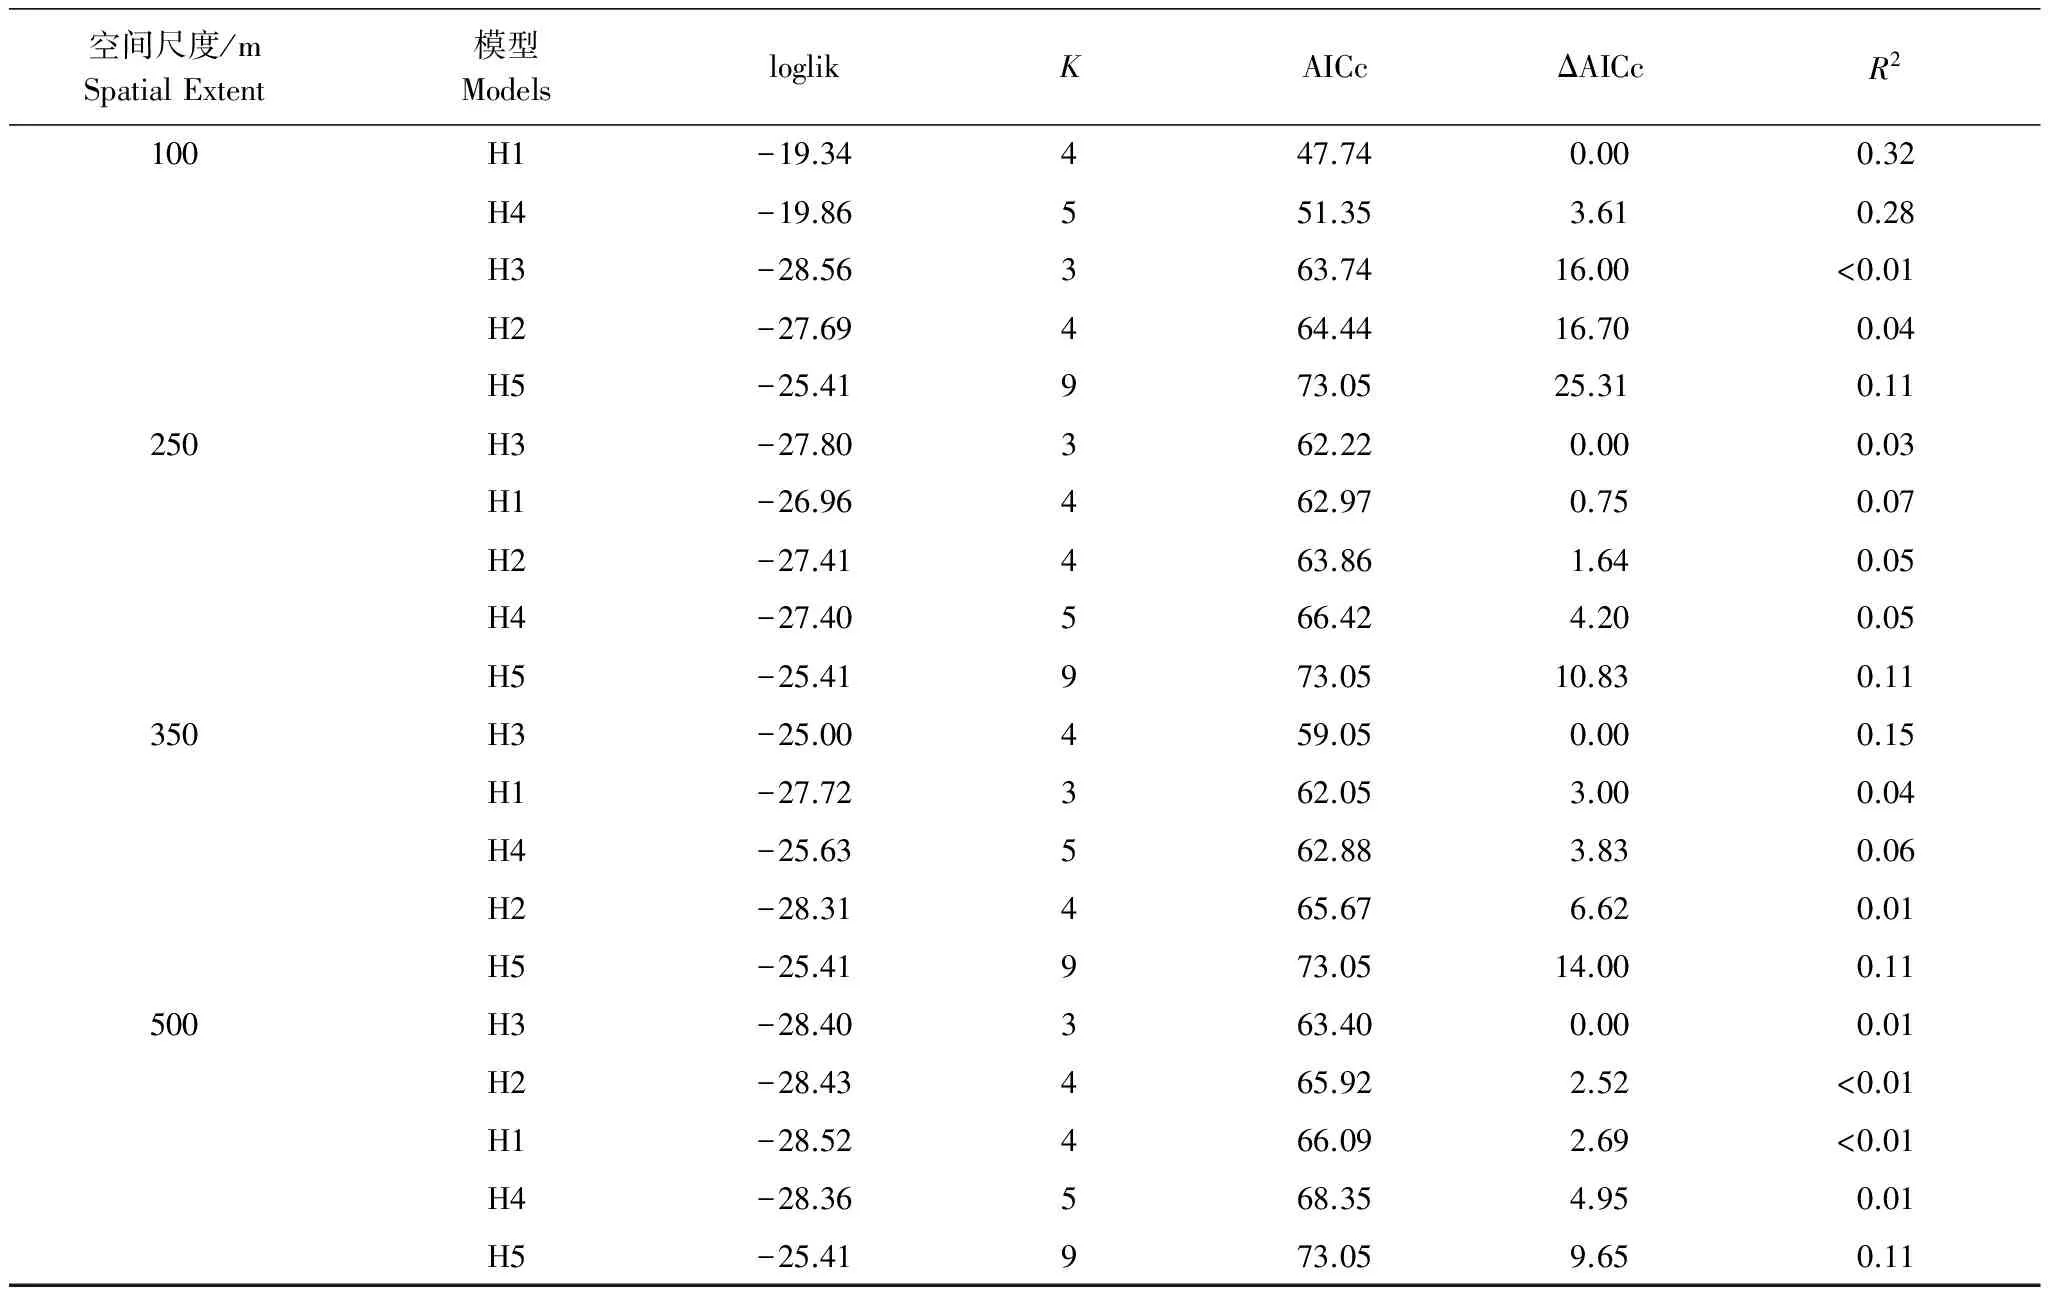
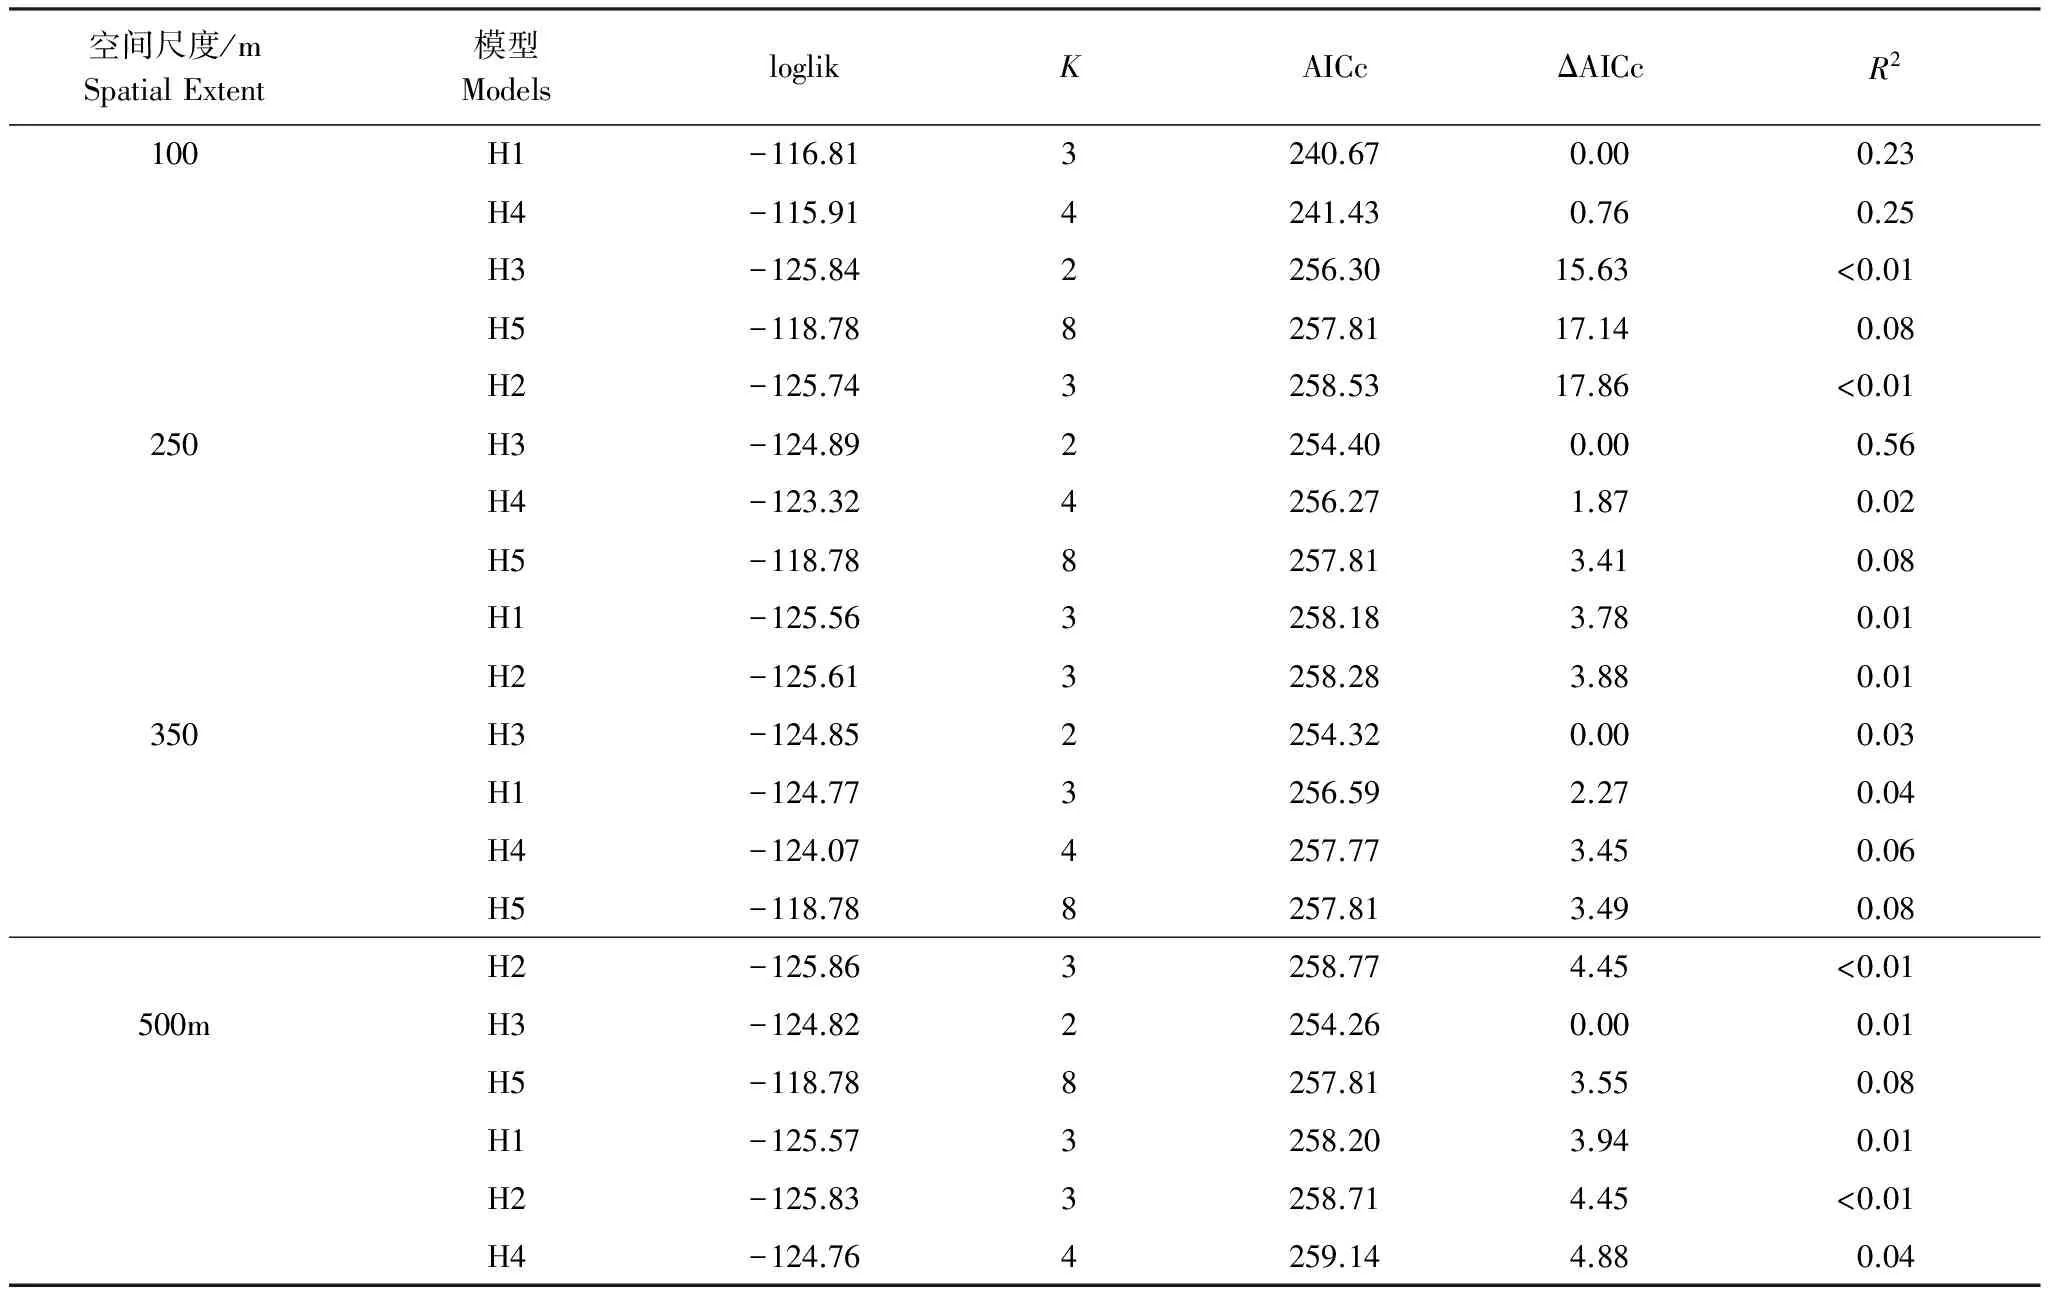
AICc模型选择的结果显示,在100m的空间尺度上,生境特性模型是解释香农多样性指数的最优模型(表2和表3中加粗显示的模型即为在每个空间尺度上的最优模型)(H1,AICc = 47.74,ΔAICc=0,R2= 0.32)(表2)。在该尺度上,能够解释物种丰富度的最优模型同样是生境特性模型(H1)(H1,AICc = 240.67,Δ AICc = 0,R2= 0.23)(表3)。
表2 在不同尺度用信息理论模型选择和多模型推理解释香农多样性指数的结果
Table 2 Results of information theoretic model selection and multi-model inference explaining Shannon diversity index at different spatial extents

空间尺度/mSpatialExtent模型ModelsloglikKAICcΔAICcR2100H1-19.34447.740.000.32H4-19.86551.353.610.28H3-28.56363.7416.00<0.01H2-27.69464.4416.700.04H5-25.41973.0525.310.11250H3-27.80362.220.000.03H1-26.96462.970.750.07H2-27.41463.861.640.05H4-27.40566.424.200.05H5-25.41973.0510.830.11350H3-25.00459.050.000.15H1-27.72362.053.000.04H4-25.63562.883.830.06H2-28.31465.676.620.01H5-25.41973.0514.000.11500H3-28.40363.400.000.01H2-28.43465.922.52<0.01H1-28.52466.092.69<0.01H4-28.36568.354.950.01H5-25.41973.059.650.11
Loglik:对数似然函数值(log-likelihood),K:变量个数,AICc:赤池信息量准则值Akaike Information Criterion value,ΔAICc:每个模型的AICc值与该尺度最优AICc值之差,R2:调整后的拟合程度; 表中加粗显示的模型即为在每个空间尺度上的最优模型

表3 在不同尺度用信息理论模型选择和多模型推理解释物种丰富度的结果Table 3 Results of information theoretic model selection and multi-model inference explaining species richness at different spatial extents
3.3.2 景观背景对物种丰富度和Shannon′s多样性影响的尺度效应
物种丰富度和Shannon′s多样性对景观背景的响应均具有强烈的尺度依赖性。AICc值显示了在100m的空间尺度生境特性(H1)对Shannon′s多样性指数和物种丰富度的影响均是最显著的(表2)。在该尺度基质变化(H4)的影响也是很明显的。但是随着尺度的增加,在250m(H3,AICc = 254.40,ΔAICc = 0)、350m(H3,AICc = 254.32,ΔAICc = 0)和500m(H3,AICc = 254.26,ΔAICc = 0)的尺度范围内均是生境变化(H3)对物种丰富度的影响最明显。同样的,随着尺度的增加,在250m(H3,AICc = 62.22,ΔAICc = 0)、350m(H3,AICc = 59.05,ΔAICc = 0)和500m(H3,AICc = 63.40,ΔAICc = 0)的尺度范围内也均是生境变化(H3)对Shannon′s多样性的影响最明显。
景观背景对物种丰富度和Shannon′s多样性指数的影响具有很强的尺度依赖性,在100m的尺度范围内地表节肢动物的物种丰富度和Shannon′s多样性指数受景观背景的影响最大,在较大的尺度(250、350m和500m)物种丰富度和Shannon′s多样性指数受生境变化(H3)的影响最明显。
4 结论与讨论
研究表明,在100m尺度范围,生境特性(H1)对林地地表节肢动物的物种丰富度和Shannon′s多样性指数的影响最大,主要原因是生境特性包括林地面积和ENN_CV值,研究区林地面积的大面积增加和较大的ENN_CV值显示了该区斑块异质性的增加。生境异质性假说认为大的岛屿或斑块拥有更多的生境斑块因而容纳更多的物种,特别是生境特化种,斑块面积的大小是生境异质性高低的一个表征指标。林地生境的增加和景观多样性的提高对林地中地表节肢动物的影响最大。基质变化(H4)对地表节肢动物多样性的影响只在100m的尺度上比较明显,在其他尺度上则是相对薄弱的。
景观背景对于林地中地表节肢动物的多样性有重要的影响,同时也说明了从时间动态角度出发可能更好的理解景观背景和林地中地表节肢动物之间的相互作用。与传统的零假设测定相比,运用MMI模型来评价生物多样性和景观背景的相互关系比较新颖,该方法在动物多样性方面研究较少,分析时需要认真对待。
(1)景观背景对Shannon′s多样性和物种丰富度的影响存在着明显的尺度效应。Shannon′s多样性和物种丰富度均在100m的尺度范围内对生境特性(H1)的响应最明显。但随着尺度的增加,生境变化(H3)的重要性明显增加,且在250、350m和500m的范围均是生境变化(H3)对Shannon′s多样性和物种丰富度的影响最明显。这说明在不同尺度景观背景对地表节肢动物多样性的影响是不同的。在不同的尺度上,林地地表节肢动物对不同的景观特性响应不同。在较小尺度(100m)上,林地中地表节肢动物的物种丰富度和Shannon′s多样性对生境特性(H1)响应最明显,说明在小尺度上,地表节肢动物对其栖息地特征非常敏感;但是在较大尺度(250、350m和500m)上,地表节肢动物对生境变化(H3)响应最大,说明在较大尺度上,地表节肢动物对其栖息地的变化响应更加敏感。
(2)地表节肢动物的物种丰富度和Shannon′s多样性对景观背景的响应基本一致,均是生境特性在100m的特征尺度对其有最明显的响应。植物多样性的相关研究[34]显示,地形-环境条件在125 m的尺度对植物物种丰富度响应最大,随着尺度的增加,生境变化的重要性也随之增强。但是基质变化在所有尺度对植物Shannon′s多样性的影响都很明显,在500m的范围内影响达到最高。相比之下,之所以植物的物种丰富度和Shannon′s多样性对景观背景的响应不同,而本研究中地表节肢动物的物种丰富度和Shannon′s多样性对景观背景的响应基本一致,是因为地表节肢动物的物种丰富度和Shannon′s多样性呈显著的正相关。另外,对植物多样性研究的结果显示基质变化在所有尺度对植物的Shannon′s多样性的影响都很明显,在500m的范围内达到最大,但是本研究中生境的特性在100m的尺度范围对林地地表节肢动物的Shannon′s多样性影响最大。这可能是因为对于植物来说,主要是依靠风力或者动物进行种子的传播,其传播范围较大,相比之下,地表节肢动物具有捕食、栖息和繁殖的生活需要,故其活动范围相对较小,主要在其栖息地附近活动,同时其自身的迁移能力也较弱,故在一个较小的尺度上研究相对合适。而且在该尺度上生境的特性对其影响最大。同时,由于本研究选取的特征尺度只局限于500m以内,在这个范围内发现生境特性对林地地表节肢动物的影响最大,没有发现景观指数对其的明显影响,在今后的研究中是否可考虑在更大的尺度上进行分析,来进一步的分析景观指数对地表节肢动物的影响。
在研究区域景观背景对地表节肢动物多样性的解释量达到40%。建议今后的研究中可以进行其他竞争模型的构想,能够更好的解释景观背景对地表节肢动物多样性的影响。
[1] Hooper D U, Chapin III F S, Ewel J J, Hector A, Inchausti P, Lavorel S, Lawton J H, Lodge D M, Loreau M, Naeem S, Schmid B, Setälä H, Symstad A J, Vandermeer J, Wardle D A. Effects of biodiversity on ecosystem functioning:a consensus of current knowledge. Ecological Monographs, 2005, 75(1):3- 35.
[2] Mace G M, Norris K, Fitter A H. Biodiversity and ecosystem services:a multilayered relationship. Trends in Ecology and Evolution, 2012, 27(1):19- 26.
[3] Midgley G F. Biodiversity and ecosystem function. Science, 2012, 335(6065):174- 175.
[4] Altieri M A. The ecological role of biodiversity in agroecosystems. Agriculture, Ecosystems and Environment, 1999, 74(1- 3):19- 31.
[5] Marshall E J P, Brown V K, Boatman N D, Lutman P J W, Squire G R, Ward L K. The role of weeds in supporting biological diversity within crop fields. Weed Research, 2003, 43(2):77- 89.
[6] Tscharntke T, Klein A M, Kruess A, Steffan-Dewenter I, Thies C. Landscape perspectives on agricultural intensification and biodiversity-ecosystem service management. Ecology Letters, 2005, 8(8):857- 874.
[7] Ekroos J, Kuussaari M, Tiainen J, Heliölä J, Seimola T, Helenius J. Correlations in species richness between taxa depend on habitat, scale and landscape context. Ecological Indicators, 2013, 34:528- 535.
[8] Billeter R, Liira J, Bailey D, Bugter R, Arens P, Augenstein I, Aviron S, Baudry J, Bukacek R, Burel F, Cerny M, Blust G D, Cock R D, Diekötter T, Dietz H, Dirksen J, Dormann C, Durka W, Frenzel M, Hamersky R, Hendrickx F, Herzog F, Klotz S, Koolstra B, Lausch A, Coeur D L, Maelfait J P, Opdam P, Roubalova M, Schermann A, Schermann N, Schmidt T, Schweiger O, Smulders M J M, Speelmans M, Simova P, Verboom J, Van Wingerden W K R E, Zobel M, Edwards P J. Indicators for biodiversity in agricultural landscapes:a pan-European study. Journal of Applied Ecology, 2008, 45(1):141- 150.
[9] 高俊峰, 马克明, 冯宗炜. 景观组成、结构和梯度格局对植物多样性的影响. 生态学杂志, 2006, 25(9):1087- 1094.
[10] Flohre A, Fischer C, Aavik T, Bengtsson J, Berendse F, Bommarco R, Ceryngier P, Clement L W, Dennis C, Eggers S, Emmerson M, Geiger F, Guerrero I, Hawro V, Inchausti P, Liira J, Morales M B, Oate J J, Pärt T, Weisser W W, Winqvist C, Thies C, Tscharntke T. Agricultural intensification and biodiversity partitioning in European landscapes comparing plants, carabids, and birds. Ecological Applications, 2011, 21(5):1772- 1781.
[11] Fournier E, Loreau M. Respective roles of recent hedges and forest patch remnants in the maintenance of ground-beetle (Coleoptera:Carabidae) diversity in an agricultural landscape. Landscape Ecology, 2001, 16(1):17- 32.
[12] Aviron S, Burel F, Baudry J, Schermann N. Carabid assemblages in agricultural landscapes:impacts of habitat features, landscape context at different spatial scales and farming intensity. Agriculture, Ecosystems and Environment, 2005, 108(3):205- 217.
[13] Hendrickx F, Maelfait J P, Wingerden W V, Schweiger O, Speelmans M, Aviron S, Augenstein I, Billeter R, Bailey D, Bukacek R, Burel F, Diekötter T, Dirksen J, Herzog F, Liira J, Roubalova M, Vandomme V, Bugter R. How landscape structure, land-use intensity and habitat diversity affect components of total arthropod diversity in agricultural landscapes. Journal of Applied Ecology, 2007, 44(2):340- 351.
[14] Zhu Y Y, Chen H R, Fang J H, Wang Y Y, Li Y, Chen J B, Fan J X, Yang S S, Hu L P, Leung H, Mew T W, Teng P S, Wang Z H, Mundt C C. Genetic diversity and disease control in rice. Nature, 2000, 406(6797):718- 722.
[15] Zhang F, Shen J, Li L, Liu X. An overview of rhizosphere processes related with plant nutrition in major cropping systems in China. Plant and Soil, 2004, 260(1- 2):89- 99.
[16] Li L, Tang C, Rengel Z, Zhang F S. Calcium, magnesium and microelement uptake as affected by phosphorus sources and interspecific root interactions between wheat and chickpea. Plant and Soil, 2004, 261(1- 2):29- 37.
[17] Fahrig L, Baudry J, Brotons L, Burel F G, Crist T O, Fuller R J, Sirami C, Siriwardena G M, Martin J L. Functional landscape heterogeneity and animal biodiversity in agricultural landscapes. Ecology Letters, 2011, 14(2):101- 112.
[18] Gurr G M, Wratten S D, Luna J M. Multi-function agricultural biodiversity:pest management and other benefits. Basic and Applied Ecology, 2003, 4(2):107- 116.
[19] Diekötter T, Wamser S, Wolters V, Birkhofer K. Landscape and management effects on structure and function of soil arthropod communities in winter wheat. Agriculture, Ecosystems and Environment, 2010, 137(1- 2):108- 112.
[20] Louzada J, Lima A P, Matavelli R, Zambaldi L, Barlow J. Community structure of dung beetles in Amazonian savannas:role of fire disturbance, vegetation and landscape structure. Landscape Ecology, 2010, 25(4):631- 641.
[21] Maharning A R, Mils A A S, Adl S M. Soil community changes during secondary succession to naturalized grassland. Applied Soil Ecology, 2009, 41(2):137- 147.
[22] De Deyn G B, Raaijmakers C E, Zoomer H R, Berg M P, de Ruiter P C, Verhoef H A, Bezemer T M, van der Putten W H. Soil invertebrate fauna enhances grassland succession and diversity. Nature, 2003, 422(6933):711- 713.
[23] Heiniger C, Barot S, Ponge J F, Salmon S, Botton-Divet L, Carmignac D, Dubs F. Effect of habitat spatiotemporal structure on collembolan diversity. Pedobiologia, 2014, 57(2):103- 117.
[24] Bird S, Coulson R N, Crossley D A Jr. Impacts of silvicultural practices on soil and litter arthropod diversity in a Texas pine plantation. Forest Ecology and Management, 2000, 131(1- 3):65- 80.
[25] Huhta V. The role of soil fauna in ecosystems:A historical review. Pedobiologia, 2007, 50(6):489- 495.
[26] Lavelle P, Deca⊇ns T, Aubert M, Barot S, Blouin M, Bureau F, Margerie P, Mora P, Rossi J P. Soil invertebrates and ecosystem services. European Journal of Soil Biology, 2006, 42(S1):S3- S15.
[27] Conzúlez G, Seastedt T R. Soil fauna and plant litter decomposition in tropical and subalpine forests. Ecology, 2001, 82(4):955- 964.
[28] 刘云慧, 宇振荣, 刘云. 北京东北旺农田景观步甲群落结构的时空动态比较. 应用生态学报, 2004, 15(1):85- 90.
[29] 常虹, 张旭珠, 段美春, 宇振荣, 刘云慧. 北京密云农业景观步甲群落空间分布格局. 应用生态学报, 2012, 23(6):1545- 1550.
[30] 张旭珠, 常虹, 张鑫, 段美春, 李骁, 宇振荣, 刘云慧. 农业景观步甲多样性时间格局及其与景观结构的关系. 生态学杂志, 2012, 31(12):3127- 3132.
[31] 黎健龙, 唐劲驰, 赵超艺, 唐颢, 黎秀娣, 黎华寿. 不同景观斑块结构对茶园节肢动物多样性的影响. 应用生态学报, 2013, 24(5):1305- 1312.
[32] Tang Q, Liang G F, Lu X L, Ding S Y. Effects of corridor networks on plant species composition and diversity in an intensive agriculture landscape. Chinese Geographical Science, 2014, 24(1):93- 103.
[33] 卢训令, 梁国付, 汤茜, 丁圣彦, 李乾玺, 张晓青. 黄河下游平原农业景观中非农生境植物多样性. 生态学报, 2014, 34(4):789- 797.
[34] Monteiro A T, Fava F, Gonçalves J, Huete A, Gusmeroli F, Parolo G, Spano D, Bocchi S. Landscape context determinants to plant diversity in the permanent meadows of Southern European Alps. Biodiversity and Conservation, 2013, 22(4):937- 958.
[35] 尹文英. 中国土壤动物检索图鉴. 北京:科学出版社, 1998.
[36] 郑乐怡, 归鸿. 昆虫分类. 南京:南京师范大学出版社, 1999.
[37] Grueber C E, Nakagawa S, Laws R J, Jamieson I G. Multimodel inference in ecology and evolution:challenges and solutions. Journal of Evolutionary Biology, 2011, 24(4):699- 711.
[38] Burnham K P, Anderson D R, Huyvaert K P. AIC model selection and multimodel inference in behavioral ecology:some background, observations, and comparisons. Behavioral Ecology and Sociobiology, 2011, 65(1):23- 35.
[39] Dochtermann N A, Jenkins S H. Developing multiple hypotheses in behavioral ecology. Behavioral Ecology and Sociobiology, 2011, 65(1):37- 45.
[40] R Development Core Team. R:A Language and Environment for Statistical Computing. R Foundation for Statistical Computing, Vienna, Austria, 2012.
Effects of agricultural landscape dynamics on the species diversity of ground arthropods in woodlands
HOU Xiaoyun1, SONG Bo1, ZHAO Shuang1, DING Shengyan1, 2, *, LIANG Guofu1, DONG Cuifang1
1CollegeofEnvironmentandPlanning,HenanUniversity,Kaifeng475004,China;2InstituteofEcologicalScienceandTechnology,HenanUniversity,Kaifeng475004,China
Biodiversity is one of the most limiting factors for ecosystem services. It is well known that there are very close connections between agricultural ecosystems and species diversity. Large numbers of non-agricultural wildlife rely on the food and habitats provided by the agricultural landscape. Natural and semi-natural habitats (such as farmland boundaries, woodland, hedges, and creeks) in agro-landscapes have very important effects on ground arthropods inhabiting these microenvironments. The lower reaches of the Yellow River, China, is a major grain producing areas in China, and is important for the security of the national food supply. It is crucial to study the relationships between regional agro-landscape heterogeneity and biodiversity to maximize ecosystem services and to maintain ecosystem stability. In this study, Fengqiu County in Henan Province, which is a typical agricultural region in the lower reaches of the Yellow River, was selected to investigate the effects of agricultural landscape dynamics on the species diversity of ground arthropods in woodlands. The Shannon diversity index and species richness were applied to explore the relationships between landscape changes and arthropod diversity from 1984 to 2012. The role of the landscape context on ground arthropod diversity in woodlands was evaluated by a multi-model inference (MMI) based on the Akaike information criterion (AIC). Five competing models of landscape context were used to analyze how it impacts arthropods. These models included habitat quality (H1, 2012), matrix quality (H2, 2012), habitat change (H3, 1984—2012), matrix quality change (H4, 1984—2012), and soil-environmental conditions (H5, 2012). All of these models were measured respectively at four spatial scales (100, 250, 350, and 500m) to examine how spatial scales impact ground arthropod diversity. The relationship between the response variables and the predictor variables was analyzed by Generalized Linear Models (GLM) in R statistical software. From 1984 to 2013 in the study area, woodland area increased significantly, while agricultural landscape heterogeneity increased substantially. The dominant groups of ground arthropods included Hymenoptera, Coleoptera, Amphipoda, and Araneae. The impacts of landscape context on ground arthropod diversity in woodlands were significantly scale-dependent. Habitat quality (H1) was the highest supported model for explaining Shannon diversity index and species richness of the ground arthropod community at a small scale (100m). As the spatial scale increased, the Shannon diversity index and species richness responded mostly to habitat change quality (H3) in the broader surroundings (250, 350, and 500m). No significant correlation was observed between matrix quality and soil-environmental conditions (H2 and H5). The responses to landscape context of ground arthropod species richness and Shannon diversity index were fairly consistent, significantly responding to habitat quality. Approximately 40%of variation in ground arthropod diversity was explained by the landscape context. In the study area, habitat quality (H1) may represent a good indicator for the Shannon diversity index and species richness. The analytical results showed that historic landscape change also has a predominant influence on the present features of ground arthropod diversity in woodlands; thus, the temporal dynamics of the landscape context may help towards improving our understanding about the interactions between landscape context change and ground arthropod diversity in woodlands. To enhance the explanation for the effects of landscape context on ground arthropods, further studies should consider additional landscape competing models and multi-scale spatiotemporal analysis.
multi-model inference; Akaike information criterion; ground arthropods; biodiversity; woodlands; agricultural landscape
国家自然科学基金资助项目(41071118, 41371195)
2014- 05- 15; < class="emphasis_bold">网络出版日期:
日期:2015- 05- 19
10.5846/stxb201405150993
*通讯作者Corresponding author.E-mail:syding@henu.edu.cn
侯笑云,宋博,赵爽,丁圣彦,梁国付,董翠芳.农业景观动态对林地地表节肢动物多样性的影响.生态学报,2015,35(23):7659- 7668.
Hou X Y, Song B, Zhao S, Ding S Y, Liang G F, Dong C F.Effects of agricultural landscape dynamics on the species diversity of ground arthropods in woodlands.Acta Ecologica Sinica,2015,35(23):7659- 7668.

