In f uence of fabric anisotropy on seismic responses of foundations
Jin Qin,Xingwu Zeng,Hiyn Ming
aDepartment of Civil Engineering,Case Western Reserve University,Cleveland,OH 44106,USA
bDepartment of Civil Engineering,Shenzhen University,Shenzhen 518060,China
In f uence of fabric anisotropy on seismic responses of foundations
Jin Qina,*,Xiangwu Zenga,Haiyan Mingb
aDepartment of Civil Engineering,Case Western Reserve University,Cleveland,OH 44106,USA
bDepartment of Civil Engineering,Shenzhen University,Shenzhen 518060,China
A R T I C L E I N F O
Article history:
Received 2 January 2015
Received in revised form
9 February 2015
Accepted 12 February 2015
Available online 23 February 2015
Soil mechanics
Angular sand
Centrifuge modeling
Fabric anisotropy
Seismic response
Earthquakes,as one of the well-known natural disasters,are highly destructive and unpredictable. Foundation failure due to liquefaction induced by earthquakes can cause casualties as well as signi f cant damage to the building itself.Fabric anisotropy of soil grains is considered to be an important factor in dynamic soil response based on previous researches and laboratory tests.However,the limited availability of real physical data makes it less persuasive.In this study,a shake table installed on a geotechnical centrifuge is used to provide the designed seismic motions,and therefore,to simulate the realistic earthquake motion to foundations.Important parameters in the responses such as acceleration, excess pore pressure and deformation are evaluated to investigate the in f uence.Implications for design are also discussed.
©2015 Institute of Rock and Soil Mechanics,Chinese Academy of Sciences.Production and hosting by Elsevier B.V.All rights reserved.
1.Introduction
Earthquakes,like other major natural disasters,can impact people’s lives every year.Structures often suffer serve damage and the induced casualties are huge.During an earthquake,the foundation failure due to liquefaction has been and continues to be a major type of damage.The direct and indirect costs associated with ground failure are enormous.
To better understand the earthquake damage,many researchers attempted to identify the key parameters contributing to the failure.Tokimatsu and Uchida(1990)studied the correlation between liquefaction resistance and shear wave velocity.Seed and Idriss (1971)developed a simpli f ed procedure to evaluate liquefaction potential of soils,which became a standard procedure throughout North American and much of the world.In addition,Seed et al. (1983)found that anisotropy is one of the most important factors that in f uence strength,bearing capacity and liquefaction resistance of sand.Anisotropy means that the properties of soil are directionally dependent,and in most cases,is the result of weathering of hard rocks or sedimentary bodies(Brewer,1964). Arulanandan et al.(1979)is one of the few researchers who worked on dynamic problems associated with fabric anisotropy.Recently, Zeng et al.(2010)conducted research on the effect of fabric anisotropy on seismic response of a retaining wall.
In this context,two groups of centrifuge tests were conducted on modeling dry and saturated sand samples in order to analyze the in f uence of fabric anisotropy.Shallow foundations were used in the tests.They are usually embedded in about 1 m soil.Three foundation shapes were selected,including regular rectangular foundation,circular foundation and multi-circular foundation. Pictures of model foundations are shown in Fig.1.
2.Facilities and instrumentation
2.1.Centrifuge and control system
The Case Western Reserve University(CWRU)geotechnical centrifuge is located in a below-ground open and square chamber with a height of 1.8 m and sides of 4.2 m.The construction began at 1996 and completed in 1997.It is surrounded by 15 cm thick reinforced concrete walls and support slab.The control room f oor level is raised about 1 m above that of the laboratory to provide additional safety.
The payload capacity is 20g-t with a maximum acceleration of 200gfor static tests and 100gfor dynamic tests.The centrifuge arm has a radius of 1.07 m while the dual platforms lie at a radius of 1.37 m.By using the dual platforms,two models can be set up at the same time with a maximum payload of 182 kg.
In dynamic test,it is customary to have only one model,and the centrifuge arm is balanced by adjusting the counterbalance weights on the swing platformwhich is opposed to the testing platform.Thedynamic imbalance force is monitored at one of the three support footings with a sensitive linear variable displacement transformer (LVDT)attached to the centrifuge control computer.The picture of centrifuge is shown in Fig.2.

Fig.1.Model foundations.(a)Circular foundation,(b)Rectangular foundation,(c) Multi-circular foundation.
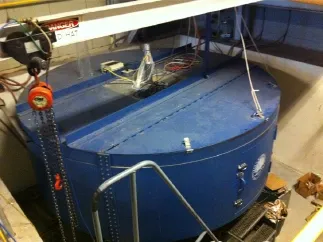
Fig.2.CWRU geotechnical centrifuge.

Fig.3.(a)Electro-hydraulic shaker on centrifuge and(b)model container.

Fig.4.Comparison between desired earthquake and achieved earthquake.
2.2.Electro-hydraulic shaker
The centrifuge is equipped with a hydraulic shaker designed by the TEAM Corporation.The shaker utilizes a linear hydraulic actuator to vibrate the model container placed upon a slip table.The electro-hydraulic shaker is a high-performance servomechanism, optimized for high-frequency operation.It can be programmed to achieve the required input motion.The direction of shaking is perpendicular to the vector of rotation of the centrifuge(Figueroa et al.,1998).
In this project,an aluminum rigid model container was designed and manufactured for the tests.The internal dimensions of the box are 53.3 cm(length)×24.1 cm(width)×17.7 cm (height).All designed tests were performed with this equipment. The electro-hydraulic shaker and the container are shown in Fig.3.
A calibration test was performed on the box before conducting the tests so as to simulate the earthquake that would have the desired amplitude and frequency.A comparison between the achieved input motion and desired input motion shows similarity,as illustrated in Fig.4.
2.3.Instruments
In order to quantify the testing results,three types of measurement instruments were introduced(Fig.5):f ve ICP accelerometers(ACC),six high-performance pressure transducers(PPT) and two DC LVDTs.Pore pressure transducers were placed along theaxis of the transducer perpendicular to the direction of shaking so as to minimize the effect of inertia force.

Fig.5.Measuring instruments.
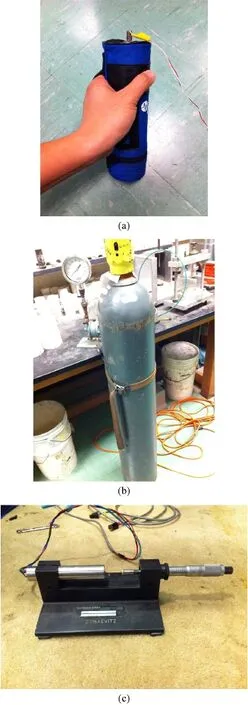
Fig.6.(a)ACC calibration,(b)PPT calibration,and(c)LVDT calibration.
All the instruments were calibrated prior to the tests and checked again after each test.The calibration was individually operated and prepared.For example,each of the pore pressure transducers was soaked in de-aired water for at least 24 h prior to sample preparation.Pictures of calibration process are shown in Fig.6.

Fig.7.(a)Particles of Toyoura sand and(b)Nevada sand under microscope(40×).
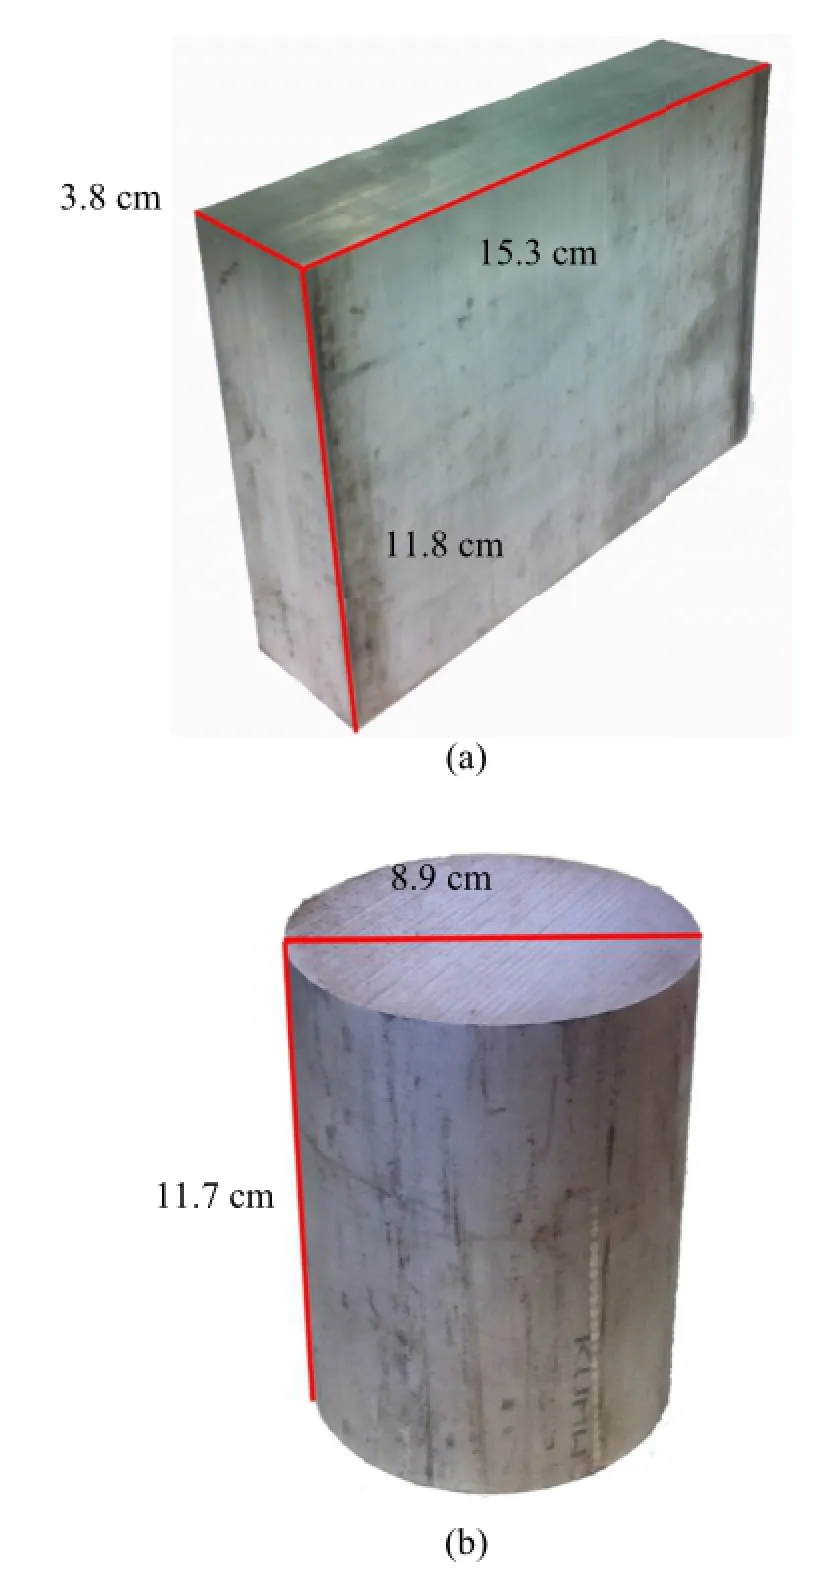
Fig.8.(a)Scaled rectangular model and(b)scaled circular model.
3.Model preparation
In order to acquire the property of fabric anisotropy,Toyoura sand was used in the f rst group of tests.This type of sand has high angularity and is widely used for fabric anisotropy studies.On the other hand,sub-rounded Nevada sand was introduced for comparison purpose.Particle shapes of both sand samples under microscope(40×)are shown in Fig.7.
Two scale models have been designed and built for this study so far.They were both made of aluminum.The geometry of the models is shown in Fig.8.Both models are about 118 mm high with a crosssectional area of 6000 mm2.The mass of the prototype is 250 t.The pressure induced by the foundation on the ground was 150 kPa. Models were placed on top of the sand in the container without any f xation.
Different methods of reconstituting sand samples have been used in the past,such as moist tamping,air pluviation and wet pluviation.In this case,air pluviation method was introduced for sample preparation in combination with a funnel(Vaid and Negussey,1988),which is considered to be approximately a nature deposition process.The designed relative density is 65%,which was controlled by the height and rate of pouring(Miura and Toki, 1982).Calibration tests were performed in advance for veri f cation purpose.
Oda and Koishikawa(1977)stated that anisotropy response was observed in ultimate bearing capacity of sand with action of gravitational force.In our study,each group of tests was conducted with three deposition angles:0°,45°and 90°.
For the 0°deposition angle tests,the rigid soil container was placed f at on the ground and funnel was set at the targeted height. The diameter of pouring holes was adjusted to control pouring volume rate corresponding to the desired relative density.Sand was poured in layers by using dry pluviation method.The pouring was stopped when sand level reached the target height for transducer placement.De-aired water is used as pore f uid in the saturated tests to minimize interference from air-bubbles.In addition,a sealed wooden box with an airtight cover guaranteed a high degree of saturation(Dief,2000).

Fig.9.Model preparation with 45°deposition angle.

Fig.10.(a)3D Model con f guration and(b)shake table.

Fig.11.Cross-sectional view of the centrifuge model.
On the other hand,for tests with 45°and 90°deposition angles,most procedures were the same,except that the container was tilted by 45°or 90°against the wall at f rst.Then,the side wall was removed and pouring started.Styrofoam blocks were used to help hold the existing sand.The wall was installed back when the pouring was f nished and the container was tilted back to horizontal orientation.Styrofoam blocks were removed afterwards.
After pouring was completed,the sand surface was prepared f at with a leveling device and excess sand was removed from the container.A sketch of the model preparation with 45°deposition angle is illustrated in Fig.9.
At the beginning of model preparation,all materials were weighted to calculate the total counter-weight needed.The pro f le of the model was measured so that the cross-sectional view of the model before the test can be compared to that after the application of the earthquake motion.
After model container was prepared,the rigid box was carefully moved from the saturation box and fastened on the shake table of the centrifuge.The counter-weight was added to the other side of the swing arm.All of the transducers were properly connected.The camera was then turned on and started to record the whole process.Before starting the centrifuge,a complete checkup of all equipment and connections on the arm was carried out.The model con f guration is shown in Fig.10.
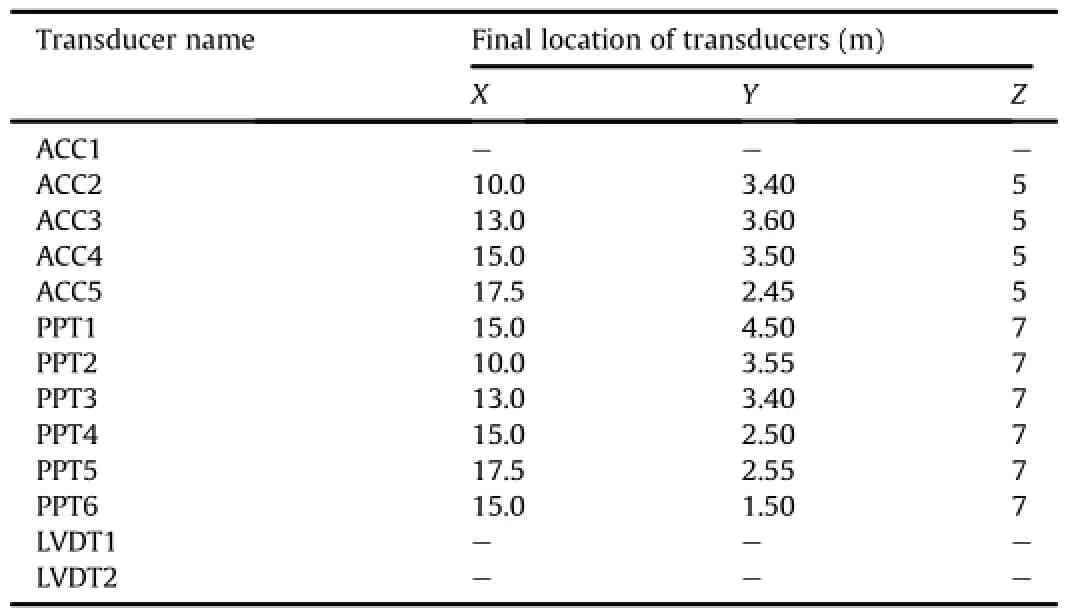
Table 1Transducers coordinates system(0°,Toyoura sand at saturated,prototype scale).
4.Results and discussions
All transducers locations were determined before the tests and re-measured after the tests.The locations were maintained the same in all tests for comparison purpose.The accelerometers were placed in the prototype-horizontal direction to record the horizontal acceleration of the soil at the selected depths and the pore pressure transducers were placed in the prototype-vertical direction at the selected depths to investigate when and where liquefaction occurred.In addition,two LVDTs were f xed at the top of the model structure to monitor the horizontal and vertical displacements during the tests.A sketch of the model is illustrated in Fig.11.The coordinates of all transducers in one test are shown in Table 1.All data are reported in the prototype scale and the original data are reported here with no data processing technique used.
4.1.Effect of fabric anisotropy on acceleration
The results recorded by ACC3 in dry condition were selected for analysis here.Fig.12a shows the testing results using Toyoura sand and Fig.12b is the ones using Nevada sand.Comparing all six f gures recorded by ACC3 in the same test location(Fig.12),no signi f cant difference in amplitude values was observed between each other.
In addition,two sets of testing results recorded by ACC3 and ACC5 are shown in Fig.13c and d.Both graphs represent the tests using Toyoura sand in saturated condition.ACC3 and ACC5 were located in the transition zone of the general bearing capacity failure pattern,which were 1.5 m and 2.5 m away from the sand surface,respectively.Based on the results,the amplitudes of acceleration recorded from ACC3 was slightly greater than those from ACC5.
Therefore,it is indicated that depth is certainly one of the factors affecting ground accelerations.For the two acceleration timehistories recorded by ACC2 in Fig.13a and b,it is clear that more signi f cant amplitude reduction was observed in the tests with Toyoura sand,especially with high deposition angles.
Moreover,from Figs.12a and 13c,similar amplitude of acceleration was observed for all dry tests with different deposition angles. On the other hand,the models deposited by 90°in saturated condition have more clear amplitude reduction in comparison with models with 0°deposition angle than those tests in dry condition. In other words,the existence of water largely increases the effort of fabric anisotropy.
Comparing the amplitudes of acceleration from different zones,it can be seen that in f uence of fabric anisotropy on acceleration in or near the passive earth pressure zone(ACC2)is more signi f cant than that in the active earth pressure zone (ACC4).
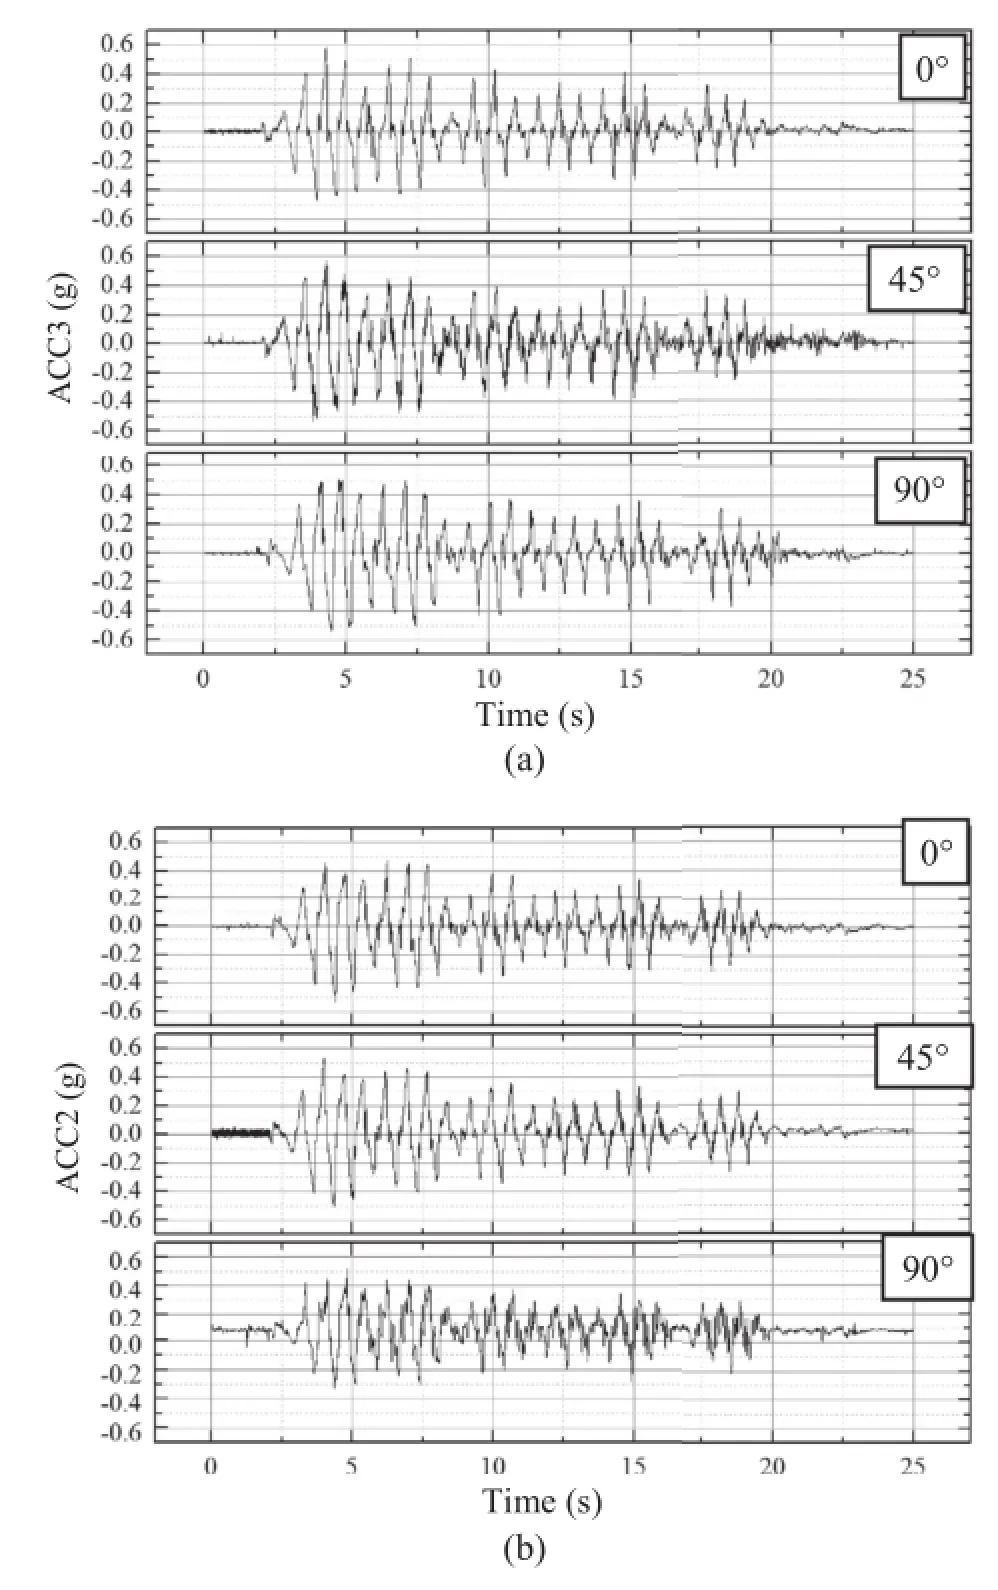
Fig.12.Recorded acceleration time-histories in dry condition.(a)Toyoura sand in dry condition.(b)Nevada sand in dry condition.
4.2.Effect of fabric anisotropy on pore water pressure
For the saturated test,records from PPT1,4,6 were chosen for discussion.PPT1(black)was buried right under the model foundation with a depth of 0.5 m.PPT4(red)was located at 2.5 m deep and PPT6(blue)was 3.5 m deep from the soil surface.
As shown in Fig.14,none of the curves reached the value of 1.0, suggesting that the liquefaction did not occur at the location of PPT1,PPT4 or PPT6,regardless of the deposition angle.For PPT1,all the pore water pressure ratios are relatively small for its high initial effective stress,of which over 90%was transferred from the upper structure.On the other hand,PPT4 and PPT6 were not affected by upper structure as much as PPT1.However,the deeper locations come with higher soil effective stress,which also keep the ratio under the value of 1.0.In addition,based on the pore pressure ratio value,it seems that the test with 90°deposition angle always has the earliest and longest duration of liquefaction,while the data with 0°have the latest and shortest one,which con f rms again that the samples prepared with 0°deposition angle have the highest liquefaction resistance.
4.3.Effect of fabric anisotropy on displacement
Two LVDTs used in the tests were f xed on the container to measure the horizontal and vertical displacements of the model foundation.Due to the limitation of the measurement range of LVDTs,large displacement in saturated tests cannot be completely recorded.The results were manually measured and summarized in Table 2.
From the curves shown in Fig.15 and the values listed in Table 2, it is obvious that sample prepared with 0°deposition angle always has the least displacement,and the results are more signi f cant in the tests with Toyoura sand in saturated condition,which once again agrees with the results recorded by accelerometers and pressure transducers.

Fig.13.Recorded acceleration time-histories of Nevada sand and Toyoura sand in saturated condition.(a)Toyoura sand in saturated condition.(b)Nevada sand in saturated condition.(c)Toyoura sand in saturated condition.(d)Toyoura sand in saturated condition.

Fig.14.Time-histories recorded by pore pressure transducers(PPT1,4,and 6)of Toyoura sand in saturated condition.

Table 2Test results of settlements.

Fig.15.Time-histories of vertical displacement recorded by LVDTs in the dry tests.
5.Conclusions
In f uence of fabric anisotropy on seismic response of foundations is studied based on the results of twelve tests conducted in this study.The conclusions of the study are drawn as follows:
(1)Fabric anisotropy does not show great impact on the tests in dry condition.However,signi f cant differences are observed on liquefaction resistance and displacements in presence of water.
(2)Models prepared with deposition angle of 0°have the highest liquefaction resistance.The in f uence of fabric anisotropy is more signi f cant in passive zone of foundation failure curve than in active zone.
(3)Sand with higher angularity has stronger fabric anisotropy. Thus,it should be considered as an important parameter in the design.
(4)Shape factor of the foundation has not been analyzed in this study.More geotechnical centrifuge tests will be conducted for further study.
Con f ict of interest
The authors wish to con f rm that there are no known con f icts of interest associated with this publication and there has been no signi f cant f nancial support for this work that could have in f uenced its outcome.
Acknowledgments
The authors would like to thank the support by National Natural Science Foundation of China under Grant No.51278307.
Arulanandan K,Douglas BJ,Green RK,Arulmoli K.Anisotropic sand structure related to dynamic pore pressures.In:Offshore Technology Conference.Houston,TX,USA;1979.
Brewer R.Fabric and mineral analysis of soils.New York:Wiley;1964.
Dief HM.Evaluating the liquefaction potential of soils by the energy method in the centrifuge.PhD Thesis.Cleveland,Ohio,USA:Case Western Reserve University; 2000.
Figueroa JL,Saada AS,Dief HM,Dietz CP.Development of the geotechnical centrifuge at Case Western Reserve University.In:Proceedings of the international conference:centrifuge.Rotterdam:A.A.Balkema;1998.p.3-9.
Miura S,Toki S.A sample preparation method and its effect on static and cyclic deformation-strength properties of sand.Soils and Foundations 1982;22(1): 61-77.
Oda M,Koishikawa I.Anisotropic fabric of sands.In:The 9th International Conference on Soil Mechanics and Foundation Engineering.Tokyo,Japan:Kluwer Academic Publishers-Plenum Publishers;1977.p.235-8.
Seed HB,Idriss IM.Simpli f ed procedure for evaluating soil liquefaction potential. Journal of the Soil Mechanics and Foundations Division 1971;97(9):1249-73.
Seed H,Idriss I,Arango I.Evaluation of liquefaction potential using f eld performance data.Journal of Geotechnical Engineering 1983;109(3):458-82.
Tokimatsu K,Uchida A.Correlation between liquefaction resistance and shear wave velocity.Soils and Foundations 1990;30(2):33-42.
Vaid YP,Negussey D.Preparation of reconstituted sand specimens.West Conshohocken,PA:ASTM STP 977;1988.
Zeng X,Li B,Min H.Effect of fabric anisotropy on seismic response of a retaining wall.In:Proceedings of the 7th International Conference on Physical Modelling in Geotechnics.Zurich,Switzerland;2010.

Mr.Jin Qinis working as a research assistant at Case Western Reserve University,Cleveland,Ohio,USA.His research interests cover geotechnical engineering,earthquake engineering,centrifuge modeling,offshore wind foundation,laboratory testing,etc.
*Corresponding author.Tel.:+1 2165518046.
E-mail address:jxq32@case.edu(J.Qin).
Peer review under responsibility of Institute of Rock and Soil Mechanics,Chinese Academy of Sciences.
1674-7755©2015 Institute of Rock and Soil Mechanics,Chinese Academy of Sciences.Production and hosting by Elsevier B.V.All rights reserved.
http://dx.doi.org/10.1016/j.jrmge.2015.02.003
 Journal of Rock Mechanics and Geotechnical Engineering2015年2期
- Journal of Rock Mechanics and Geotechnical Engineering的其它文章
- Laboratory study on the mechanical behaviors of an anisotropic shale rock
- Thermo-mechanical constitutive modeling of unsaturated clays based on the critical state concepts
- Monitoring result analyses of high slope of f ve-step ship lock in the Three Gorges Project
- UCIMS:Advances in geotechnical construction and performance monitoring
- Liquefaction evaluation of dam foundation soils considering overlying structure
- Improvement parameters in dynamic compaction adjacent to the slopes
