
Laboratory study on the mechanical behaviors of an anisotropic shale rock
2015-02-08 09:03QuanGaoJunliangTaoJianyingHuXiongBillYu
Quan Gao,Junliang Tao,Jianying Hu,Xiong(Bill)Yu
Department of Civil Engineering,Case Western Reserve University,10900 Euclid Avenue,Cleveland,OH 44106,USA
Laboratory study on the mechanical behaviors of an anisotropic shale rock
Quan Gao,Junliang Tao,Jianying Hu,Xiong(Bill)Yu*
Department of Civil Engineering,Case Western Reserve University,10900 Euclid Avenue,Cleveland,OH 44106,USA
A R T I C L E I N F O
Article history:
Received 22 January 2015
Received in revised form
4 March 2015
Accepted 6 March 2015
Available online 19 March 2015
Shale rock
Anisotropy
Shear wave
Compression wave
Shale gas is becoming an important energy source worldwide.The geomechanical properties of shale rocks can have a major impact on the ef f ciency of shale gas exploration.This paper studied the mineralogical and mechanical characteristics of a typical gas shale in Ohio,USA.Scanning electron microscope(SEM)with energy dispersive X-ray(EDX)analyses was employed to measure the microstructure and material composition of the shale rock.The anisotropic behaviors of shale rock,including compressive and tensile strengths,were experimentally measured.The characteristics of shale rock were also studied by nondestructive wave speed measurements.The shale demonstrated strong anisotropic behaviors with the tensile strengths perpendicular to the bedding plane around 300-360 times of that parallel to bedding plane.Results of ultrasonic tests indicated that both compression and shear wave velocities show strong anisotropic patterns.The compression wave speed was the smallest in the direction perpendicular to the bedding plane;while the shear wave speed was the smallest in the direction parallel to the bedding plane.The ratio of wave speed anisotropy is around 1.3-1.4 for compression wave;the ratio of shear wave speed anisotropy is larger and more diverse compared with the compression wave anisotropy.This might be related to the larger variability in the frictional adhesive strength along bedding plane than the compressive adhesive strength.
©2015 Institute of Rock and Soil Mechanics,Chinese Academy of Sciences.Production and hosting by Elsevier B.V.All rights reserved.
1.Introduction
Shale gas has aroused signi f cant interest worldwide due to its potential as a major natural gas supply source.It is geographically widely distributed with major capacities in USA(Peebles,1980; Donohue et al.,1981;Zielinski and McIver,1982;Selley,2012),UK (Brooks et al.,2001;Swann and Munns,2003;Selley,2012),China (Zou et al.,2010;Chen et al.,2011;Huang et al.,2012),and other countries.Geomechanics study of shale gas is important for the effective recovery of shale gas such as wellbore instability,optimization of hydraulic fracture,etc.All of these require to understand the mechanical properties of shale rocks surrounding the wellbores(Ibanez and Kronenberg,1993;Horsrud et al.,1998;Al-Bazali et al.,2008).
A number of publications have focused on understanding the physical,electrical,thermal and geochemical properties of shale rocks.For example,Al-Harahsheha et al.(2009)studied the dielectric properties of Jordanian shale and the effect of organic content,temperature,and moisture content on its dielectric constant.Other researchers(Jones and Wang,1981;Holt et al., 1991;Hornby et al.,1994;Liu et al.,1994;Johnston and Christensen,1995;Vernik and Landis,1996;Hornby,1998; Sayers,1999;Kuila et al.,2011)studied factors such as the preferred orientation of clay minerals,presence of f uid f lled microcracks,stress state and stress history,and physicochemical interactions with pore f uids on the rock behaviors.These factors were believed to affect shale anisotropy.Sonibare et al.(2005) studied the thermal breakdown of shale.Researchers such as Low and Anderson(1958),Pashley and Israelachvili(1984) investigated the swelling behaviors of shale.The results showed that capillary suction,osmotic pressure and hydraulic pore pressure imbalance were the possible causes of observed swelling phenomena in shale rocks.However,limited experimental data on shale are available due to the dif f culty in preserving shale rock sample caused by its fragile nature(Hornby, 1998;Kuila et al.,2011).
Understanding the anisotropic behaviors of shale rock has important impacts on shale energy exploration,wellbore stability,interpretation of microseismic monitoring,etc.This paper studied the anisotropic behaviors of shale rocks at both smallstrain and large strain levels.A unique characteristic of shale rock is its anisotropic behavior,which has important impacts on the fracture pattern and consequently the ef f ciency in shale gas exploration.Anisotropic compression and tensile strengths of shale rocks were measured by uniaxial compression test as well as direct and indirect tensile tests.Directional compression wave velocities of shale were measured using ultrasonic technology.
2.Mineral composition analysis
Samples used in this study are typical gas shale rocks in Northeastern Ohio region.Scanning electron microscope(SEM) with energy dispersive X-ray(EDX)analyses was employed to measure its surface topography,microstructure and chemical composition.Fig.1 shows the SEM images of typical shale sample at different magni f cation factors(×500,×1000,×2000, and×5000).With increasing magni f cation,the crystal structure can be clearly observed.The crystals tend to be in platy structure, which might correspond to the direction of the bedding plane. Element composition of the sample was analyzed with EDX module and the results are presented in Table 1.This table indicates that oxygen(O),silica(Si)and ferrum(Fe)are the primary elements in this shale rock,accounting for nearly 90%of the gross weight.Other elements,such as aluminum(Al),potassium(K) and calcium(Ca),can be also observed but with low content.No appreciable organic components were observed,possibly due to the fact that the entrapped gas might have escaped during storage.

Table 1Chemical element constitution of the shale rock.
3.Experimental design for mechanical tests
3.1.Specimen preparation
Three types of specimens were prepared for different types of destructive or nondestructive mechanical tests(Fig.2).According to ASTM D3967 and D4543,cylindrical specimens with heightdiameter ratio of 2:1 and 1:2 were prepared for direct and indirect tensile tests,respectively.According to the standards,for diameter of the cylindrical specimens of 5 cm,the height of specimens for direct and indirect tensile tests needs to be at least 10 cm and 2.5 cm,respectively.The anisotropic properties(specially the extremely low interlaminar strength)of this type of shale make it very dif f cult to prepare testing specimens with the exact length required.Therefore,the height of prepared specimens for uniaxial compression test and direct tensile test was within the range of 80-100 mm.Prismatic specimens were prepared for wave velocity measurements(Fig.2).The top and bottom surfaces of the specimens were prepared as smooth and f at as possible so that bothends were parallel to each other.Three duplicate specimens were prepared for each type of test.The average density of the shale rock was measured to be around 2.503 g/cm3.
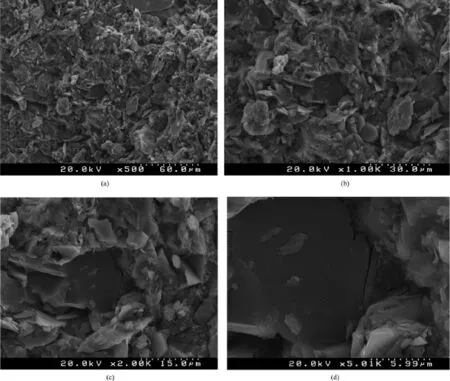
Fig.1.SEM images of shale specimen at different magni f cation factors:(a)×500,(b)×1000,(c)×2000,and(d)×5000.

Fig.2.Photos of representative specimens prepared for different types of mechanical tests:(a)Uniaxial compression and direct tensile test;(b)Indirect tensile test;and(c) Compression and shear wave velocity measurement.
3.2.Testing program
A series of laboratory mechanical tests were conducted on the prepared shale rock specimens,including uniaxial compression tests,direct tensile tests,and indirect tensile tests.The strengths and stress-strain relationships were obtained from the experimental data.A MTS testing system was employed for the testing. The loading rate was set as 0.002 mm/s in both compression and tensile tests.Superglue was applied on both ends of the specimen during direct tensile tests.
The wave speeds in the specimens were measured by nondestructive ultrasonic measurements.Both compression and shear wave modes of ultrasonic transducers were used to measure the compression and shear wave velocities,respectively. Wave velocities in the directions parallel and perpendicular to bedding plane were measured to evaluate the anisotropic behaviors of the shale rock.Fig.3 shows the setup of ultrasonic measuring system,which includes a pulse transmitter,an ultrasonic transducer(with frequency of 0.5 MHz),and a PC oscilloscope.Typically,there are three modes of operation in an ultrasonic test system(Kundu,2000),i.e.pulse echo,throughtransmission,and pitch catch.Through-transmission mode of the ultrasonic system was used in this study,where two ultrasonic transducers served as transmitter and receiver,respectively. The transmitter sends a wide-band acoustic signal into the testing specimen from one surface,which propagates in the testing material and is picked up by the receiver on the opposite surface of the testing specimen.From these,the travel time of the acoustic signal in the testing specimen is determined.The wave velocity can then be calculated from the travel time and the thickness of the specimen.For compression wave tests,the ultrasonic tests were conducted underwater to facilitate the coupling of wave with the testing specimens.For shear wave testing,a special couplant for the shear wave transducers was used.
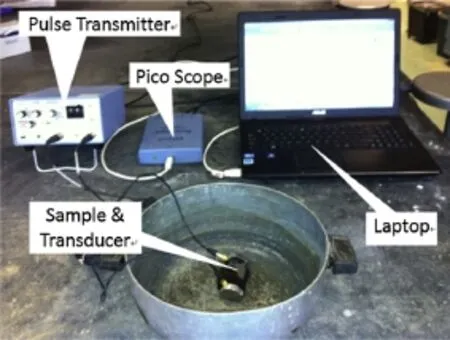
Fig.3.Setup of ultrasonic testing system.
4.Experimental results and analysis
4.1.Uniaxial compression test
Uniaxial compression tests were performed on three groups of specimens.Table 2 presents the summary of the specimens for this type of tests.The stress-strain curves are shown in Fig.4. With the increment of compression strain,stress increases to a peak and then decreases rapidly.The average peak strength is 47.9 MPa.
Fig.5 shows the crack patterns at failure.As can be seen,the crack patterns in anisotropic shale under compression loads are more complex than those observed in a homogenous specimen.In general,the initiation and propagation of cracks play a signi f cant role in the failure behaviors of the anisotropic shale samples.The direction of cracks can be initialized along the circumferential or perpendicular to the bedding plane.As stress increases,more microcracks initiate and propagate in the specimens.When the number of microcracks in the sample exceeds the threshold,the microcracks start to connect with each other,and the whole sample would break into pieces.This corresponds to the collapse failure point in stress-strain curves.
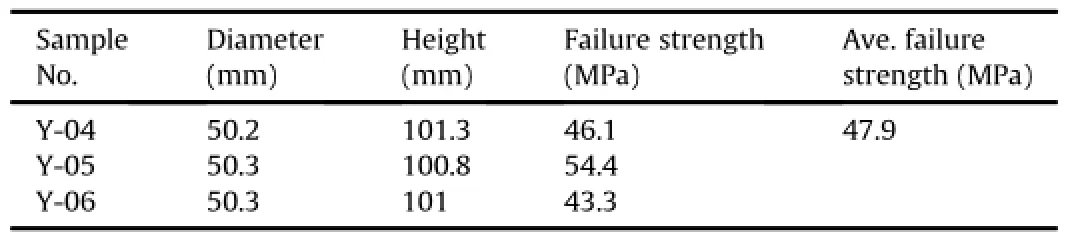
Table 2Summary of specimens for uniaxial compression tests.

Fig.4.Stress-strain relationships of shale in uniaxial compression test.
4.2.Direct tensile test
Table 3 shows the results of direct tensile tests conducted on three duplicate specimens.The results show large variability,which is indicative of the inherent geological variability in the strength of bedding planes.Fig.6 shows the measured stress-strain curves.All curves show brittle types of failure.The following failure mode was observed during the testing process:with the increases in the axial loading,a microcrack f rstly occurred at a certain location in the specimens,and then propagated along the circumference and from the outer circumference to the center of the specimens until the specimen was split into two parts(Fig.7).
There were signi f cant variations in the tensile strength,which is possibly due to the intrinsic variability of rock specimens resulting from the geological process or sample coring procedures. The average tensile strength is 25 kPa,which is the average adhesion strength along the bedding plane.The tensile strength is signi f cantly lower than the compression strength.
4.3.Indirect tensile test
Two groups of specimens(each with 4 duplication)were prepared for indirect tensile tests.The f rst group(P-02,P-03,P-04,P-05)was performed without loading beams at the top or bottom of the specimens;whereas the second group(P-07,P-08,P-09,P-10) was tested with the use of loading beams at both the top and bottom of the specimens.The results are summarized in Table 4. The measured indirect tensile strengths were 7.4 MPa and 9.1 MPa, respectively(Table 4),around 300-360 times of the average tensile strength perpendicular to the bedding plane.

Fig.5.Typical failure mode of samples after uniaxial compression test.
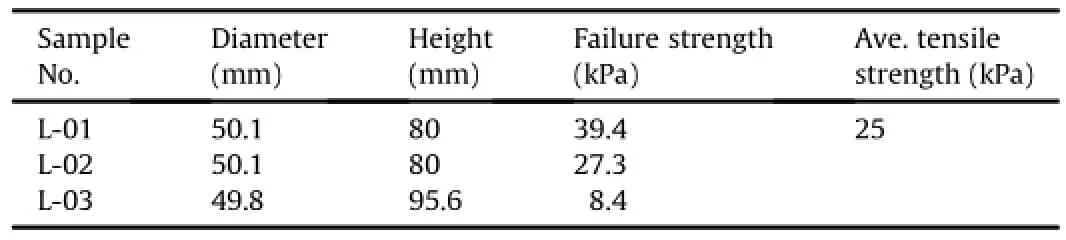
Table 3Summary of specimens in direct tensile tests.
Fig.8 shows the measured load-displacement curves,in which Fig.8a is for testing without loading beams and Fig.8b is for testing with loading beams.The observed failure trends are similar to that of direct tensile tests and compression tests,i.e.the specimens showed brittle types of failures.Secondary peak appears in the load-displacement curves for specimens without loading beams (Fig.8a)compared with those with loading beams(Fig.8b).The reason might be that without loading beams,it is dif f cult for specimens to be in complete contact with loading platens due to surface roughness of the specimens.This might lead to stress concentration and local failure.For example,the secondary peak in the stress-strain curve is likely caused by the unbroken part of the sample.Specimens with loading beams ensure good contact to avoid local failures.This mobilizes the strength of the specimen and results in slightly higher average strengths.
The failure mode of anisotropic shale(due to the low interlaminar strength)under indirect tensile loading is different from and much more complex than that of isotropic rocks(Erarslan and Williams,2012).Fig.9 shows photos of representative types of failure modes.Based on the Hooke’s law,compression stressσ1along the radius direction will lead to tensile stress in the direction perpendicular to the loading direction,i.e.in directions ofσ2andσ3shown in Fig.9a.Both can lead to failures in respective directions. Therefore,besides the typical failure pattern of split tensile tests(Fig.9b),split cracks and failure between layers are intertangled in anisotropic shale(Fig.9c,d and e).It was observed in the tests that the crack or failure parallel to the bedding layers tends to slightly reduce the measured indirect tensile strength.Therefore,it is very dif f cult to accurately determine the indirect tensile strength of anisotropic shale rock by indirect tensile tests without observing/ specifying the actual fracture patterns.The fracture mechanism of anisotropic shale under complex stress conditions is a challenging topic that deserves further investigations.
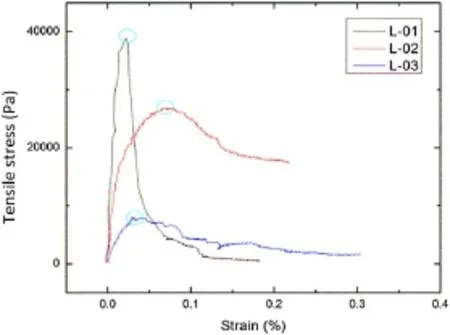
Fig.6.Tensile stress-strain relationships of specimens for direct tensile test.
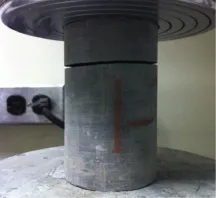
Fig.7.Typical failure mode of specimens after direct tensile test.

Table 4Summary of specimens for indirect tensile tests.
4.4.Ultrasonic wave velocity measurement
Four prismatic specimens were prepared for ultrasonic measurements on the wave speeds of the shale rock.The two surfaces perpendicular to the bedding plane were marked as 1-1 and 2-2, whereas the surface parallel to the bedding plane was marked as 3-3.Wave velocity from three pairs of surfaces was measured with ultrasonic technology as described previously.Fig.10 shows a typical output waveform for compression wave.The red and blue lines are the signals by the transmitter and receiver,respectively. The travel time of the wave between the two opposite surfaces can be determined from the signal arrival analyses.
Fig.11 plots the measured travel time of compression wave as a function of the travel distance(or the dimension of the specimen) in each direction.From this f gure,the average compressional wave velocity in the shale rock along each direction can be easily calculated from the slope of the f tting line.Similar analyses were conducted on the shear wave signals.Reverse polarity method was used to identify the arrival shear waves.The results of compression and shear wave velocities are summarized in Table 5.
The compression wave velocities in the direction parallel to the bedding plane,i.e.1-1 and 2-2 directions,are similar.They are typically 1.3-1.4 times of that perpendicular to the bedding plane, i.e.3-3 direction.The measured shear wave velocity,however,is the smallest in the 2-2 direction(one of the directions parallel to the bedding plane).The ratios of wave speed in different directions are larger and more diverse.That is possibly due to the relatively weak bonding between bedding layers,history of geological formation, etc.This leads to larger variability in the frictional adhesive strength along bedding plane than the compressive adhesive strength.The fundamental mechanism for the observed anisotropic wave speed patterns needs to be further understood.

Fig.8.Load-displacement curves of indirect tensile tests.(a)Without loading beams and(b)with loading beams.

Fig.9.Typical failure mode of specimens after indirect tensile tests.
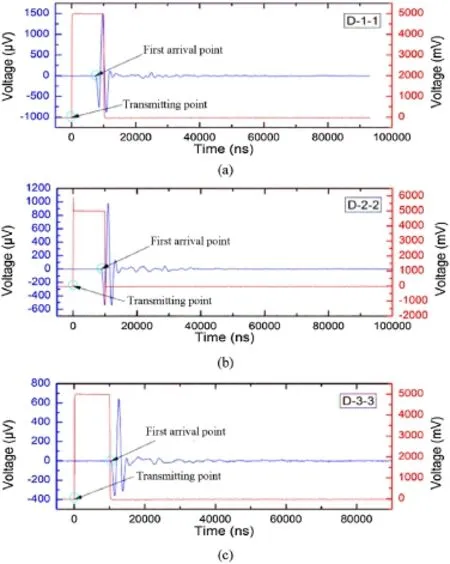
Fig.10.Example of measured ultrasonic waveforms.
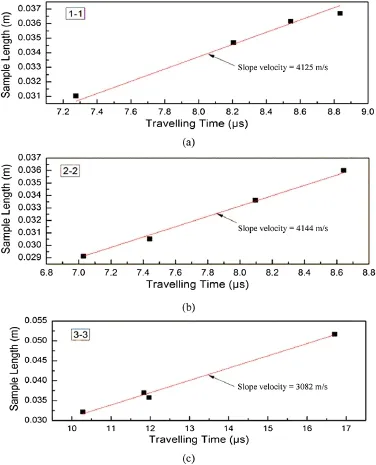
Fig.11.Measured travel time as a function of the travel distance(or the dimension of the specimen)in each direction.
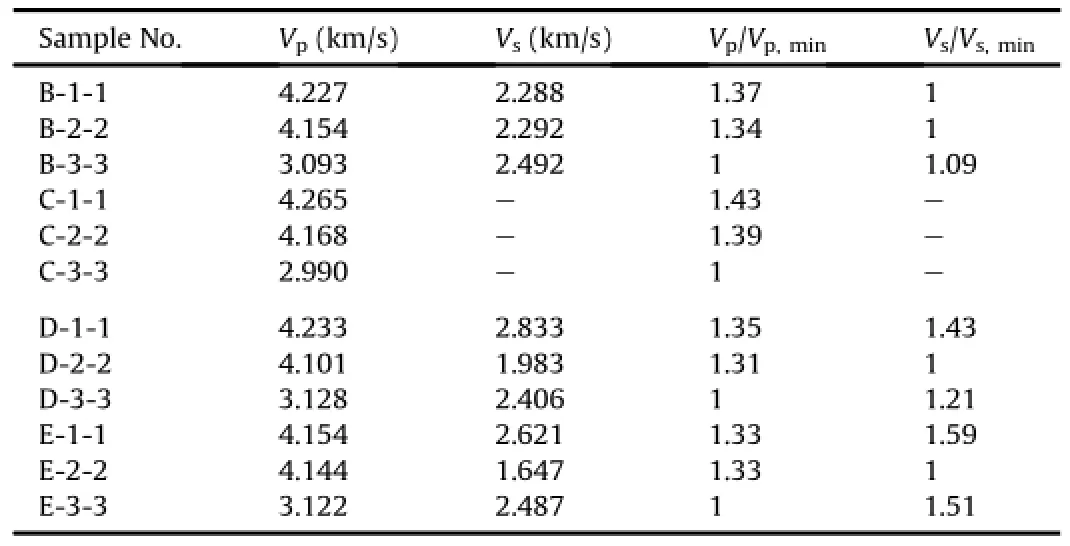
Table 5Summary of shear and compression wave velocity measurements.
5.Conclusions
This paper studied the experimental characterization of the anisotropic behaviors of shale rock at both large strain and small strain levels.The compression and tensile strengths were measured by uniaxial compression tests and direct/indirect tensile tests.From these,the stress-strain behaviors and strength characteristics along different directions were obtained.In general,the compression strength of shale is much higher than tensile strengths.The failure patterns are more complex than those observed in a homogenous specimen.Besides,the tensile strengths of shale rocks are different in the direction parallel to the bedding layers versus those in the direction perpendicular to the bedding layers.From the results of direct and indirect tensile tests,the tensile strength along the bedding layer is around 300-360 times of that perpendicular to the bedding layer.The phenomena observed from indirect tensile test revealed that the tensile strength along the bedding plane might be underestimated due to the in f uence of interlaminar failure along the bedding plane.Results of ultrasonic testing indicated that both compression and shear wave velocities show strong anisotropic patterns.The compression wave speed is the smallest in the direction perpendicular to the bedding plane.The shear wave speed,however,is the smallest in the direction parallel to the bedding plane.The ratio of wave speed anisotropy is around 1.3-1.4 times for compression wave.The ratio of shear wave speed anisotropy is larger and more diverse,which is indicative of the larger variability in the frictional adhesive strength along bedding plane than the compressive adhesive strength.The fundamental mechanism of the observed anisotropic wave speed patterns and the implications for the engineering practice need to be further studied.
Con f ict of interest
The authors wish to con f rm that there are no known con f icts of interest associated with this publication and there has been no signi f cant f nancial support for this work that could have in f uenced its outcome.
Al-Bazali T,Zhang JG,Chenevert ME,Sharm MM.Factors controlling the compressive strength and acoustic properties of shale when interacting with water-based f uids.International Journal of Rock Mechanics and Mining Sciences 2008;45(5):729-38.
Al-Harahsheha M,Kingmanb S,Saeidb A,Robinsonb J,Dimitrakisb G, Alnawa f eha H.Dielectric properties of Jordanian oil shales.Fuel Processing Technology 2009;90(10):1259-64.
Brooks JRV,Stoker SJ,Cameron TDJ.Hydrocarbon exploration opportunities in the twenty-f rst century in the United Kingdom.In:Downey MW,Threet JC, Morgan WA,editors.Petroleum provinces of the twenty-f rst century,AAPG Memoir 74.2001.p.167-99.
Chen SB,Zhu YM,Wang HY,Liu HL,Wei W,Fang JH.Shale gas reservoir characterization:a typical case in the southern Sichuan Basin of China.Energy 2011;36(11):6609-16.
Donohue D,Anstey N,Morrill N.Shale gas in the southern central area of New York State,Vol.4.Morgantown,USA:Department of Energy;1981.
Erarslan N,Williams DJ.Investigating the effect of cyclic loading on the indirect tensile strength of rocks.Rock Mechanics and Rock Engineering 2012;45(3): 327-40.
Holt RM,Fjær E,Raaen AM,Ringstad C.In f uence of stress state and stress history on acoustic wave propagation in sedimentary rocks.In:Hovem JM, Richardson MD,Stoll RD,editors.Shear Waves in Marine Sediments.Kluwer: Springer;1991.p.167-74.
Hornby BE,Schwartz LM,Hudson JA.Anisotropic effective-medium modeling of the elastic properties of shales.Geophysics 1994;59(10):1570-83.
Hornby BE.Experimental laboratory determination of the dynamic elastic properties of wet,drained shales.Journal of Geophysical Research:Solid Earth(1978-2012)1998;103(B12):29945-64.
Horsrud P,Sqonstebo EF,Boe R.Mechanical and petrophysical properties of North Sea shales.International Journal of Rock Mechanics and Mining Sciences 1998;35(8):1009-20.
Huang JL,Zou CN,Li JZ,Dong DZ,Wang SL,Wang SQ,Cheng KM.Shale gas generation and potential of the lower Cambrian Qiongzhusi formation in the southern Sichuan Basin,China.Petroleum Exploration and Development 2012;39(1):75-81.
Ibanez WD,Kronenberg AK.Experimental deformation of shale:mechanical properties and microstructural indicators of mechanisms.International Journal of Rock Mechanics and Mining Sciences and Geomechanics Abstracts 1993;30(7):723-34.
Johnston JE,Christensen NI.Seismic anisotropy of shales.Journal of Geophysical Research:Solid Earth(1978-2012)1995;100(B4):5991-6003.
Jones LEA,Wang HF.Ultrasonic velocities in Cretaceous shales from the Williston Basin.Geophysics 1981;46(3):288-97.
Kuila U,Dewhurst DN,Siggins AF,Raven MD.Stress anisotropy and velocity anisotropy in low porosity shale.Tectonophysics 2011;503(1-2):34-44.
Kundu T.Nondestructive testing techniques for material characterization:modeling in geomechanics.Chichester,UK:John Wiley and Sons Ltd.;2000.p.267-98.
Liu X,Vernik L,Nur A.Effects of saturating f uids on seismic velocities in shales.In: SEG Annual Meeting;1994.p.1121-4.
Low PF,Anderson DM.Osmotic pressure equations for determining thermodynamic properties of soil water.Soil Science 1958;86(5):251-3.
Pashley RM,Israelachvili JN.DLVO and hydration forces between mica surfaces in Mg2+,Ca2+,Si2+and Ba2+chloride solutions.Journal of Colloid and Interface Science 1984;97(2):446-55.
Peebles MHW.Evolution of the gas industry.New York:New York University Press; 1980.
Sayers CM.Stress-dependent seismic anisotropy of shales.Geophysics 1999;64(1): 93-8.
Selley RC.UK shale gas:the story so far.Marine and Petroleum Geology 2012;31(1): 100-9.
Sonibare OO,Ehinola OA,Egashira R.Thermal and geochemical characterization of Lokpanta oil shale,Nigeria.Energy Conversion and Management 2005;46(15-16):2335-44.
Swann G,Munns J.The hydrocarbon prospectivity of Britain’s onshore basins. London:DTI;2003.
Vernik L,Landis C.Elastic anisotropy of source rocks:implications for hydrocarbon generation and primary migration.AAPG Bulletin 1996;80:531-44.
Zielinski RE,McIver RD.Resources and exploration assessment of the oil and gas potential in the devonian shale gas of the Appalachian Basin.Morgantown, USA:Department of Energy;1982.
Zou CN,Dong DZH,Wang SHJ,Li JZ,Li XJ,Wang YM,Li DH,Cheng KM.Geological characteristics and resource potential of shale gas in China.Petroleum Exploration and Development 2010;37(6):641-53.

Dr.Xiong Yuis working as an associate professor at Case Western Reserve University,USA.His research interests cover geotechnical and infrastructure engineering,environmental geotechnology,foundation engineering, nondestructive testing,sensor technology for infrastructure,environment and energy applications,multi-scale mo del of civ il engin e ering mate ria l a nd sy stem, computer-aided design,green design,sustainable engineering,etc.
*Corresponding author.Tel.:+1 216 368 6247.
E-mail address:xiong.yu@case.edu(X.(Bill)Yu).
Peer review under responsibility of Institute of Rock and Soil Mechanics,Chinese Academy of Sciences.
1674-7755©2015 Institute of Rock and Soil Mechanics,Chinese Academy of Sciences.Production and hosting by Elsevier B.V.All rights reserved.
http://dx.doi.org/10.1016/j.jrmge.2015.03.003
 Journal of Rock Mechanics and Geotechnical Engineering2015年2期
- Journal of Rock Mechanics and Geotechnical Engineering的其它文章
- UCIMS:Advances in geotechnical construction and performance monitoring
- A case history study on causation of the landslide in Santa Clara, California,USA
- Thermo-mechanical constitutive modeling of unsaturated clays based on the critical state concepts
- Monitoring result analyses of high slope of f ve-step ship lock in the Three Gorges Project
- Liquefaction evaluation of dam foundation soils considering overlying structure
- Improvement parameters in dynamic compaction adjacent to the slopes