
Determination of hydraulic conductivity of fractured rock masses: A case study for a rock cavern project in Singapore
2015-02-08 09:02ZhipengXuZhiyeZhoJinpingSunMingLu
Zhipeng Xu,Zhiye Zho,Jinping Sun,Ming Lu
aSchool of Civil and Environmental Engineering,Nanyang Technological University,639798 Singapore,Singapore
bThomson Line Division of Rail Group,Land Transport Authority,219428 Singapore,Singapore
Determination of hydraulic conductivity of fractured rock masses: A case study for a rock cavern project in Singapore
Zhipeng Xua,*,Zhiye Zhaoa,Jianping Sunb,Ming Lua
aSchool of Civil and Environmental Engineering,Nanyang Technological University,639798 Singapore,Singapore
bThomson Line Division of Rail Group,Land Transport Authority,219428 Singapore,Singapore
A R T I C L E I N F O
Article history:
Received 30 April 2014
Received in revised form
25 September 2014
Accepted 9 October 2014
Available online 3 December 2014
Rock caverns
Hydraulic conductivity
Fractured rock masses
Seepage analysis
In order to reduce the risk associated with water seepage in an underground rock cavern project in Singapore,a reliable hydro-geological model should be established based on the in situ investigation data.The key challenging issue in the hydro-geological model building is how to integrate limited geological and hydro-geological data to determine the hydraulic conductivity of the fractured rock masses.Based on the data obtained from different stages(feasibility investigation stage,construction stage,and post-construction stage),suitable models and methods are proposed to determine the hydraulic conductivities at different locations and depths,which will be used at other locations in the future.
©2015 Institute of Rock and Soil Mechanics,Chinese Academy of Sciences.Production and hosting by Elsevier B.V.All rights reserved.
1.Introduction
The rock cavern project located at an offshore island in Singapore is an underground liquid hydrocarbon storage facility. The underground storage rock caverns have many advantages over the aboveground storages,in terms of protection against f re, earthquake and explosion,and can save substantial aboveground land for other better uses.The underground rock caverns are also superior in terms of environmental conservation,because the sealing effects of groundwater ensure that there is less danger for the stored oil to leak out to the ground surface(Kiyoyama,1990).
The rock caverns are located at a depth of 130 m beneath a basin, and their crowns are located at about 100 m below the sea bottom. Each rock cavern is excavated by drill-and-blast method,and then lined by a high-pressure spray“shotcrete”.This project includes a number of caverns/tunnels at two levels:the water curtain tunnels are at upper level,and oil storage caverns are at lower level. Groundwater seeps through rock joints,exerting a pressure known as hydrostatic pressure to keep oil from leaking out of the rock mass.The water curtain helps to provide a stable pressure distributed around the caverns.Pressure gauges are installed in the water curtains,and water from the operational and access tunnels is injected continuously into the curtains to maintain the pressure. The water that seeps into the cavern is collected using sumps within the caverns,and then treated and discharged into the sea.
As witnessed in many underground projects all over the world, water seepage related problem is considered as one of the main geological hazards which may potentially cause:accidents,deteriorated working conditions and threat to workers’safety,rockfalls,settlement of aboveground buildings,extended construction duration,and a high cost.The groundwater control during the construction(i.e.excavation)phase and the operation phase plays a critical role in terms of construction/operation cost and construction safety.In order to reduce the risk associated with the groundwater seepage,a reliable hydro-geological model should be established based on the in situ investigation data.The key challenging issue is how to integrate limited geological and hydrogeological data to determine the hydraulic conductivity of the fractured rock masses.For this project,various data are collected at different stages:feasibility investigation stage,construction stage, and post-construction stage.This paper tries to propose suitable models and methods to determine the hydraulic conductivity of the fractured rock masses based on different monitored data.
2.Determination of the hydraulic conductivity at the site investigation stage
At the site investigation stage,six vertical boreholes were drilled to investigate the hydraulic properties of the fractured rock masses. The locations of six vertical boreholes B1 to B6 are shown in Fig.1. The basic information of the six boreholes is listed in Table 1.The fracture orientation data and dip/dip angle were obtained from the borehole survey.In total,72 hydraulic conductivity measurements as listed in Table 1 were conducted in the six boreholes,by theinjection tests.Fig.2 presents the measured hydraulic conductivity data at the six boreholes at the depth between-40 mACD and-200 mACD,where ACD stands for admiralty chart datum.The results show that the hydraulic conductivity varies between 10-11m/s and 10-4m/s.It should be noted that the hydraulic conductivities obtained from the correlation curve of injected water pressure and f ow quantity of the injected water(Spane and Wurstner,1993;Chakrabarty and Enachescu,1997)are based on the assumptions that the fractured rock masses are homogenous, isotropic and porous media,and the f ow geometry is cylindrical, which do not re f ect the anisotropic property of the fractured rock masses.In order to derive the local stress regime at the proposed development area,10 hydrofrac/hydraulic injection tests were conducted in the uncased section of borehole B5 between-96 mACD and-181.4 mACD.A typical test record illustrating the test procedure is shown in Fig.3,and the results of the stress f eld inversion calculations are shown in Fig.4.
In order to obtain anisotropic permeabilitykijalong the boreholes,the following assumptions are made:
(1)Each fracture is idealized by a set of parallel plates with a uniform aperturet.
(2)The solid matrix is impermeable.
(3)The hydraulic gradient is uniformly distributed over the whole body.
(4)Seepage f ow through a fracture can be treated as laminar f ow between parallel plates with a uniform aperture.
(5)There is no water head loss at intersections between
fractures.

Fig.1.Schematic map of locations of the six vertical boreholes.

Table 1Basic information of six boreholes.
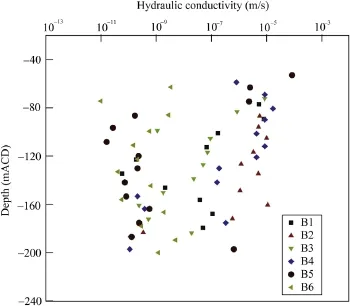
Fig.2.Hydraulic conductivity with increasing depth at the six boreholes.
Based on the above assumptions,the fractured rock masses can be treated as equivalent continuous media,and Oda(1985)proposed hydraulic conductivity components as follows:
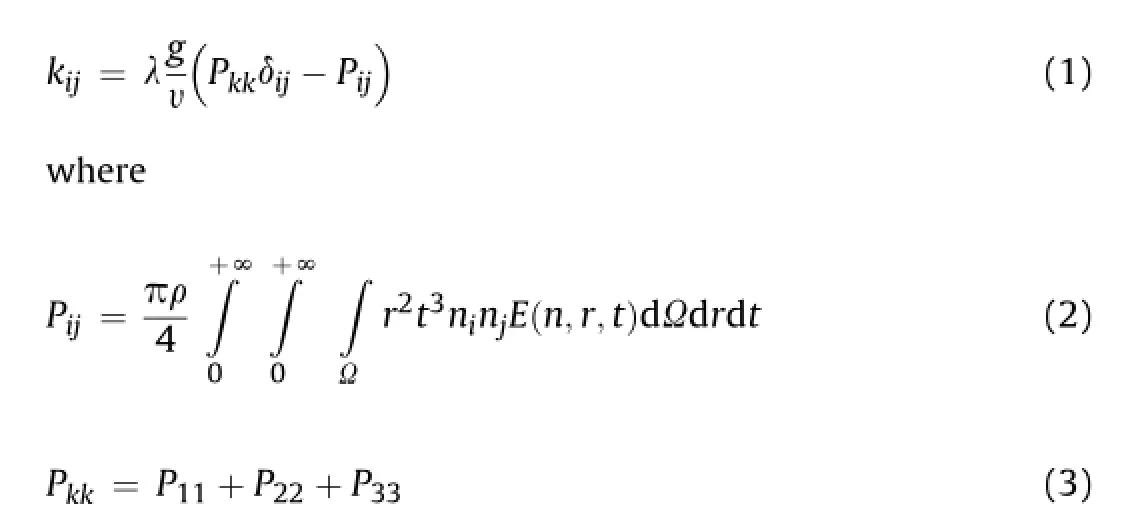
wheregis the gravitational acceleration;υis the kinematic viscosity;λis a dimensionless scalar dependent on the connectivity among joints and can be set to 1/12 for practical applications(Oda et al.,1987);δijis the Kronecker delta;ρis the number of joints per unit volume;niis the component ofnprojected on the orthogonal reference axis system(xi=1,2,3);E(n,r,t)is the density function;ris the fracture length;kijandPijare both symmetric second-rank tensors,and have the principal values in the principal directions.
There is a relationship between the aperturetand the fracture lengthr(Hatton et al.,1994),and a larger fracture tends to have a wider initial aperturet0.The aspect ratiocis introduced as an approximated measure of the fracture lengthr(Oda,1986),because no information about the fracture lengthris available from the site investigation:


Fig.3.A typical set of injection pressure and f ow rate records of hydraulic fracturing test.

Fig.4.Stress pro f le for borehole B5.ShandSHare the minimum and maximum horizontal principal stresses,respectively;andSvis the vertical principal stress.The direction of the maximum horizontal stressSHis N10°(NNE-SSW).


The number of joints per unit volumeρcan be obtained as follows(Cheng,2006):

whereNqk/lis the number of fractures crossed by unit length of a scan line in the directionq.With the assumption that the statisticalvariablesnandrare mutually independent,the density functionE(n,r)is given by Oda(1985)as follows:


Table 2Six components of hydraulic conductivity and three principal hydraulic conductivities at depth of-111 mACD at borehole B6(unit:m/s).
whereE(n),f(r)are the probability density functions ofnandr, respectively.The density functionE(n)can be obtained from the in situ fracture orientation survey.The distributed forms of fracture length,i.e.f(r),can be considered as negative exponential or lognormal form(Dershowitz and Einstein,1988).A lognormal distribution functionf(r)is adopted:


Based on the parameter sensitivity analysis,the ratios of anisotropic hydraulic conductivity,de f ned ask1/k3andk1/k2,are mainly controlled by the fracture orientation distribution and in situ geostatic stress.The in f uence of joint size,normal stiffness constant and aspect ratio on anisotropy is negligible(Cheng,2006). The fracture orientation information in each borehole and in situ stress in borehole B5 are used to determine the anisotropic hydraulic conductivity along the six boreholes.The analysis results show thatk1andk2are almost in horizontal directions,andk3is close to vertical direction.Ask1andk2are almost the same and along horizontal direction,the hydraulic conductivity measured from the injection test can be considered approximately as the average value ofk1andk2.Because the in f uence of joint size, normal stiffness constant and aspect ratio on anisotropic hydraulic conductivity is very little,any parameter can be changed until the average value ofk1andk2equals the hydraulic conductivity measured from injection test,then the hydraulic conductivity components can be considered as the real anisotropic hydraulic conductivities along these boreholes.Table 2 lists the six anisotropic hydraulic conductivity components and three calculated principal hydraulic conductivities.
3.Determination of the hydraulic conductivity at the construction stage
An important part of the project during the construction stage is the characterization of the hydraulic properties of the rock mass through probe holes during the excavation.The work involves the drilling of a number of probe holes from the tunnel front.The water f ow rate and water pressure are measured near the water-bearing zone with 79 measured data at f ve sections,to estimate the hydraulic properties of the rock mass.Based on the measured data, the hydraulic conductivity can be derived based on the following equation(Goodman et al.,1965;Fernandez,1994):

whereQis the measured water f ow rate at the site(m3/s),Lis the drill hole length(m),r′is the drill hole radius(m),andHis the hydraulic head(m).Fig.5 shows the cumulative distribution plot of the 79 hydraulic conductivity data.It shows that the hydraulic conductivity at the water-bearing zone is in the order of 10-6m/s and the average value is 1.73×10⁻⁶m/s.In this case,grouting is used to reduce the hydraulic conductivity in the water-bearing zone and some check holes are used to measure the water f ow and the water pressure after grouting.When reducing the seepage f ow rate or improving the rock mass conditions is needed,grouting will be carried out prior to the excavation:
(1)If the measured f ow rateQis greater than the prede f ned threshold valueQ1for the total water ingress in a certain probe hole.
(2)And/or if the local increment of the water ingressQ′on a 3 m interval is greater than the threshold valueq′.
The prede f ned threshold values ofQ1andq′can be calculated by Eq.(12),andkis the acceptable hydraulic conductivity(i.e.grouting target).In this study,we usek=1×10⁻⁷ m/s forQ1 andk=5×10⁻⁷m/s forq′.

Fig.5.Cumulative distribution of hydraulic conductivity at the water-bearing zone.
The hydraulic conductivity after grouting is evaluated again based on Eq.(12).The results show that the hydraulic conductivity after grouting is in the order of 10-7m/s as shown in Fig.6.It means that the reduction of permeability of the grouted rock mass is successful.

Fig.6.Hydraulic conductivity after grouting based on 34 data from check holes.
4.Determination of the hydraulic conductivity at the postconstruction stage
The practical range of hydraulic conductivity in fractured rock is typically having a large range.It is very hard to determine the hydraulic conductivity along the cavern length.In order to have an indepth understanding in the hydro-geological behavior,the water f ow data,including water pressure,groundwater table and rainfall, were monitored and collected.In this study,only the hydraulic conductivities around Cavern A at lower level(Fig.7)are studied. The hydraulic heads at eight control points in Tunnel A at upper level(Fig.7)were monitored and the water f ow into Cavern A was collected.Data monitored during the 65 d after the Cavern A and Tunnel A were totally excavated are used for model calibration and validation,as shown in Figs.8 and 9.
In order to back calculate hydraulic conductivity,one of the most popular approaches is to compare the measured in f ow data with modeled in f ows,and the relationship between water in f ow and hydraulic conductivity can be established.Several researchers presented analytical solutions to establish the relationship between the hydraulic conductivity and water in f ow for the circular tunnel (e.g.Lei,1999;El Tani,2003).In order to study more complicated scenarios,El Tani(1999)derived formulas which permit the calculation of the water in f ow into tunnels in elliptical or square cross-section.Until now,there is no analytical solution available in general for the water in f ow of tunnels in horseshoe cross-section. In order to derive the relationship,the code FLAC is adopted tomodel the groundwater f ow into the caverns,with following assumptions:
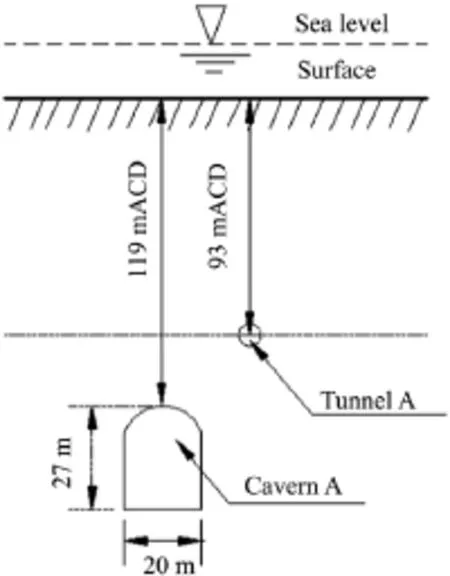
Fig.7.Schematic diagram of Cavern A and Tunnel A.
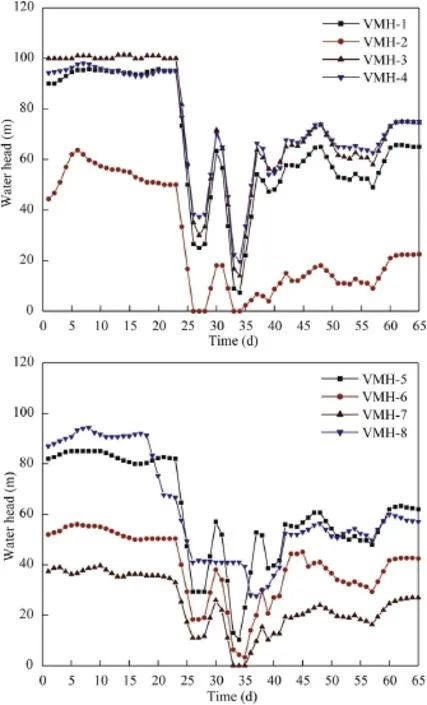
Fig.8.Measured water heads at eight vertical manometer holes(VMHs).
(1)The dimensions of the model domain are chosen large enough to ensure that the boundaries will have little effect on the calculated results.
(2)Atmospheric pressure is effective inside the cavern and at its perimeter.
(3)Groundwater f ow is assumed to be steady,and hydraulic head is not uniform but higher at the cavern crown than that at the invert.
(4)The upper boundary is located at-93 mACD,coinciding with the location of the water pressure monitoring holes.And the lateral and the bottom boundaries are no-f ow boundary.
(5)For the upper boundary,water pressure obtained from the probe holes in gallery tunnel varies from 0 m to 120 m water column(Fig.8),i.e.the parameter ofH.
(6)According to geological survey data,the vertical effective hydraulic conductivity is considered to be 10-10m/s in this case study.
Groundwater is assumed to obey Darcy’s law and is incompressible.The shape of the cavern is horseshoe,with the height of 27 m and the width of 20 m.Based on the numerical results,the relationship between the water in f ow and the hydraulic conductivity around Cavern A can be determined as

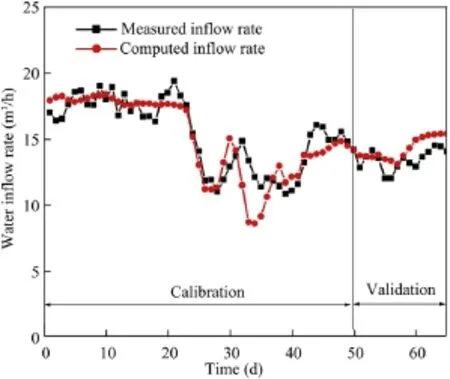
Fig.9.Measured and computed water in f ow rates into Cavern A.
In this project,only eight control points were installed to monitor the water pressure along Tunnel A,so the rock mass around the Cavern A is assumed to have eight hydro-geological units,and each unit has a constant hydraulic conductivity.Data monitored during the f rst 50 d were used for model calibration. Measured data after 50 d were used to test the validity of the model.The back analysis consists of minimizing an error functionEthat represents the discrepancy between the water in f ow into the Cavern A in the f eld and the corresponding computed results, which in turn depend on eight unknown coef f cients of hydraulic conductivitykj:

The hydraulic conductivity distribution along the length of the Cavern A is shown in Fig.10.The result illustrates that the hydraulic conductivities are mainly in the order of 10-10m/s except two locations where the water-bearing zones are intersected with the Cavern A.For this project,the target hydraulic conductivity after grouting is in the order of 10-7m/s.The result shows that the computed hydraulic conductivities at the two water-bearing zones are in the order of 10-7m/s,which means that the computed results are close to the real condition and can be acceptable to represent the hydro-geological condition around the Cavern A.

Fig.10.The hydraulic conductivity distribution along the length of the Cavern A.
5.Conclusions
In order to reduce the risk associated with the groundwater seepage,reliable hydro-geological model should be established based on the in situ investigation data.The key challenging issue is how to integrate limited geological and hydro-geological data to determine the hydraulic conductivity of the fractured rock masses. For this project,different data are collected at different stages:site investigation stage,construction stage,and post-construction stage.This paper proposes suitable models and methods to determine the hydraulic conductivity at speci f c locations based on monitored data.The semi-analytical method for anisotropic permeability estimation provides background knowledge for site measurement based estimation models in Sections 3 and 4.At this stage,only the data of water pressure and water f ow rate areutilized.We will add the fracture orientation information in our further study to capture the anisotropic characteristics.
When the hydraulic conductivities are known at some speci f c locations,determination of hydraulic conductivities at other locations is another challenging issue,because the fractured rock masses are heterogenous media.The arti f cial neural network, which is a computational model for information processing based on the biological neural networks,can be used to determine the hydraulic conductivities at other locations(Sun et al.,2011).Based on the obtained hydraulic conductivity at different locations and depths,the reliable hydro-geological model can be established.At the same time,the reliability of the proposed model can be updated if more boreholes or more monitoring data are provided.
Con f ict of interest
The authors wish to con f rm that there are no known con f icts of interest associated with this publication and there has been no signi f cant f nancial support for this work that could have in f uenced its outcome.
Goodman R,Moye D,Schalkwyk A,Javendel I.Ground-water in f ow during tunnel driving.Engineering Geology 1965;2(2):39-56.
Hatton CG,Main IG,Meredith PG.Non-universal scaling of fracture length and opening displacement.Nature 1994;367:160-2.
Kiyoyama S.The present state of underground crude oil storage technology in Japan.Tunnelling and Underground Space Technology 1990;5(4):343-9.
Lei S.An analytical solution for steady f ow into a tunnel.Ground Water 1999;37(1): 23-6.
Oda M,Hatsuyama Y,Ohnishi Y.Numerical experiments on permeability tensor and its application to jointed granite at Stripa Mine,Sweden.Journal of Geophysical Research 1987;92(8):8037-48.
Oda M.An equivalent continuum model for coupled stress and f uid f ow analysis in jointed rock masses.Water Resources Research 1986;22(13):1845-56.
Oda M.Permeability tensor for discontinuous rock masses.Geotechnique 1985;35(4):483-95.
Spane FA,Wurstner SK.DERIV:a computer program for calculating pressure derivatives for use in hydraulic test analysis.Ground Water 1993;31(5):814-22.
Sun JP,Zhao ZY,Zhang Y.Determination of three-dimensional hydraulic conductivities using a combined analytical/neural network model.Tunnelling and Underground Space Technology 2011;26(2):310-9.
Sun JP,Zhao ZY.Effects of anisotropic permeability of fractured rock masses on underground oil storage caverns.Tunnelling and Underground Space Technology 2010;25(5):629-37.
Zhang WG,Goh ATC.Reliability assessment on ultimate and serviceability limit states and determination of critical factor of safety for underground rock caverns.Tunnelling and Underground Space Technology 2012;32:221-30.
Chakrabarty C,Enachescu C.Using the deconvolution approach for slug test analysis:theory and application.Ground Water 1997;35(5):797-806.
Cheng YJ.Inherent and stress-dependent anisotropy of permeability for jointed rock masses.MS Thesis.Taiwan,China:National Central University;2006.
Dershowitz WS,Einstein HH.Characterizing rock joint geometry with joint system models.Rock Mechanics and Rock Engineering 1988;21(1):21-51.
El Tani M.Circular tunnel in a semi-in f nite aquifer.Tunnelling and Underground Space Technology 2003;18(1):49-55.
El Tani M.Water in f ow into tunnels.In:Proceedings of the World Tunnel Congress ITA-AITES 1999,Oslo.Rotterdam,Netherlands:A.A.Balkema;1999.p.61-70.
Fernandez G.Behavior of pressure tunnels and guidelines for liner design.Journal of Geotechnical Engineering 1994;120(10):1768-91.

Zhipeng Xuobtained a M.Sc.degree from China Coal Research Institute,Beijing.He is research associate of Geotechnical Engineering at the Nanyang Center for Underground Space in Nanyang Technological University, Singapore.He has been involved in geotechnical&engineering geology research,especially in grouting materials, grouting model based test,and grouting design.He is a member of International Society for Rock Mechanics (ISRM)and The International Association of Engineering Geology and the Environment(IAEG),as well as Chinese Society for Rock Mechanics and Engineering(CSRME)and The Society for Rock Mechanics&Engineering Geology (Singapore)(SRMEG).
*Corresponding author.Tel.:+65 65927875.
E-mail address:ZPXu@ntu.edu.sg(Z.Xu).
Peer review under responsibility of Institute of Rock and Soil Mechanics,Chinese Academy of Sciences.
1674-7755©2015 Institute of Rock and Soil Mechanics,Chinese Academy of Sciences.Production and hosting by Elsevier B.V.All rights reserved.
http://dx.doi.org/10.1016/j.jrmge.2014.10.006
 Journal of Rock Mechanics and Geotechnical Engineering2015年2期
- Journal of Rock Mechanics and Geotechnical Engineering的其它文章
- Laboratory study on the mechanical behaviors of an anisotropic shale rock
- Thermo-mechanical constitutive modeling of unsaturated clays based on the critical state concepts
- Monitoring result analyses of high slope of f ve-step ship lock in the Three Gorges Project
- UCIMS:Advances in geotechnical construction and performance monitoring
- Liquefaction evaluation of dam foundation soils considering overlying structure
- Improvement parameters in dynamic compaction adjacent to the slopes