A non-destructive method to measure the thermal properties of frozen soils during phase transition
Bin Zhng,Chnjun Hn,Xiong(Bill)Yu,*
aMichael Baker International,100 Airside Drive,Moon Township,PA 15108,USA
bDepartment of Civil Engineering,Case Western Reserve University,10900 Euclid Avenue,Cleveland,OH 44106,USA
A non-destructive method to measure the thermal properties of frozen soils during phase transition
Bin Zhanga,Chanjuan Hanb,Xiong(Bill)Yub,*
aMichael Baker International,100 Airside Drive,Moon Township,PA 15108,USA
bDepartment of Civil Engineering,Case Western Reserve University,10900 Euclid Avenue,Cleveland,OH 44106,USA
A R T I C L E I N F O
Article history:
Received 22 January 2015
Received in revised form
4 March 2015
Accepted 6 March 2015
Available online 20 March 2015
Frozen soil
Phase change materials
Thermal conductivity
Heat capacity
Sensor fusion
Frozen soils cover about 40%of the land surface on the earth and are responsible for the global energy balances affecting the climate.Measurement of the thermal properties of frozen soils during phase transition is important for analyzing the thermal transport process.Due to the involvement of phase transition,the thermal properties of frozen soils are rather complex.This paper introduces the uses of a multifunctional instrument that integrates time domain re f ectometry(TDR)sensor and thermal pulse technology(TPT)to measure the thermal properties of soil during phase transition.With this method, the extent of phase transition(freezing/thawing)was measured with the TDR module;and the corresponding thermal properties were measured with the TPT module.Therefore,the variation of thermal properties with the extent of freezing/thawing can be obtained.Wet soils were used to demonstrate the performance of this measurement method.The performance of individual modules was f rst validated with designed experiments.The new sensor was then used to monitor the properties of soils during freezing-thawing process,from which the freezing/thawing degree and thermal properties were simultaneously measured.The results are consistent with documented trends of thermal properties variations.
©2015 Institute of Rock and Soil Mechanics,Chinese Academy of Sciences.Production and hosting by Elsevier B.V.All rights reserved.
1.Introduction
Water is one of the most important factors determining the performance of geostructures.Excessive water accumulation behind retaining wall compromises its structural stability.Seepage through levee and earth dam can lead to piping(Drnevich et al., 2001a,b).And soil thermal properties are also of great importance for the study of soil water evaporation,pesticides volatilization,and trace gas emission from soil.In addition,under some circumstances,the heat transfer,water movement and solute transport are coupled such as in the vadose zone(Ren et al.,2003;Heitman et al., 2007).The seasonal frozen depth and duration in cold regions are of great importance for studying the biological,hydrological and mineralogical processes(Tarnawski and Wagner,1993;Civan, 2000;Zhou and Huang,2004;Lackner et al.,2005).Seasonal freezing and thawing of soil is frequently blamed for the underground water pipe damages(Takeda and Nakano,1990;Song,2006; Heitman et al.,2007).The thermal properties of the soil surface layer can also be used to determine the surface heat balance,and this surface energy balance can be further employed to predict the freezing-thawing depth of the active layer of the soil(Naidu and Singh,2004;Overduin et al.,2006;Hotz and Ge,2009).
Wet soil(soil mixed with water),by de f nition,is a phase change material system in which water acts as the phase transition component and soil solids provide the structural skeleton for the system.During the phase transition(i.e.when water crystallizes or ice melts),the thermal properties of the system(i.e.heat capacity and thermal conductivity)change together with the evolution of phase change.Measurement of thermal properties during such process will provide important input for studying and modeling the thermal transport in such material systems.
This paper demonstrates a method and tool to measure the thermal properties of phase change material system.Wet soils are used as the subject material due to its availability and de f ned phase transition temperature.A multifunctional probe that integrated the functions for time domain re f ectometry(TDR)and thermal pulse technology(TPT)measurement was fabricated for measurement.The TDR function measures the extent of phase transition(freezing or thawing).The TPT function measures the corresponding thermal conductivities and heat capacities.By integration of both measurements,the variation of the thermal properties with the extent of phase transition in soil water can bedetermined.While wet soil is used as the phase change materials system in this study,the methodology and tool can also be extended to study other phase change materials systems used for building energy ef f ciency applications.
2.Technical background
2.1.Background on time domain refectometry(TDR)
TDR is a guided radar technology that was initially used by electrical engineers to locate cable breakages.The application was extended to measure soil water content due to the pioneering work by Topp et al.(1980).In civil engineering,TDR has become an established technology for soil water content measurement (O’Connor and Dowding,1999;Benson,2006;ASTM D6565,2005; ASTM D6780,2005).TDR features the advantages of being rugged, accurate and automatic.Various applications have been explored with TDR technology such as seepage through levee and earth dam (Zhang et al.,2010),water movement and solute transport(Ren et al.,2003;Heitman et al.,2007),seasonal frost development (Tarnawski and Wagner,1993;Civan,2000;Zhou and Huang,2004; Lackner et al.,2005),soil freezing-thawing induced pipe damages (Takeda and Nakano,1990;Song,2006;Heitman et al.,2007).
The con f guration of a typical TDR system is shown in Fig.1.The system generally consists of a TDR device(including an electrical pulse generator and a sampler),a connection cable,and a measurement probe(Fig.1a).TDR works by sending a fast rising step pulse or impulse to the measurement probe and measuring the re f ections due to the change of material dielectric permittivity.Due to the large contrast between the dielectric constant of water (around 81)and those of the air(1)or soil solids(the dielectric constant for dry solids is typically 3-7),the bulk dielectric constants of soils are very sensitive to the water content.The large contrast in the dielectric properties of air and soil causes one re f ection when the electrical signal enters soil from the air; another re f ection takes place when the electrical signal arrives at the end of the measurement probe(Fig.1b).In displaying a TDR signal,the time scale,t,is typically displaced as round trip distance using Eq.(1):


Fig.1.(a)Schema of an example TDR system and output signal;(b)A typical TDR curve for soil and measurement of apparent lengthLa.
whereLais typically called apparent length,andcis the speed of the electromagnetic wave in the vacuum(3×10⁸ m/s).
From the apparent length,La,displayed on TDR signal(Fig.1b), the round trip time required for an electrical pulse to travel through the measurement probe can be determined ast=2La/c.
The velocity of the electromagnetic wave traveling in the testing material can then be calculated by

wherevis the velocity of an electromagnetic wave traveling in the material,Lis the physical length of TDR sensor section,tis the travel time between the two re f ections that occur at the interfaces of material layers.
The velocity of the electric signal is inversely proportional to the square root of dielectric constant,Ka(Ramo et al.,1994):

Combining Eqs.(2)and(3),the dielectric constant,Ka,of a material can be calculated by

The dielectric constant,Ka,measured by TDR is typically called“apparent dielectric constant”to re f ect the fact that it does not consider the frequency-dependency of the dielectric permittivity (Topp et al.,1980).
2.2.Theory of thermal pulse technology(TPT)
TPT measures the thermal properties of a material by generating a heat pulse and measuring its propagation and attenuation. Typically,a line heat pulse of short duration is generated.The thermal pulse propagates in the cylinder directions away from the line heat source(Fig.2a).This causes a radial propagating temperature disturbance which is a function of time and distance from the heat source(Fig.2b).
Data analysis for the thermal pulse technology is based on modeling the thermal diffusion process in continuous homogeneous materials.The fundamental solution for the thermal f eld distribution around an in f nite line heat source has been solved for the axial-symmetric system(de Vries,1952;Kluitenberg and Bristow,1993;Bristow et al.,1994;Kluitenberg et al.,1995).For a line heat pulse of durationt0,the temperature disturbance at radial distance,r,away from the heat source is described by

whereΔTdenotes the temperature variation(°C or F),t0is the duration of the heat pulse(s),Ei(x)is the exponential integral,αis the thermal diffusivity,andQdenotes the strength of the heat resource,which is calculated by

Fig.2.(a)Schematic of thermal pulse technology(one-dimensional heat transfer with no thermal exchange in the vertical direction);(b)Illustration of the source pulse and temperature responses.

whereqis the quality of heat release per unit length of the probe (W/m),andρcdenotes the volumetric heat capacity(J/(m3K)).
The total volumetric heat capacity of the soil system includes those of water,soil solids and air.However,the contribution of the air to the total heat capacity is negligible and is thus typically ignored for practical purpose.The total volumetric heat capacity can then be calculated as

whereρbis the bulk density of the soil,csis the speci f c heat of the soil particles(kJ/(kg K)),ρwis the density of water(kg/m3),andcwis the speci f c heat of water(kJ/(kg K))(Naidu and Singh,2004; Lackner et al.,2005).
The thermal diffusivityαin Eq.(5)can be calculated by (Kluitenberg and Bristow,1993;Bristow et al.,1994;Heitman et al., 2007)

wheretmdenotes the time when the maximum temperature changeΔTmoccurred(Fig.2b).
The heat capacity,ρc,the thermal conductivity,λ,and the thermal diffusivity,α,are related according to Eq.(9).Therefore only two of the three thermal properties are independent (Kluitenberg and Bristow,1993).

3.Sensor design and performance assessment
A thermo-TDR sensor was designed by adding thermal pulse generation and measurement functions to a conventional TDR parallel probe.The probe geometry referred to the design used in Ren et al.(1999)and Heitman et al.(2007).The rods are 40 mm in length and spaced 6 mm apart.The diameter of the probe rod is around 1 mm.This achieved an electrical impedance of around 150 ohms when exposed to the air(O’Connor and Dowding, 1999).Instead of solid rods for the traditional TDR probe,hollow steel rods were used for the thermo-TDR probes.A resistance heater was embedded inside the central rod to generate the heat pulse.Three thermocouples were installed in each rod respectively.The tubes were then back f lled with high thermal conductive epoxy.Fig.3a shows the schematic of the sensor probe design.Fig.3b shows the prototype of the fabricated thermo-TDR sensor.
3.1.Experimental evaluation of the TDR function
The performance of the TDR function by the thermo-TDR probe was f rst evaluated by making measurements in the American Society for Testing Materials(ASTM)standard f ne sand and a clayey glacial till.The glacial till was classi f ed as clay with low plasticity(CL)by uni f ed soil classi f cation system(USCS).In the experiments,the thermo-TDR probes were installed in soil samples prepared with different water contents and densities.TDR signals were acquired for each sample.The measured signals are plotted in Fig.4.For both sand and clay samples,the TDR signals show systematic trends of change with increasing water content. This indicates the TDR function is sensitive to the change of the soil water content.

Fig.3.(a)Schematic design of the thermal-TDR probe;(b)Photos of the fabricated thermo-TDR probe.

Fig.4.In f uence of water contents on TDR signals measured by the thermo-TDR probe: (a)sand and(b)clay.
3.2.Experimental evaluation of the TPT function
The evaluation of the thermo-TDR sensor design involved assessment of the thermocouples and the heat pulse generation function.
A mercury thermometer was employed as the reference base to evaluate the performance of the thermocouples installed inside the thermo-TDR rods.For this purpose,both the thermometer and thermo-TDR probe were simultaneously placed in a container with water of different temperatures.The thermocouples were read by an eight-channel USB-based data sampling unit TC-08@by Pico Technology Inc.The mercury thermometer was read manually.The results indicated that there are excellent relationship between thermal couple reading and thermometer.This indicated the thermocouples were properly installed.
The thermal pulse function of the thermo-TDR sensor was evaluated subsequently.The thermo-TDR sensor was installed vertically into the center of the soil specimen.A 9-V battery was used to power the heater installed in the center rod.The duration of the heat pulse was controlled by a switch.The generated heat pulse and received heat pulse were both measured by the built-in thermocouples installed inside the rods.Fig.5 shows the typical measured propagating heat pulse,indicating that the thermal pulse module works properly.The thermal responses under various heat pulse durations were also evaluated,from which an optimal duration of heat pulse was determined and used in all the subsequent testing.
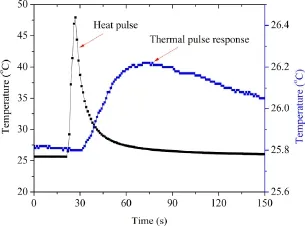
Fig.5.An example of measured thermal pulse response in clay.
4.Method of signal analyses
4.1.Method for TDR signal analyses and data processing
Two approaches are commonly used to determine the apparent dielectric constant,Ka,from a TDR signal(Timlin and Pachepsky, 1996),i.e.(1)empirical tangent line method;and(2)inversion analysis of the TDR signals.
The tangent line method generally follows the approach by Topp et al.(1980,1982)and Baker and Allmaras(1990).This method locates the re f ection points using the tangent lines,i.e.slopes,from characteristic sections(“peak”,“valley”or maximum slope)on the TDR signal.Both of these approaches require drawing tangent lines from characteristic sections of the TDR signal to locate the re f ection points.The only difference between them is the criterion ofselecting these characteristic points.The procedures can be implemented by developing the computer algorithms.This typically involves smoothing the process of the TDR signal,and using numerical differentiation to calculate the derivatives and f nd the locations of the characteristic points,such as local maximum or minimum points with maximum slopes.The intersections are then determined from the tangentlines passing through the characteristic points(Yu,2003).
The TDR signal can also be analyzed using inversion model.In this method,the measured TDR signal is employed to match the signal predicted using the given material properties.The analysis can be conducted in either the time domain(Yanuka et al.,1988; Timlin and Pachepsky,1996)or the frequency domain(Feng et al., 1999;Lin,1999;Yu and Yu,2006).The advantage of this approach is that it physically described the phenomena taking place in the TDR system.The shortcomings are the longer computational time and the issue of non-uniqueness(Yu and Yu,2006).
For the most practical applications,the empirical analyses of the TDR signals were found to provide reasonable accuracy.This procedure was used in this study to analyze the TDR signals to determine the dielectric properties.
4.2.Method for analyses of thermal pulse signals
The thermal pulse signals can also be analyzed with two different approaches,i.e.(1)travel time analyses and(2)modelbased inversion analyses.Travel time analyses of the thermo-TDR signal involves the determination the maximum amplitude of thermal pulse responseTmaxand the corresponding travel timet0. Both of them can be easily obtained from the measured thermal pulse response curves.The thermal diffusivity,heat capacity and thermal conductivity can then be calculated using Eqs.(5)-(9).
Model-based inversion analysis is by matching the measured thermal response waveform with theoretical thermal pulsepropagation model described by Eqs.(5)-(9).Mathematically,the inversion analyses can be described as

where function argmin is to determine the parameters that minimize the value of the target function;ΔT(r,t,α,ρc)predictis the predicted temperature at a distancerfromthe heat source,which is described by Eqs.(5)-(9);ΔT(r,t,α,ρc)measureis the actually measured temperature;the function|·|is the norm of a vector, which is typically used as the root-mean-square.
In this study,a MATLAB code was developed to implement the inversion procedure.A forward model was f rst developed to predict the temperature process caused by a rapid heat pulse.This involved the convolution of the responses from the in f nite heat pulse source and the temperature measured at the center rod,i.e.

whereΔT(r,t)is the temperature variation described by Eq.(5),⊗is the convolution,andT(0,t)is the temperature process measured at the center rod.
A sensitivity analysis for the model parameters was f rst carried out using the forward model,such as the thermal conductivity of soil and the spacing of the thermo-TDR rods.Fig.6 shows the results of the sensitivity analysis.In this f gure,the thick blue curve was the source heat pulse.The other curves were the response heat pulses measured at a certain distance away from the heat source. Fig.6 shows that higher thermal diffusivity results in sharper response heat pulse.Similar observations were found on the effects of spacing between the rods.
Inversion analyses were implemented using the Simplex method,which is a standard algorithm for the large-scale linear optimizations.To ensure the stable results,initial values of parameters were set using the results from the travel time analyses.
5.Measurement of thermal properties of soils during phase transition
5.1.Experimental design
Laboratory experiments were conducted to assess the ability of thermo-TDR probe to measure the thermal properties of soils during the phase transition process.The glacial till(CL soil)was used for the study.The clay specimens were prepared at a water content of 15%using standard Harvard miniature compactor. Thermo-TDR probe was then installed into the specimen and sealed together with the specimen in a vacuum bag.The specimen was then placed in a freezing-thawing cycle in a temperaturecontrolled room.The temperatures inside the soils were recorded by the built-in thermal couples inside the thermal-TDR probe.One additional temperature sensor recorded the environmental temperature inside the temperature-controlled room.
TDR signals were automatically recorded during the freezingthawing process by the computer at 3 min interval.TPT measurements were conducted during the course of freezing-thawing. Both the TDR and TPT data were subsequently analyzed.
5.2.Experimental data and analysis
Examples of measured TDR signals during the freezing process are shown in Fig.7a.The signals show a consistent overall trend,i.e. the continuous reduction in the apparent length,which is the distance between the f rst and second re f ections(refer to Fig.1b for the de f nition of apparent length).This corresponds to continuous decrease of the apparent dielectric constant(according to Eq.(4)). Fig.8 shows the evolution of the TDR measured apparent dielectric constant and electrical conductivity of soil with temperature.As seen from this f gure,both the apparent dielectric constant and electrical conductivity decrease as temperature decreases.This is because the free water turned into ice during the freezing process, and ice has a much smaller dielectric constant than the liquid water.Crystallization of water also reduces the ionic mobility which results in the reduction of the electrical conductivity.
Siddiqui and Drnevich(1995)developed an equation(Eq.(12)) that related TDR measured apparent dielectric constant to free water content,w.This equation accounts for the effects of soil type and density by incorporating two calibration constants(Drnevich et al.,2001a,b).


Fig.6.Sensitivity analysis of thermal responses to(a)the thermal diffusivities(α);and (b)rod to rod distance.
whereρdis the dry density of soil;aandbare soil-dependent calibration constants,typicallyais found to be close to 1,bis found to range from 7 to 11(Yu and Drnevich,2004).
It needs to point out that ice has a dielectric constant similar to that of solids(around 4),which is much smaller than that of liquid water(around 81).Therefore,the water content in Eq.(12)onlyde f nes the amount offree liquid water in soils.By use of Eq.(12),the amount of unfrozen liquid water in soil can be calculated.From this, the degree of freezing/thawing can be determined with a procedure described in Yu et al.(2011).Fig.9 plots the measured degree of freezing of the soil sample when subjected to freezing process.The internal soil temperature is also plotted as reference.It can be seen that it takes around 36 min for the soil temperature to drop to the freezing temperature.After that soil water continues to freeze.
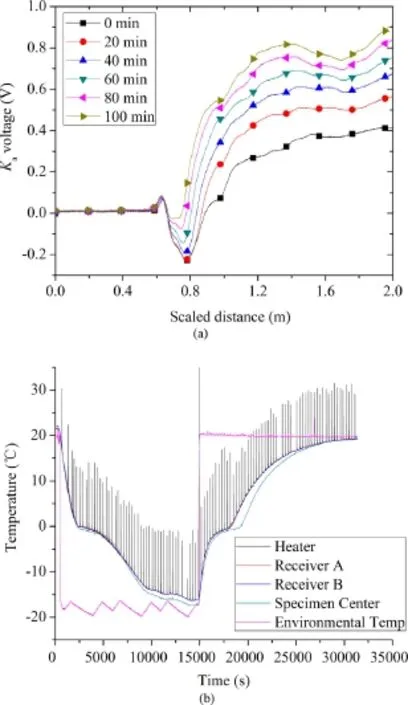
Fig.7.(a)Example of TDR signals during freezing process;(b)Thermal pulse measurement during the freezing-thawing process(each sharp spike in the temperature curve corresponds to one TPT measurement).

Fig.8.Dielectric constant(Ka)and electric conductivity(Ecb)during the thawing process.
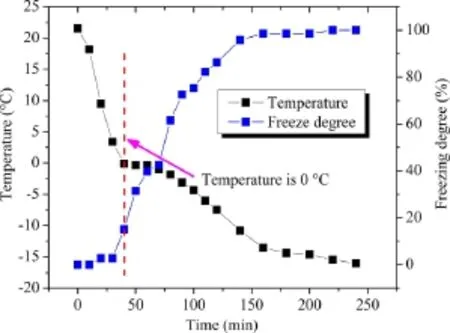
Fig.9.The variation of temperature and freezing degree during the freezing process.
Fig.10 plots the variation of the degree of freezing with temperature.It can be seen that freeze started at temperature of around 0°C,the normal freezing temperature of water.The soil temperature remains at the freezing temperature of 0°C until the freezing degree reaches around 60%.The freezing degree increased during the freezing process,and it became constant when the temperature dropped to around-15°C.This phenomenon indicates that the freezing temperature of certain portion of soil water is below the normal freezing temperature.This is called“freezing point depression”,which is attributed to the effects of matric suctions developed in porous materials(Coussy,2005).
The signals by TPT were analyzed to determine the thermal conductivity and volumetric capacity of soil during freezing process.The results of thermal properties at different temperatures are shown in Fig.11a.Similar trends of variations with temperature are observed for both thermal conductivity and heat capacity.Starting from low temperature(-18°C in this study)the thermal conductivity continues to increases until around 0°C(normal phase transition temperature of water).There is a sharp drop of the thermal conductivity(around 2.5 times)until the phase transition completes(or all the ice turns into water).After that,the thermal conductivity of soil remains as an approximately constant.
Similar trends can be observed in the volumetric heat capacity in Fig.11b,i.e.below the freezing temperature of 0°C,the volumetric heat capacity increases with temperature.There is also a sharp drop(around 4 times)in the thermal capacity until the phase transition completes.After that,the heat capacity remains as approximately constant.These observed trends of thermal conductivity variation with temperature are consistent with thosedocumented in previous study(i.e.Penner,1970).With the sensor fusion strategy undertook in this paper,information on the extent of phase transition(freezing degree in the case of soil)was simultaneously measured.This could provide an important piece of information to understand the interactions within phase changing porous materials and their effects on the bulk thermal properties.
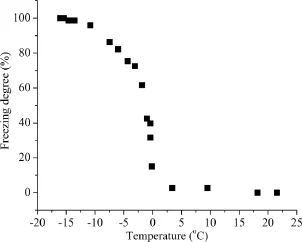
Fig.10.Variation of freezing degree with temperature.
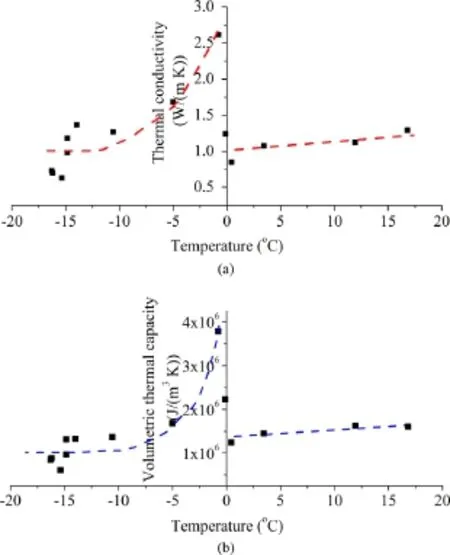
Fig.11.(a)Variation of thermal conductivity with temperature;(b)Variation of volumetric capacity with temperature.
6.Conclusions
This paper demonstrates a procedure and tool to measure the thermal properties of frozen soils during phase transition.A multifunctional measurement probe,which integrates the TPT and TDR function,was designed.The TDR module provides data to characterize the extent of phase transition(freezing/thawing).The TPT module measures the corresponding thermal properties.The performance of different sensing modules was f rst evaluated to ensure they function properly.The new sensor was then used to monitor soils during freezing-thawing process,from which the freezing/thawing degree and thermal properties were simultaneously measured.The results are consistent with documented trends of thermal properties variations.While soils were used in this study,the methodology of measurement can be readily extended to other types of materials to measure the variations of thermal properties during the phase transition process.
Con f ict of interest
The authors wish to con f rm that there are no known con f icts of interest associated with this publication and there has been no signi f cant f nancial support for this work that could have in f uenced its outcome.
ASTM D6565.Test method for determination of water(moisture)content of soil by the time-domain re f ectometry(TDR)method.West Conshohocken,PA,USA: American Society of Testing and Materials(ASTM);2005.
ASTM D6780.Measurement of the soil water content and dry density of soil by time domain re f ectometry(TDR)method.West Conshohocken,PA,USA:American Society of Testing and Materials;2005.
Baker JM,Allmaras R.System for automating and multiplexing soil moisture measurement by time-domain re f ectometry.Soil Science Society of America Journal 1990;55(1):1-6.
Benson CH.Plenary lecture:geotechnical applications of TDR.In:Proceedings of the TDR 2006.West Lafayette,USA:Purdue University;2006.Paper ID A3.
Bristow KL,Kluitenberg GJ,Horton R.Measurement of soil thermal properties with a dual-probe heat-pulse technique.Soil Science Society of America Journal 1994;58(5):1288-94.
Civan F.Unfrozen water in freezing and thawing soils:kinetics and correlation. Journal of Cold Regions Engineering 2000;14(3):146-56.
Coussy O.Poromechanics of freezing materials.Journal of Mechanics and Physics of Solids 2005;53(8):1689-718.
de Vries DA.A nonstationary method for determining thermal conductivity of soil in situ.Soil Science 1952;73(2):83-9.
Drnevich VP,Lin CP,Yi Q,Yu X,Lovell J.Real-time determination of soil type,water content and density using electromagnetics.Final Report FHWA/IN/JTRP-2000/ 20.West Lafayette,Indiana,USA:Purdue University;2001a.
Drnevich VP,Siddiqui SI,Lovell J,Yi Q.Water content and density of soil in situ by the Purdue TDR method.In:TDR 2001:innovative applications of TDR technology.Evanston,IL,USA:Northwestern University;2001b.
Feng W,Lin CP,Deschamps RJ,Drnevich VP.Theoretical model of multisection time domain re f ectometry measurement system.Water Resources Research 1999;35(8):2321-31.
Heitman JL,Horton R,Ren T,Ochsne TE.An improved approach for measurement of coupled heat and water transfer in soil cells.Soil Science Society of America Journal 2007;71(3):872-80.
Hotz RD,Ge L.Investigation of the thermal conductivity of compacted silts and its correlation to the elastic modulus.Journal of Materials in Civil Engineering 2009;22(4):408-12.
Kluitenberg GJ,Bristow KL,Das BS.Error analysis of heat pulse method for measuring soil heat capacity,diffusivity,and conductivity.Soil Science Society of America Journal 1995;59(3):719-26.
Kluitenberg GJ,Bristow KL.Error analysis of the heat pulse method for measuring soil volumetric heat capacity.Soil Science Society of America Journal 1993;57(6):1444-51.
Lackner R,Amon A,Lagger H.Arti f cial ground freezing of fully saturated soil: thermal problem.Journal of Engineering Mechanics 2005;131(2):211-20.
Lin CP.Time domain re f ectometry for soil properties.Ph.D.Thesis.West Lafayette, IN,USA:School of Civil Engineering,Purdue University;1999.
Naidu AD,Singh DN.Field probe for measuring thermal resistivity of soils.Journal of Geotechnical and Geoenvironmental Engineering 2004;130(2):213-6.
O’Connor KM,Dowding CH.Geomeasurements by pulsing TDR cables and probes. Boca Raton,USA:CRC Press;1999.
Overduin PP,Kane DL,van Loon WKP.Measuring thermal conductivity in freezing and thawing soil using the soil temperature response to heating.Cold Regions Science and Technology 2006;45(1):8-22.
Penner E.Thermal conductivity of frozen soils.Canadian Journal of Earth Sciences 1970;3(3):982-7.
Ramo S,Whinnery JR,Van Duzer T.Fields and waves in communications electronics.3rd ed.New York,USA:John Wiley and Sons;1994.
Ren T,Noborio K,Horton R.Measuring soil water content,electrical conductivity, and thermal properties with a thermo-time domain re f ectometry probe.Soil Science Society of America Journal 1999;63(3):450-7.
Ren T,Ochsner TE,Horton R.Development of thermo-time domain re f ectometry for vadose zone measurements.Vadose Zone Journal 2003;2(4):544-51.
Siddiqui SI,Drnevich VP.A new method of measuring density and moisture content of soil using the technique of time domain re f ectometry.Report No.FHWA/IN/ JTRP-95/9.Joint Transportation Research Program,Indiana Department of Transportation,Purdue University;1995.
Song WK.Thermal transfer analysis of a freezing soil medium with an embedded pipeline.Journal of Cold Regions Engineering 2006;20(1):20-36.
Takeda K,Nakano Y.Quasi-steady problems in freezing soils:II.Experiment on the steady growth of an ice layer.Cold Regions Science and Technology 1990;18(3): 225-47.
Tarnawski VR,Wagner B.Modeling the thermal conductivity of frozen soils.Cold Regions Science and Technology 1993;22(1):19-31.
Timlin DJ,Pachepsky YA.Comparison of three methods to obtain the apparent dielectric constant from time domain re f ectometry wave traces.Soil Science Society of America Journal 1996;60(4):970-7.
Topp GC,Davis JL,Annan AP.Electromagnetic determination of soil water content and electrical conductivity measurement using time domain re f ectometry. Water Resources Research 1980;16(3):574-82.
Topp GC,Davis JL,Annan AP.Electromagnetic determination of soil water content using TDR:II.Evaluation of installation and con f guration of parallel transmission lines.Soil Science Society of America Journal 1982;46(4): 678-84.
Yanuka M,Topp GC,Zegelin S,Zebchuk WD.Multiple re f ection and attenuation of time-domain re f ectometry pulses:theoretical considerations for application to soil and water.Water Resources Research 1988;24(7):939-44.
Yu X,Drnevich VP.Soil water content and dry density by time domain re f ectometry.Journal of Geotechnical and Geoenvironmental Engineering 2004;130(9): 922-34.
Yu X.In f uence of soil properties and environmental conditions on the propagation of EM waves in soils.Ph.D.Thesis.West Lafayette,IN,USA:School of Civil Engineering,Purdue University;2003.
Yu XB,Liu Y,Gonzalez J,Yu X.New instrument assisted study on the effect of freezethaw on the mechanical behaviors of soils.International Journal of Pavement Engineering 2011;13(6):523-34.
Yu XB,Yu X.Time domain re f ectometry tests of multilayered soils.In:Proceedings of TDR 2006.West Lafayette,USA:Purdue University;2006.
Zhang B,Yu XB,Yu X.Design and simulation of a distributed moisture sensor.Smart Materials and Structures 2010;6(9):1007-23.
Zhou W,Huang SL.Modeling impacts of thaw lakes to ground thermal regime in northern Alaska.Journal of Cold Regions Engineering 2004;18(2):70-87.

Dr.Xiong Yuis working as an associate professor at Case Western Reserve University,USA.His research interests cover geotechnical and infrastructure engineering,environmental geotechnology,foundation engineering, nondestructive testing,sensor technology for infrastructure,environment and energy applications,multi-scale mo d el o f civil eng ine ering mate rial and system, computer-aided design,green design,sustainable engineering,etc.
*Corresponding author.Tel.:+1 216 368 6247.
E-mail address:xiong.yu@case.edu(X.(Bill)Yu).
Peer review under responsibility of Institute of Rock and Soil Mechanics,Chinese Academy of Sciences.
1674-7755©2015 Institute of Rock and Soil Mechanics,Chinese Academy of Sciences.Production and hosting by Elsevier B.V.All rights reserved.
http://dx.doi.org/10.1016/j.jrmge.2015.03.005
 Journal of Rock Mechanics and Geotechnical Engineering2015年2期
- Journal of Rock Mechanics and Geotechnical Engineering的其它文章
- Laboratory study on the mechanical behaviors of an anisotropic shale rock
- Thermo-mechanical constitutive modeling of unsaturated clays based on the critical state concepts
- Monitoring result analyses of high slope of f ve-step ship lock in the Three Gorges Project
- UCIMS:Advances in geotechnical construction and performance monitoring
- Liquefaction evaluation of dam foundation soils considering overlying structure
- Improvement parameters in dynamic compaction adjacent to the slopes
