Deposited sediment settlement and consolidation mechanisms
Shui-jie Guo*,Fu-hi Zhng,Xu-guo Song,Bo-tin Wng
aThe Third Railway Survey and Design Institute Group Corporation,Tianjin 300251,PR China
bSchool of Civil Engineering,Southwest Jiaotong University,Chengdu 610031,PR China
cGeotechnical Research Institute,Hohai University,Nanjing 210098,PR China
Deposited sediment settlement and consolidation mechanisms
Shuai-jie Guoa,b,*,Fu-hai Zhangc,Xu-guo Songa,Bao-tian Wangc
aThe Third Railway Survey and Design Institute Group Corporation,Tianjin 300251,PR China
bSchool of Civil Engineering,Southwest Jiaotong University,Chengdu 610031,PR China
cGeotechnical Research Institute,Hohai University,Nanjing 210098,PR China
In order to study deposited sediment settlement and consolidation mechanisms,sediment settlement experiments were conducted using a settlement column.Based on the experimental results,sediment settlement stage defnition,excessive pore pressure(EPP)dissipation,and consolidation constitutive equations are discussed.Three stages,including the free settlement,hindered settlement,and self-weight consolidation settlement stages,are defned.The results of this study show that sediment settlement is mainly affected by the initial sediment concentration and initial settlement height,and the interface settlement rate is linearly attenuated with time on bilogarithmic scales during the hindered settlement and self-weight consolidation settlement stages.Moreover,the deposited sediment layer in the self-weight consolidation settlement stage experiences large strains,and the settlement amount in this stage is about 32%to 59%of the initial height of deposited sediment.EPP is nonlinearly distributed in the settlement direction,and consolidation settlement is faster than EPP dissipation in the self-weight consolidation settlement stage.Consolidation constitutive equations for the hydraulic conductivity and effective stress,applicable to large-strain consolidation calculation,were also determined and ftted in the power function form. ©2015 Hohai University.Production and hosting by Elsevier B.V.This is an open access article under the CC BY-NC-ND license(http:// creativecommons.org/licenses/by-nc-nd/4.0/).
Sediment settlement experiment;Deposited sediment;Self-weight consolidation;Large-strain consolidation;Interface settlement rate;Consolidation constitutive equation
1.Introduction
Sediment deposition induced by sediment particle settlementand consolidation occursfrequently in portand waterway engineering.Deposited sediment generally has a high void ratio,high compressibility,and high moisture content,and cannot be directly used in engineering(Bryant et al., 1975;Carrier et al.,1983;Merckelbach,2000).Long-term sediment deposition has caused serious hydraulic problems, such as port and river deposition,which has hindered thedevelopment of waterway transport and the normal operation of basic water conservancy facilities.In addition,potential land space expansion in coastal cities is urgent for future development,and the hydraulic fll method is considered the most effective way(Xu et al.,2012;Imai,1980).Therefore, deposited sediment settlement and consolidation mechanisms require further systematic research and understanding.
Numerous basic studies have been conducted of high moisture-content sediment settlement(Imai,1980,1981;Zhan et al.,2008),and have mainly focused on the defnition of different settlement stages according to the effective stress development and excessive pore pressure(EPP)dissipation processes.There are two sediment states during the settlement process:the suspension fuid and softly plastic solid states.In the suspension fuid state,no effective stress exists between sediment particles or focs(Pane and Schiffman,1985;Abu-Hejleh et al.,1996);this is defned as the initial freesettlement stage with a constant interface settlement rate.In the softly plastic solid state,effective stresses appear and are transferred between focs,and the interface settlement rate is attenuated with time;this is defned as the hindered settlement stage.With settlement going on,effective stresses are transferred between sediment particles,leading to the weight consolidation settlement stage(Been and Sills,1981).The main factors in settlement stage defnition are the critical values for different stages,and the critical moisture content or void ratio is usually chosen as a quantitative indicator in current research.Monte and Krizek(1976)frst proposed the concept of zero effective stress status,in which the void ratio is defned as the initial void ratio.The concept of zero stress status has been generally accepted by many scholars as a criterion for defnition of the initial free settlement stage (Michaels and Bolger,1962;Carrier et al.,1983;Merckelbach, 2000;Imai,1980).However,the initial void ratio for different sediments is still diffcult to determine,and it is affected by many factors,such as the initial sediment concentration,initial settlement height,and particle grain size.
According toMichaels and Bolger(1962)and Ma and Pierre (1998),single foc structures formed by clay particle focculation occur in the initial free settlement stage,and the suspended sediment interface appears as the sediment concentration reaches a certain limit.Subsequently,single particles and foc structures settle at different rates,and the deposited sediment layeralsoappearsatthesametime.Theconsolidationprocessof deposited sediment is induced by the self-weight load,and the nonlinear consolidation constitutive equation should be applied in consolidation calculation(Gibson et al.,1981).
Inthisstudy,aseriesofsedimentsettlementexperimentswas carried out under different initial conditions to obtain a better understanding of the settlement process of high moisturecontent deposited sediment. The sediment settlement behaviors and factors were studied,the relationship between EPP dissipation and self-weight consolidation under large nonlinear strains was investigated,and,fnally,the consolidation constitutive equations for the hydraulic conductivity and effective stress,applicable to large-strain consolidation calculation,were determined in the power function form as well.
2.Sediment settlement experiments
2.1.Physical properties and experimental program
Deposited sediment for laboratory settlement experiments was sampled from Shenzhen Bay,near the Pearl River Estuary and South China Sea,as part of theRegulation Project of Shenzhen River and Bayprogram.
The sediment samples were in the fuid state with the initial moisture content of 66.3%.Results of experiments on basic physical properties showed that the density was 1.61 g/cm3, and the specifc gravity was 2.69.Moreover,the liquid and plastic limits were ωL=48.2%and ωP=28.8%,respectively.
In the organic content test,the burning method was applied, and the measured organic content in the sediment samples was 7.9%,which was higher than the standard value of 5%,so the deposited sediment from Shenzhen Bay had a high organic content,mainly induced by shellfsh debris.According to the relative location of deposited sediment to the A-line equation of ωP=0.73(ωL-20)on Casagrande's plasticity chart,it could be defned as high-liquid limit organic silt soil(MHO)(Qian and Yin,1996).
During the sediment settlement experiment,a settlement column made of PMMA was used,as shown in Fig.1.An improvement of the settlement column system was the pore pressuremeasurementportsontheoutsidewallofthecolumnin the settlement direction.Moreover,in order to obtain the greatest pore pressure with higher accuracy,a coarse sand layer and geotextile flter were set at the bottom of the column,as shown in Fig.1(a).Each port was fxed with an inner geotextile flter and could be connected to tubes or piezometers for pore water observation in the settlement direction(Imai,1980).This was to avoid clogging of the pore pressure port during the consolidation process.The pore pressure observation accuracy of tubes after calibration was expected to be 0.5 mm of water head,which was equivalent to a pore pressure of about 5 Pa.
In order to determine the self-weight load of deposited sediment in the settlement direction,it was necessary to take the sediment samples out of the settlement column for the moisture test.However,it would have been diffcult to extract the sediment samples from the settlement column if it was too high.Thus,in this study,the high column was segmented into several continuous parts,as shown in Fig.1(b),and the connected parts were encircled with PMMA rings and sealing tape to prevent water leakage.During the experiment,the upper PMMA parts were removed one by one,and the undisturbed or disturbed sediment samples could be extracted layer by layer for basic physical parameter tests.
During the sediment settlement experiments,six groups of suspended sediment,S1 through S6,were prepared at different initial sediment concentrations and settlement heights,as listed in Table 1.The initial sediment concentration(defned as the dry sediment weight per liter)of the six groups varied from 75 to 400 g/L,and the initial settlement heights of S1 through S4 were close to 0.980 m,while the values of S5 and S6 were close to 0.360 m.The settlement was expected to take one year or even longer to reach the fnal stable status.However,the actual duration of the settlement experiments in this study was about 120 days.
2.2.Settlement curves and settlement rate attenuation curves
According to the sediment settlement experiment,settlement curves for the six groups of sediment on bilogarithmic scales are shown in Fig.2(a).The interface settlement rate can be obtained according to Eq.(1):

wherevis the interface settlement rate(m/s),Δtis the time interval(s),and Δhis the settlement amount(m)during Δt.
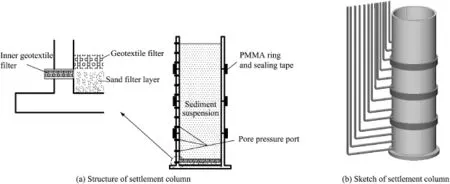
Fig.1.Settlement experiment equipment.
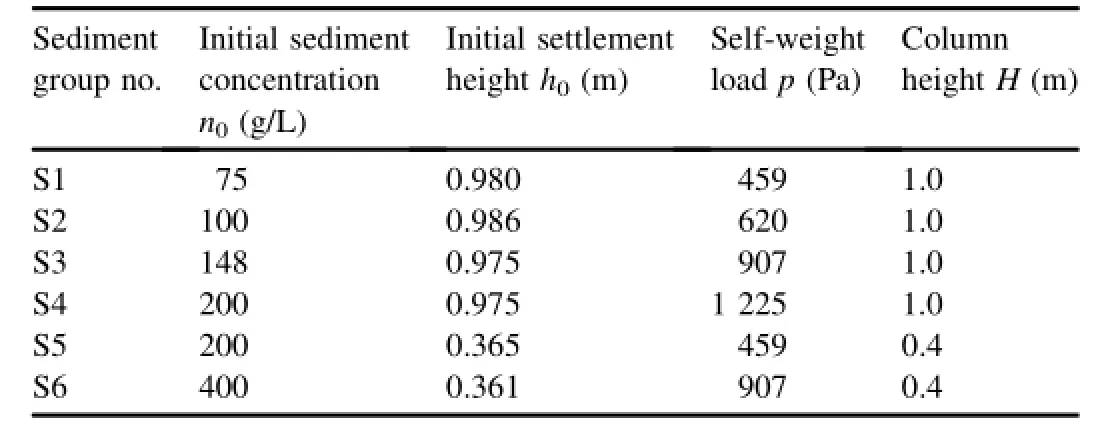
Table 1 Initial parameters of six groups of suspended sediment.
Settlement rate attenuation curves for the six groups of sediment on bilogarithmic scales are shown in Fig.2(b).
Fig.2(a)shows that the settlement curves of all the sediment samples,except the S6 sediment group,demonstrate obviously staged characteristics,wherehis the settlement height.Fig.2(b)shows that the interface settlement rate of the sediment groups S1 through S5 remains constant in the initial parts of the settlement rate attenuation curves,corresponding to the initial free settlement stage.As the settlement height decreases to certain values,the interface settlement rate shows sudden decreases for different sediment groups,meaning that the interface settlement rate decreases with time during the subsequent settlement stages.
According the experimental results,the settlement process of the suspended sediment with low initial sediment concentrations can be divided into several stages,and the interface settlement rate follows different attenuation rules in different settlement stages.
3.Sediment settlement process
3.1.Settlement stage defnition
The clay content of the deposited sediment from Shenzhen Bay was 41.7%,so the focculation effect of clay particles could not be neglected,and the initial interface settlement was determined by the foc structure(Michaels and Bolger,1962;Li and Yang,2006).In addition,the sand particle content was 21.3%and would be concentrated at the column bottom because of the high settlement rate,so sand particles would hardly experience the subsequent settlement stages.
According to the sediment particle status during the settlement process,the sediment settlement can be divided into three stages:the initial free settlement,hindered settlement, and self-weight consolidation settlement stages.The sediment particle statuses are shown in Fig.3.
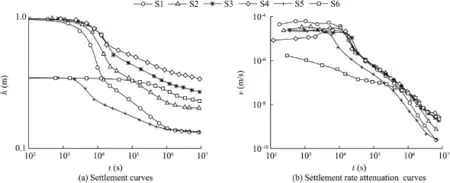
Fig.2.Results of six groups of sediment settlement experiments.
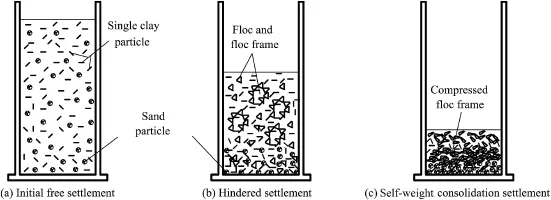
Fig.3.Sediment particle status in three settlement stages.
During the initial free settlement stage,sediment particles are completely dispersed due to different settlement rates,as shown in Fig.3(a).Then,sand particles are concentrated at the bottom with higher settlement rates,and clay particles are in the upper part.Meanwhile,clay particles overlap each other under the electrostatic force,forming simple foc structures, and the interface appears.With sediment settlement going on, the distance between foc structures keeps decreasing,and foc structures overlap each other to form spatial focculation frames,as shown in Fig.3(b),meaning that sediment settlement enters the hindered settlement stage.In this stage, effective stresses between foc structures appear and develop at a very low level,while EPP dissipates from its maximum value.Settlement curves show linear characteristics on bilogarithmic scales in this stage.Meanwhile,pore water in the middle and lower layers fows along the inner seepage channel under the hydraulic gradient,which may destroy spatial foc frames.During the self-weight consolidation settlement stage, the effective stress further develops under the self-weight load of deposited sediment,intensifying the compression of spatial foc frames,as shown in Fig.3(c).With pore water discharging from spatial foc structures,EPP further dissipates,and settlement curves also show linear characteristics on bilogarithmic scales.
It should be noted that if the initial sediment concentration exceeds a certain value,there will be no initial free settlement stage,and the sediment settlement directly enters the hindered settlement or self-weight consolidation settlement stage.This phenomenon was verifed by the settlement curve of the S6 sediment group with the initial sediment concentration of 400 g/L,as shown in Fig.2(a).In fact,the settlement curve of the S6 sediment group is almost a consolidation settlement curve under the self-weight load.
3.2.Critical values for settlement stages
In sediment settlement prediction,the most important thing is to determine the critical values for different settlement stages.Monte and Krizek(1976)frst defned the initial void ratio in the zero shear stress status.Therefore,the initial void ratio can be considered the indicator for determination of the initial free settlement stage(Zhu et al.,2009;Guo et al.,2012).
The initial void ratio is expected to be 9 to 30 for different kinds of sediment,and the relationship between the initial and liquid limit void ratios can be expressed as(Carrier et al., 1983;Xu et al.,2012)

whereefandeLare the initial and liquid limit void ratios, respectively;Gsis the specifc gravity of sediment;and the coeffcientfin Eq.(2)is 7.0 according to Carrier et al.(1983) and 8.36 according to Xu et al.(2012).
3.3.Determination of initial void ratio
There are two methods for determination of the initial void ratio:one is the settlement curve method,and the other is the suspended sediment interface location method.
(1)Settlement curve method
In theRegulation Project of Shenzhen River and Bayprogram,40 kinds of suspended sediment,with different initial sediment concentrations,were used in settlement experiments,along with a settlement column with a height of 1.0 m.The initial void ratio can be obtained by identifying the initial free settlement and hindered settlement stages in the settlement curve and settlement rate attenuation curve.Relationships between the initial and liquid limit void ratios for the 40 kinds of sediment are shown in Fig.4,which demonstrates thatfvalues are almost the same for the sediment with the same initial sediment concentration,and thatfincreases with the decrease of the initial sediment concentration.The reasons are as follows:the sediment settlement interface is the result of clay particle focculation with similar foc structure sizes,but the foc structure size is partly determined by the initial sediment concentration,which also affects the appearance of the clay particle foc structure and spatial frame structure.
(2)Suspended sediment interface location method
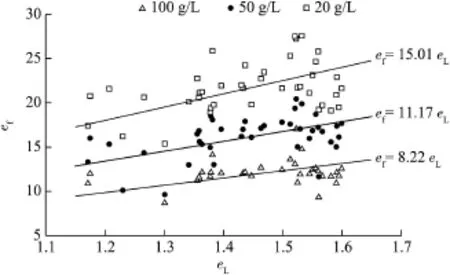
Fig.4.Relationships between initial and liquid limit void ratios for different initial sediment concentrations.
The trends of the void ratio of sediment samples at the suspended sediment interface locations are shown in Fig.5. The void ratio(e)gradually decreases in the initial free settlement stage,and then almost remains constant for a short period of time.It can be seen that sudden changing points occur in the trends of void ratio at similar settlement times for different initial sediment concentrations(points included in the circles shown in Fig.5).Thus,the void ratio at sudden changing points can be considered the initial void ratio for different initial sediment concentrations.In Fig.5,the void ratio at sudden changing points varies from 15.0 to 18.0,and the value also increases with the decrease of the initial sediment concentration.The value offis expected to be 11.6 to 13.8 according to Eq.(2),within the range offobtained by the settlement curve method shown in Fig.4.Therefore,the coeffcientfcan be generally valued asf=13.0 for the deposited sediment from Shenzhen Bay.
(3)Comparison of two methods for initial void ratio
In contrast to the initial void ratio obtained by the suspended sediment interface location method,the value determined by the settlement curve method is relatively low for the same initial sediment concentration.The main reasons are as follows:the average void ratio is obtained by the settlement curve method,while the void ratio at the suspended sediment interface is obtained by the suspended sediment interface location method.During the sediment settlement process, sediment particles with different sizes have different settlement rates.Thus,the deposited sediment layer is nonuniform, and the average void ratio is lower than the value at the suspended sediment interface.Figs.4 and 5 also show that the initial void ratio decreases with the increase of the initial sediment concentration.Thus,for determination of the initial void ratio,the infuences of the initial sediment concentration and the liquid limit properties of sediment should be considered.
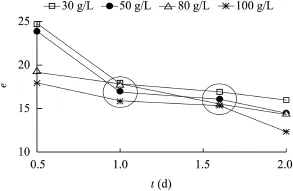
Fig.5.Trends of void ratio at suspended sediment interface for different initial sediment concentrations.
4.Consolidation settlement of deposited sediment
During the hindered settlement and self-weight consolidation settlement stages,effective stress appears and develops between foc structures.Thus,both settlement stages can be analyzed and studied with the large-strain consolidation theory(Gibson et al.,1967,1981).Based on the settlement curve as well as the EPP distribution and dissipation curve, deposited sediment consolidation mechanisms can be further understood.
4.1.Consolidation settlement curves
According to the settlement experiments of the six groups of suspended sediment listed in Table 1,the settlement height and maximum EPP in different settlement statuses are listed in Table 2.
EPP appears at the beginning of the settlement process,and the maximum value occurring at the bottom of the deposited sediment layer is almost equal to the self-weight load of deposited sediment.According to Table 2,for the suspended sediment with a relatively low initial concentration,the maximum EPP in the initial settlement status is different from that in the initial consolidation status;for the same initial settlement height,the maximum EPP in the initial settlement and consolidation statuses increases with the initial sediment concentration.After about 120 days of settlement and consolidation,EPPs for different sediment groups dissipate to very low levels,less than 12%of the initial maximum values, showing the end of the self-weight consolidation settlement stage.

Table 2 Settlement height and maximum EPP in different settlement statuses.
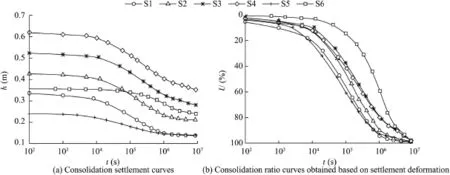
Fig.6.Results of sediment self-weight consolidation settlement.
From the sediment settlement experiments,the consolidation settlement curves excluding the initial free settlement stage and the consolidation ratio curves based on consolidation settlement deformation,with the ratioUdetermined by the consolidation settlement at different times divided by the fnal settlement amount,can be obtained,as shown in Fig.6.
The consolidation settlement curves in Fig.6(a)are in the S style,consistent with the soil consolidation process.The consolidation settlement amounts are expected to be 32%to 59%of the settlement height in the initial consolidation status, and can be classifed as large-strain consolidation.According to the consolidation ratio curves in Fig.6(b),the S6 sediment group with the initial sediment concentration of 400 g/L and initial settlement height of 0.361 m shows the lowest consolidation rate.Meanwhile,the S5 sediment group,with the initial sediment concentration of 200 g/L and initial settlement height of 0.365 m,shows the highest consolidation rate.The results suggest that the consolidation settlement process is affected by the initial sediment concentration and initial settlement height simultaneously.For the same initial settlement height,the sediment consolidation process with a lower initial sediment concentration is faster than that with a higher initial sediment concentration,while for the same initial sediment concentration,the consolidation ratio decreases and the consolidation process slows with the increase of the initial settlement height.
4.2.EPP distribution in deposited sediment layer
Deposited sediment is fully saturated during the consolidation process,and the effective stress principle can be applied to analyzing EPP dissipation and effective stress development. In the initial free settlement stage,sediment particles and foc structures settle separately with zero effective stress,and EPP has the maximum value and dissipates with pore water seepage as well as stress-induced deformation(Koppula and Morgenstern,1982;E et al.,2009).
EPP distribution and its dissipation process can be recorded by the pore pressure tubes on the outside wall of the settlement column.Fig.7 shows EPP distributions of the S4 and S6 sediment groups during the settlement and consolidation process.By calculating the average EPP in the deposited sediment layer with Eq.(3),the average EPP dissipation curves and consolidation ratio curves based on EPP dissipation for different sediment groups are shown in Fig.8 and Fig.9, respectively.
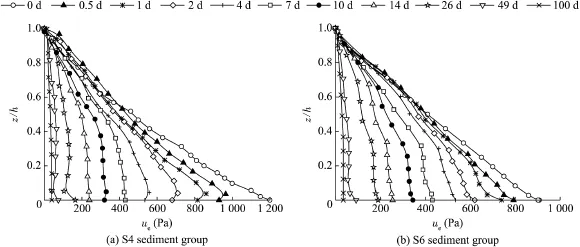
Fig.7.EPP distributions for different sediment groups.
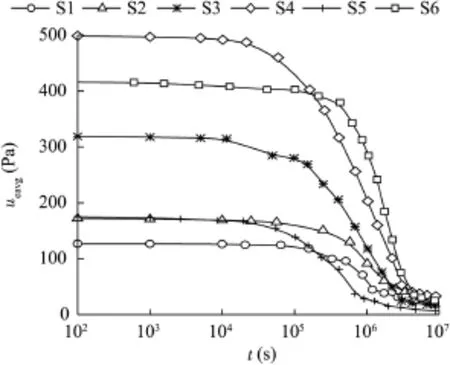
Fig.8.Average EPP dissipation curves.

whereueavgis the average EPP(Pa),ueis the EPP at a certain height(Pa),andzis the vertical coordinate in the anti-gravity direction(m).
Fig.7 shows that the EPP in the initial free settlement stage is almost linearly distributed in the settlement direction,but all the measured EPPs are lower than the theoretical ones.The main reasons are the nonuniformity of the suspended sediment and the hysteretic measurement by the pore water tubes. Moreover,in the self-weight consolidation settlement stage, EPP distribution shows nonlinear characteristics,and the EPP dissipation rate decreases with the increase of the initial sediment concentration.
Comparison of the consolidation ratio curves determined by deposited sediment settlement deformation(Fig.6(b))and EPP dissipation(Fig.9)shows that two consolidation ratio curves have large differences.The relationship between consolidation settlement deformation and EPP dissipation will be discussed in the following section.
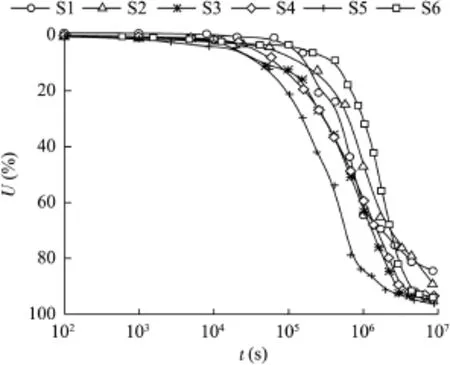
Fig.9.Consolidation ratio curves obtained based on average EPP dissipation.
4.3.Consolidation settlement analysis
For further analysis of consolidation settlement,the consolidation ratio curves for the S3 and S6 sediment groups based on consolidation settlement deformation,average EPP dissipation, and maximum EPP dissipation are given in Fig.10.Fig.10(a) shows that the consolidation ratio curves for the S3 sediment group determined by average and maximum EPP dissipations are coincident with one another,and the average and maximum EPPs have the same dissipation rate.However,the consolidation ratio curves for the S6 sediment group determined by average and maximum EPP dissipations are different from one another,with a maximum difference of 10%,as shown in Fig.10(b).Practically,although the maximum difference reaches 10%,the consolidation processes based on average and maximum EPP dissipations can still be considered to follow the similar development rules with the same consolidation rate. Although,a series of pore pressure tubes was set on the outside wall to record the real-time EPP distribution in this study,the inner geotextile flter in pore pressure ports can be clogged by clay particles,which might change the internal boundary conditions of the settlement column and further affect EPP dissipation and the measurement accuracy.Based on the analysis shown in Fig.10(b),it is reasonable to set one pore pressure tube at the settlement column bottom to record the maximum EPP,and then the deposited sediment layer consolidation ratio can be determined by maximum EPP dissipation.
The comparison of consolidation ratio curves determined by settlement deformation and EPP dissipation shown in Fig.10 demonstrates that deposited sediment consolidation settlement is faster than EPP dissipation,and the maximum difference between the consolidation ratios determined by settlement deformation and EPP dissipation at the same time is about 30%.For the actual soft soil foundation reinforcement by the preloading method,prediction of the soft soil foundation settlement only based on EPP dissipation may lead to errors,which cannot be neglected,because the foundation consolidation settlement may have reached the fnal stable state at a high consolidation rate.Thus,settlement deformation and EPP dissipation should both be considered in the prediction of the sediment consolidation settlement.
During the consolidation settlement,the deposited sediment void ratio is expected to exceed 10.0 in the early consolidation stage,and the deposited sediment layer is expected to be in softly plastic status with the effective stress in sediment particles or foc structures at a very low level. Meanwhile,the deposited sediment settlement rate is relatively high as compared with the EPP dissipation rate because of the long seepage distance and small hydraulic gradient in the deposited sediment layer.The deposited sediment pore water seepage rate far below the settlement deformation rate may naturally produce the asynchronous hysteretic coupling phenomenon in the deposited sediment self-weight consolidation settlement stage,and further result in EPP dissipation far slower than deposited sediment consolidation settlement.
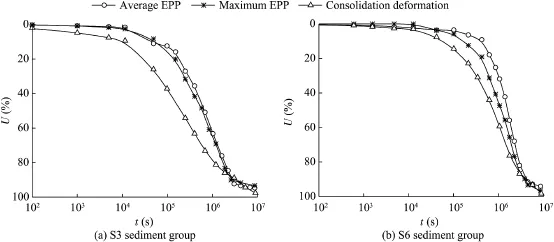
Fig.10.Comparison of consolidation ratio curves determined by settlement deformation and EPP dissipation.
5.Deposited sediment consolidation constitutive equations
According to the Terzaghi theory of small-strain consolidation calculation,there is a linear relationship between the effective stress and consolidation deformation under the assumptions that soil particles are linearly elastic,and the hydraulic conductivity and the coeffcient of volume compressibility of deposited sediment are constant.However, for the consolidation settlement of high moisture-content deposited sediment with large strains and nonlinear characteristics,nonlinear consolidation constitutive equations should be applied in the consolidation calculation to refect the development of effective stress and hydraulic conductivity.
A great deal of research has been performed in the development of nonlinear consolidation constitutive equations in different forms through experimental or theoretical methods (Hong,1987;Townsend and Mcvay,1990;Fox et al.,2005). Bartholomeeusen et al.(2002)showed signifcant differences among the predicted results of a hydraulic-flled soft soil foundation settlement obtained by different researchers using the constitutive equations they proposed,which were mainly due to the applicable range of different constitutive equations.
In the consolidation settlement process,the sediment self weight is the main consolidation load.Thus,the consolidation constitutive equations and consolidation parameters should be reasonably determined through sediment consolidation settlement experiments.
5.1.Hydraulic conductivity constitutive equation
We know that it is diffcult to determine the hydraulic conductivity of deposited sediment in the fuid state through conventional laboratory experiments because of its high void ratio and sediment particle nonuniform distribution.The deposited sediment consolidation settlement experiment is a typical unconventional experiment for hydraulic conductivity tests,and the relationships between the hydraulic conductivity,average void ratio,and sediment particle volume fraction can be obtained by Eq.(4)(Pane and Schiffman,1997):

wherekis the average hydraulic conductivity of deposited sediment(m/s),Gwis the specifc gravity of water,and φ is the sediment particle volume fraction.
According to Eq.(4),the hydraulic conductivity is mainly determined by the interface settlement rate and average void ratio of deposited sediment,and both of these factors can be obtained through the deposited sediment consolidation settlement experiment.In order to obtain a hydraulic conductivity constitutive equation generally applicable to large-strain consolidation calculation,the relationship between the average hydraulic conductivity of deposited sediment and average sediment particle volume fraction was obtained,as shown in Fig.11,based on consolidation settlement experiments of the six groups of suspended sediment,listed in Table 1.
Fig.11 shows that the average hydraulic conductivity nonlinearly decreases with the increase of the average particle volume fraction during the deposited sediment consolidation settlement process.A power function can be adopted to ft the hydraulic conductivity constitutive equation in the form of Eq.(5):

whereKkis the permeability parameter(m/s),andmis the permeability index.With the data from the deposited sediment consolidation settlement experiment,the two parameters can be determined to beKk=4.0×10⁻¹⁴m/s andm=-7.96, respectively.It should be mentioned that deposited sediment, with the average particle volume fraction lower than 0.042 or the average void ratio higher than 23.0,is in the suspension fuid state,and the concept of hydraulic conductivity is meaningless in this case.
5.2.Effective stress constitutive equation
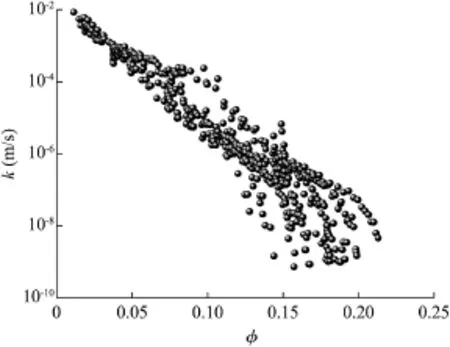
Fig.11.Relationship between hydraulic conductivity and particle volume fraction.
The effective stress constitutive equation for a stable deposited sediment consolidation settlement process can be ftted based on the effective stress and void ratio distributions in the settlement direction.In fact,the effective stress and void ratio of deposited sediment can be obtained through the layer sampling method,and their relationship can be described. Under the assumptions that EPP dissipates completely and that the specifc gravity of sediment is constant during the consolidation settlement process,the total stress distribution in the settlement direction can be obtained according to the saturated bulk density distribution by Eq.(6):

where σiis the total stress in theith sampling layer(Pa),withinumbered from the bottom of the deposited sediment layer;Nis the number of sampling layers;ρsatis the saturated bulk density of sediment(g/cm3);djis the thickness of thejth sampling layer(m),withi≤j≤N;andgis the gravitational acceleration(m/s2).
The effective stress distribution in the settlement direction can also be determined by Eq.(7)according to the effective stress principle proposed by Terzaghi:

A series of deposited sediment consolidation settlement experiments lasting different periods of time was carried out in this study,with the longest experimental time being about 120 days.Variations of the deposited sediment effective stress with the void ratio and particle volume fraction in the short term(from 30 to 100 days)and 120-day consolidation settlement experiments are shown in Fig.12.
Fig.12 shows that the deposited sediment effective stress increases nonlinearly with the decrease of the void ratio in the self-weightconsolidationsettlementstage,and,withtheincrease oftheeffectivestress,thevoidratiotendstobeavalueof3.0.The effective stress on a logarithmic scale varying with the average particle volume fraction in Fig.12(b)shows a signifcant linear relationship.Thus,apowerlawequationofEq.(8)canbeapplied to ftting the effective stress constitutive equation:

where σ′is the deposited sediment effective stress(Pa),Kσthe effective stress parameter(Pa),andnis the effective stress index.
In contrast to the results of the short-term consolidation settlement experiment shown in Fig.12,the results of the 120-day consolidation settlement experiment are more reasonable. The correlation coeffcient between Eq.(8)and the results of the 120-day consolidation settlement experiment is 0.833. Based on the results of the 120-day consolidation settlement experiment,the parametersKσ=4.0× 10⁻¹⁴Pa andn=3.215 2 can be determined respectively for the effective stress constitutive equation.
6.Conclusions
In this study,sediment settlement experiments were performed using a settlement column.The main conclusions are as follows:
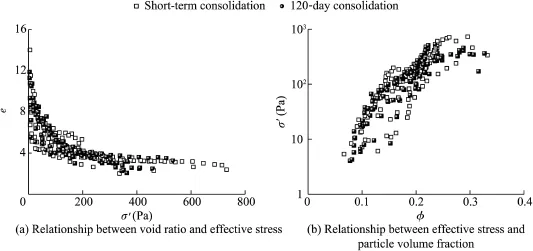
Fig.12.Variations of effective stress with void ratio and particle volume fraction.
(1)The sediment settlement process can be divided into three different stages:the initial free settlement,hindered settlement,and self-weight consolidation settlement stages,in which sediment particle statuses change continuously.The interface settlement rate follows different attenuation rules:it is constant in the initial free settlement stage and linearly attenuated with time on bilogarithmic scales in the hindered and self-weight consolidation settlement stages.
(2)The initial void ratio for the division of the initial free settlement and hindered settlement stages,obtained by the suspended sediment interface location method,is larger than that obtained by the settlement curve method.The initial void ratio is mainly infuenced by the initial sediment concentration and liquid limit properties of sediment.
(3)The self-weight load of deposited sediment is linearly distributed in the settlement direction,but EPP distribution in the settlement direction shows signifcant nonlinear characteristics.Deposited sediment consolidation settlement is faster than EPP dissipation,and the maximum difference between the consolidation ratios determined by settlement deformation and EPP dissipation at the same time is about 30%.
(4)Consolidation constitutive equations in the form of power functions for the hydraulic conductivity and effective stress,applicable to large-stain consolidation calculation,were worked out.The permeability parameter and permeability index are 4.0×10⁻¹⁴m/s and-7.96,respectively,for the hydraulic conductivity constitutive equation.The effective stress parameter and effective stress index are 4.0×10⁻¹⁴Pa and 3.215 2,respectively,for the effective stress constitutive equation.
Abu-Hejleh,A.N.,Znidarci,D.,Barnes,B.L.,1996.Consolidation characteristics of phosphatic clays.J.Geotechnical Eng.122(4),295-301.http:// dx.doi.org/10.1061/(ASCE)0733-9410(1996)122:4(295).
Bartholomeeusen, G., Sills, G.C., Znidarcic, D., Kesteren, W.V., Merckelbach,L.M.,Pyke,R.,Carrier,W.D.,Lin,H.,Penumadu,D., Winterwerp,H.,et al.,2002.Sidere:Numerical prediction of large-strain consolidation.Geotechnique 52(9),639-648.http://dx.doi.org/10.1680/ geot.2002.52.9.639.
Been,K.,Sills,G.C.,1981.Self-weight consolidation of soft soils:An experimental and theoretical study.Geotechnique 31(4),519-535.http:// dx.doi.org/10.1680/geot.1981.31.4.519.
Bryant,W.R.,Hottman,W.,Trabant,P.,1975.Permeability of unconsolidated and consolidated marine sediments,Gulf of Mexico.Mar.Geotechnol. 1(1),1-14.http://dx.doi.org/10.1080/10641197509388149.
Carrier,W.D.,Bromwel,L.G.,Somogyi,F.,1983.Design capacity of slurried mineral waste ponds.J.Geotechnical Eng.109(5),699-716.http://dx.doi. org/10.1061/(ASCE)0733-9410(1983)109:5(699).
E,J.,Chen,G.,Sun,A.R.,2009.One-dimensional consolidation of saturated cohesive soil considering non-Darcy fows.Chin.J.Geotechnical Eng. 31(7),1115-1119(in Chinese).http://dx.doi.org/10.3969/j.issn.1000-6915.2013.09.027.
Fox,P.J.,Lee,J.,Qiu,T.,2005.Model for large strain consolidation by centrifuge.Int.J.Geomechanics 5(4),267-275.http://dx.doi.org/10.1061/ (ASCE)1532-3641(2005)5:4(267).
Gibson,R.E.,England,G.L.,Hussey,M.J.L.,1967.The theory of one dimensional consolidation of saturated clays,I:Finite nonlinear consolidation of thin homogeneous layers.Geotechnique 17(2),261-273.http:// dx.doi.org/10.1680/geot.1967.17.3.261.
Gibson,R.E.,Schiffman,R.L.,Cargill,K.W.,1981.Theory of onedimensional consolidation of saturated clays,II:Finite nonlinear consolidation of thick homogeneous layers.Can.Geotechnical J.18(2),280-293. http://dx.doi.org/10.1139/t81-030.
Guo,S.J.,Zhang,F.H.,Wang,B.T.,Zhang,C.,2012.Settlement prediction model of slurry suspension based on settlement rate attenuation.Water Sci. Eng.5(1),79-92.http://dx.doi.org/10.3882/j.issn.1674-2370.2012.01.008.
Hong,Z.S.,1987.One-dimensional mathematical model for large-strain consolidation of dredged-fll soil.J.Hohai Univ.(Nat.Sci.)15(6), 27-36(in Chinese).
Imai,G.,1980.Setting behavior of clay suspension.Soils Found.20(2), 61-77.http://dx.doi.org/10.3208/sandf1972.20.2_61.
Imai,G.,1981.Experimental studies of sedimentation mechanism and sediment formulation of clay materials.Soils Found.21(1),7-20.http://dx. doi.org/10.3208/sandf1972.21.7.
Koppula,S.D.,Morgenstern,N.R.,1982.On the consolidation of sedimenting clays.Can.Geotechnical J.19(3),260-268.http://dx.doi.org/10.1139/t82-033.
Li,F.G.,Yang,T.S.,2006.Review for the research of interface settling velocity in concentrated suspension.J.Hydroelectr.Eng.25(4),57-61(in Chinese).
Ma,K.S.,Pierre,A.C.,1998.Microstructure of kaolinite sediments made with unaged FeCl3.Colloids Surfaces 4(45),175-184.http://dx.doi.org/10. 1016/S0927-7757(98)00685-2.
Merckelbach,L.M.,2000.Consolidation and Strength Evolution of Soft Mud Layers.Ph.D.Dissertation.Technische Universiteit Delft,Delft.
Michaels,A.S.,Bolger,J.C.,1962.Settling rates and sediment volumes of focculated kaolin suspensions.Industrial Eng.Chem.Res.1(1),24-33.
Monte,J.L.,Krizek,R.J.,1976.One-dimensional mathematical model for large-strain consolidation.Geotechnique 26(3),789-794.http://dx.doi. org/10.1680/geot.1976.26.3.495.
Pane,V.,Schiffman,R.L.,1985.A note on settlement and consolidation. Geotechnique 35(1),69-72.
Pane,V.,Schiffman,R.L.,1997.The permeability of clay suspensions.Geotechnique 47(2),273-288.http://dx.doi.org/10.1680/geot.1997.47.2.273.
Qian,J.H.,Yin,Z.Z.,1996.Geotechnical Principle and the Computation. China Water Power Press,Beijing(in Chinese).
Townsend,F.C.,Mcvay,M.C.,1990.Large strain consolidation predictions.J. Geotechnical Eng.116(2),222-243.http://dx.doi.org/10.1061/(ASCE) 0733-9410(1990)116:2(222).
Xu,G.Z.,Gao,Y.F.,Hong,Z.S.,Ding,J.W.,2012.Settlement behavior of four dredged slurries in China.Mar.Georesources Geotechnol.30(2),143-156. http://dx.doi.org/10.1080/1064119X.2011.602382.
Zhan,L.T.,Tong,J.,Xu,J.,2008.Laboratory study on self-weight settlement and consolidation behaviors of hydraulic-dredged mud.J.Hydraulic Eng. 39(2),201-205(in Chinese).http://dx.doi.org/10.3321/j.issn:0559-9350. 2008.02.012.
Zhu,Z.F.,Yang,T.S.,Zhao,M.,Liang,C.H.,2009.Preliminary study on the critical criterion for distinguishing foc sedimentation and gel-like network sedimentation.J.Sediment Res.(1),20-25(in Chinese).http://dx.doi.org/ 10.3321/j.issn:0468-155X.2009.01.004.
Received 21 May 2015;accepted 5 October 2015
Available online 12 December 2015
This work was supported by the Fundamental Research Funds for the Central Universities(Grant No.2009B13514)and the Doctoral Fund of the Ministry of Education of China(Grant No.20100094110002).
*Corresponding author.
E-mail address:ggssjj@hhu.edu.cn(Shuai-jie Guo).
Peer review under responsibility of Hohai University.
http://dx.doi.org/10.1016/j.wse.2015.10.002
1674-2370/©2015 Hohai University.Production and hosting by Elsevier B.V.This is an open access article under the CC BY-NC-ND license(http:// creativecommons.org/licenses/by-nc-nd/4.0/).
 Water Science and Engineering2015年4期
- Water Science and Engineering的其它文章
- Temporal and spatial distribution characteristics of water resources in Guangdong Province based on a cloud model
- Analysis and prediction of reference evapotranspiration with climate change in Xiangjiang River Basin,China
- Analysis of spatio-temporal evolution of droughts in Luanhe River Basin using different drought indices
- Effects of temporal variability on HBV model calibration
- Impacts of water quality variation and rainfall runoff on Jinpen Reservoir, in Northwest China
- Analysis of effect of nicotine on microbial community structure in sediment using PCR-DGGE fngerprinting
